imaging volume of a magnetic resonance imaging (MRI) scanner ..... [2] âA primer on medical device interactions with magnetic resonance imaging systems ...
Proceedings of the 2006 IEEE International Conference on Robotics and Automation Orlando, Florida - May 2006
Numerical Simulations and Lab Tests for Design of MR-Compatible Robots Kiyoyuki Chinzei, Kiyoshi Yoshinaka and Toshikatsu Washio Surgical Assist Technology Group Institute for Human Science and Biomedical Engineering National Institute of Advanced Industrial Science and Technology (AIST) 1–2–1, Namiki, Tsukuba, Ibaraki, 305–8564, Japan Email: {k.chinzei |k.yoshinaka |washio.t}@aist.go.jp Abstract— A numerical simulation of the magnetic field in the imaging volume of a magnetic resonance imaging (MRI) scanner and a method for quick searches for electromagnetic noise source are proposed as part of the design and development process for surgical robots that are compatible with MRI. Although MR compatibility is a major challenge for development of such robots, no simulation method was known that could predict it. This paper demonstrates the potential of two basic techniques that will be useful in predicting the magnetic and electromagnetic compatibility. First, the distortion of the magnetic field caused by the robot can be computed by a finite element method. Simulation of the resonance signal distribution showed good agreement with experimentally obtained signal distributions. Second, a noise source and its strength can be visualized by a spectrum analyzer.
I. I NTRODUCTION Magnetic resonance imaging (MRI) has been proven effective for surgery [1]. MR images are associated with a fixed 3D coordinate system (image coordinates) and it is feasible to combine them with a coordinate-driven robot so that the robot approaches a target such as a tumor by following a 3D trajectory defined using the image coordinates (Fig. 1). However, such robots have been difficult to realize because of hardware limitations arising from the MR compatibility issues. The US Food and Drug Administration (FDA) has developed draft guidance on MR safety and compatibility [2]. Schenck described magnetic compatibility issues in detail [3]. Masamune et al. demonstrated the possibility of an MRcompatible robot by constructing one with mainly plastics, ceramics and ultrasonic motors [4]. Chinzei et al. classified the design criteria of surgical robots to be MR compatible and validated that a developed robot was MR compatible in that the robot could move during imaging without the scanner and the robot affecting each other [5], [6]. Fischer et al. developed a commercial grade biopsy robot for use within closed-bore MRIs [7]. Development of MR-compatible robots has increased recently; for examples, see [8]–[18]. There are also studies of MR-compatible actuators [19]–[24] and sensors [25]–[27]. Although such attempts are increasing, the development process itself remains difficult, or at least time consuming. To the authors’ knowledge, (1) there is no simulation method to estimate MR compatibility, and (2) any MR-compatible
0-7803-9505-0/06/$20.00 ©2006 IEEE
Fig. 1. Examples of MR-compatible robots: a biopsy needle locator robot (upper); and an endoscope manipulator (bottom).
examinations must be conducted with MR scanners. Thus, there is no computer- assisted engineering tool, and any minor (but perhaps significant in terms of MR compatibility) modifications to the robot must be checked for compatibility with a scanner. This would have slowed development and limited optimization. These problems may have also affected cost-effectiveness, because MR-compatible parts are usually significantly more expensive than common parts, and, finally, it may have limited research and commercial applications. In this paper, we demonstrate a numerical simulation of magnetic compatibility and an easy laboratory test of electromagnetic compatibility (EMC) that can help with the design of MR-compatible devices, including robots. The simulation
3819
is an electromagnetic finite element computation. The novelty of this work lies in the following: (1) the reduction of underflow error to properly simulate field changes caused by paramagnetic objects; (2) the determination of initial and boundary conditions that can realistically simulate the MRI magnetic field and interference from paramagnetic objects; and (3) the importation of IGES file format from CAD programs. Comparison to experimentally obtained distributions showed good agreement. The laboratory test of EMC detects noise sources using a spectrum analyzer. This method can quickly check whether and from where robot circuitry is emitting noise that can affect the image quality. The strength of this method is that can be applied in the laboratory without occupying or using an MRI scanner. The numerical simulation and the EMC test will be useful in speeding up the preliminary stages of development before starting design and manufacturing of a robot. This paper first reviews MR compatibility and the concerns regarding a surgical robot working within or in the vicinity of the imaging volume, followed by requirements for the design assistance methods. We will demonstrate the effectiveness of these methods with two experiments. II. S IMULATING AND TESTING MR COMPATIBILITY A. MR compatibility of surgical robot The definition of MR compatibility is found in the FDA document [2]: ‘This term indicates that the device, when used in the MR environment, is MR Safe and has been demonstrated to neither significantly affect the quality of the diagnostic information nor have its operations affected by the MR device.’ The definition of MR safe is: ‘This term indicates that the device, when used in the MR environment, has been demonstrated to present no additional unacceptable1 risk to the patient, but may affect the quality of the diagnostic information’ [2]. The document also gives examples of possible hazards and concerns within the MR environment. When one intends to operate a surgical robot within or in the vicinity of the imaging volume, the following concerns arise [5]. (Safety concerns to the human body are not discussed here.) 1) Magnetic attraction: The magnetic field (0.1–3 Teslas) attracts ferromagnetic objects. Steel springs, electromagnetic actuators, e.g., motors, brakes, clutches and relays, may not work as expected. 2) Inhomogeneity of the magnetic field: MRI requires good homogeneity of the magnetic field in the order of parts per million (ppm). A foreign object can distort the field, depending on its position, volume and magnetic susceptibility. Even paramagnetic objects can affect the scanner when they are close to the imaging volume. 3) Noise in imaging: A robot’s electric circuits may radiate electrical noise. Wiring can induce noise from outside. Both will significantly reduce image quality. 1 The word unacceptable is inserted by the author for the conformity to the definition of safety in ISO/IEC Guide63. Newer definition of MR safety in [28] also has the issue of the conformity to ISO/IEC.
4) Noise in the robot circuitry: Pulsed radio frequency fields (at the resonance frequency, up to kilowatts) may be induced in a robot’s sensor signal, which will result in erroneous behavior. 5) Coupling to MRI circuit: Foreign conductive objects can cause ‘coupling’ to the MRI circuit, in particular to the RF probe, an antenna that receives the resonance signal. The coupling alters the properties of the probe and lowers the image quality. The coupling also induces noise in the MRI. Concerns 1 and 2 are related to magnetic compatibility, while 3 to 5 are related to electromagnetic compatibility. B. Simulation and test in the design process In terms of efficiency in the development process, it would be ideal if both compatibility issues could be estimated by numerical simulations that share geometric and other information with computer- aided design (CAD) systems. Ideally, the simulation would (i) be reliable so one could omit validation experiments, (ii) be valid for different imaging conditions such as imaging sequences, and (iii) be able to simulate the resulting image and performance of the robot. Unfortunately, current simulation techniques are not at this level. The authors propose a combination of simulation and simple experiment that can be used for preliminary estimation in the design process. 1) Estimation of the field inhomogeneity: This corresponds to concern 2 (inhomogeneity). Another magnetic compatibility issue, magnetic attraction, can also be numerically estimated; however, the best tactic against it is not to use ferromagnetic material in the vicinity of the scanner. Therefore, we did not consider computing attraction forces. Any existing electromagnetic finite element programs can do this computation. However, it was necessary to consider the following circumstances which are specific to the application: (i) the materials of concern are paramagnetic, while electromagnetic FEMs are usually optimized to solve the effects of ferromagnetic materials; (ii) ppm-order precision is required; (iii) gradient and dynamic fields are applied; and (iv) an induced field is also applied. Currently the output of the simulation is the distribution of the magnetic field, while the final evaluation requires a measure of MR compatibility. We addressed all of these issues except (iv). Because estimating image quality from the distribution of the field would be difficult and depends on the imaging sequence, we adopted the spectrum of the resonance signal as the measure of magnetic compatibility [3], [29]. Because there are other factors (e.g., concern 5) that affect the spectrum, it is necessary to normalize the numerically estimated spectrum with an experimentally observed spectrum. 2) Detection of noise source: This corresponds to concern 3 (noise in images). The effect on imaging is determined by the noise component around the resonance frequency. The noise picked up by the RF probe can mask the true resonance signal. Therefore, if one can simulate the existence and the strength of such noise, the effect of the noise may be predicted. Unfortunately, currently available electromagnetic noise simulators
3820
are mainly for circuit board design and simulate quite high frequencies (GHz or greater) and are not suitable for our purposes. The authors found that, instead of simulating it, a spectrum analyzer could detect and visualize noise around the resonance frequency. Estimation of other effects of concern, such as noise from the MRI to the robot, the effect of coupling and biological effects are not discussed in this paper. We demonstrate the methods of numerical simulation and noise visualization with a few applications in the following section.
Fig. 2. Picture and CAD drawing of the test part, which was part of an end effector described in Koseki et al. [9]. It was made from titanium alloy.
III. M ATERIALS AND M ETHODS A. Estimation of the field inhomogeneity
MRI
A finite element program MagNet ver. 6.15 (Infolytica Corp., Montr´eal, Qu´ebec) was used for the simulation. The field distribution around a paramagnetic object placed in the static field and the gradient field for the frequency encoding were simulated. This corresponds to placing the object within the imaging volume. The static field was given by the field strength of the scanner. The gradient field depends on the internal structure of the scanner. In this paper, we modeled two pairs of solenoids to simulate the scanner used in the experiment as described later. A paramagnetic object can be modeled by its shape and its magnetic susceptibility. However, electromagnetic FEM programs require magnetic permeability, not susceptibility, because most applications are simulations of magnetic circuits, which usually assume interactions of ferromagnetic objects. In contrast, materials used in MR-compatible robots are paramagnetic, not ferromagnetic. Theoretically the permeability μ and susceptibility χ are interchangeable by the equation μ = 1+χ. However, paramagnetic materials’ susceptibilities are much smaller than one, see Table I. Therefore, permeability-based computation can easily cause underflow. To avoid this, we multiplied the susceptibility by a constant, e.g., 103 –104 for titanium. The flux density B, the field H and the permeability have the following relation. B = (1 + kχ)H H is easily derived from the flux density of the MRI static and gradient fields. After computing B using kχ, the actual change caused by the objects, dB, is calculated by the following equation. dB = (B − H)/k, then the final field strength is calculated as |H + dB|. To evaluate the accuracy of the simulation, we compared the experimentally observed resonance spectrum with the simulated spectrum computed from the simulated field distribution. A part of a robotic mechanism in Koseki et al. [10] made with titanium alloy was placed beside a cylindrical container TABLE I M AGNETIC SUSCEPTIBILITY (χ) OF MATERIALS χ (×10−6 )
Al2 O3 −18.1
H2 O −9.05
Air 0.36
Al 20.7
Ti 182
316L 9000
P 5 Gauss
1
F
2 [m]
S
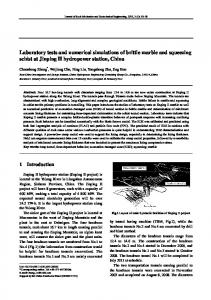
Fig. 3. Experimental setting: Layout in the scanner (left). The phantom and the robot part were placed at the center of the scanner (P) to evaluate the numerical simulation. For the noise detection test, the emitting antenna of the function generator (F) and the search coil of the spectrum analyzer (S) were placed as shown. The robot part was placed beside the phantom (right).
filled with the phantom fluid (NiCl2 solution), then scanned by an open configuration 0.3 Tesla scanner (AIRIS–II, Hitachi Medical Corp., Tokyo). The geometric shape of the robot part tube was modeled using a CAD program (Pro/Desktop 8, PTC Corp., Needham, MA). The dimensions were measured by the author using calipers. An IGES solid model file exported from the CAD program was imported by the FEM program and the corresponding mesh was obtained. The field distribution was computed on a Dell Inspiron (PentiumM 1 GHz, 1 GB RAM) computer and took four hours. The simulated spectrum was calculated by segmenting the phantom into cells, then obtaining a histogram of the resonance frequency of each cell with the frequency shift caused by the magnetic field at the position of the cell . Although the area of the spectrum is correlated with the signal strength, it is not reliable enough to be used for normalization by this amount because of uncalculated factors such as the coupling effect. Therefore, the spectra were normalized by their height. The experiment and the comparison were performed under the following conditions: (A) without the robot part (phantom only, as the baseline), and (B) with the robot part. The robot part was placed on the positive gradient side. The spectrum was obtained by the prescan sequence, a special sequence that applies bidirectional frequency encoding instead of phase encoding. Its bandwidth (B/W) was 7.2 kHz. A 2D image was obtained by the spin echo sequence with TR/TE = 500/40 msec, B/W = 7.2 kHz, size of the field of view (FOV) = 260 mm. Fig. 2 is a picture of the robot part and its CAD drawing. Experimental settings are shown in Fig. 3.
3821
Normalized signal strength
1
Ex. phantom with Ti pipe Calc. phantom with Ti pipe
0.8 0.6 0.4 0.2
-100
0 -50 0 50 Frequency (Hz) (center = 12.7MHz = MRI's resonance)
Normalized signal strength
B. Visualization of electromagnetic noise 1) Noise and imaging: To see if the noise detected by a spectrum analyzer corresponds to the image noise, we artificially emitted noise from a function generator and observed the effect on the image and the spectrum distribution at the same time. The experiment was done using the 0.3 Tesla MRI described above. Its resonance frequency was 12.709945 MHz and the bandwidth of the receiver was set to 7.2 kHz. A spherical phantom (160 mm diameter) was placed in the MRI and 2D prescan images (TR/TE = 500/40 msec, FOV = 260 mm) were obtained. A spectrum analyzer with a search coil (R3132 and TR10207, Advantest Corp., Tokyo) was used to visualize the spectrum distribution of radio waves around the resonance frequency. A function generator (33250A, Agilent Technologies, Palo Alto, CA) was used to generate a sine wave signal. These were placed as shown in Fig. 3. Three conditions were examined: (0) no signal from the function generator (the baseline); (1) a signal at the resonance frequency; and (2) a signal of 11 MHz, which was outside the receiver bandwidth of the MRI. In each case the image of the phantom, the resonance frequency and the signal to noise ratio (SNR) described in Chinzei et al. [29] were measured. 2) Detection of noise source from ultrasonic motor: To demonstrate the possibility of noise visualization, we examined the ability to detect noise from an ultrasonic motor. The motor used was a USR–60N nonmagnetic motor with amplifier D6060 (Shinsei Kogyo, Tokyo). This motor has previously been used in several robots from different groups [6], [7], [18]. The authors found that this motor sometimes radiated noise to the image. The authors inserted a π-type low pass filter (56–705–005, Spectrum Control Inc., Fairview, PA) between the amplifier and the motor to suppress the noise. In this experiment, we used the search coil of the spectrum analyzer to find where the noise leaked. We also compared the noise with and without the low pass filter. The experiment was done at our laboratory.
1
100
Ex. phantom with Ti pipe Calc. phantom with Ti pipe
0.8 0.6 0.4 0.2
-100
0 -50 0 50 Frequency (Hz) (center = 12.7MHz = MRI's resonance)
100
Fig. 4. Spectra obtained (A) without the robot part (top) and (B) with the robot part (bottom). The broken line shows the numerically obtained spectrum, and the solid line shows the experimentally observed spectrum.
IV. R ESULTS A. Estimation of the field inhomogeneity The experimentally and numerically obtained spectrum curves and the corresponding MR images are shown in Figures 4 and 5. The shape of the robot part appeared as the void (black) region. The void was larger than the size of the part. It was considered that field distortion together with the conductivity reduced the resonance signal from the surrounding fluid. The spectra agreed excellently in the baseline, while the simulated spectrum with the robot part had greater attenuation at the lower frequency side below the resonance peak. The higher frequency side agreed well with the experiment. B. Visualization of electromagnetic noise 1) Noise and imaging: The phantom images obtained and the screen images of the spectrum analyzer are shown in Fig. 6. ‘S’ in an arrow means the MR resonance signal and ‘N’ in an arrow means the artificial noise. SNRs were 44.0, 12.3 and 44.0 dB, respectively. The background noise was
Fig. 5. Observed MR images (A) without the robot part (left) and (B) with the robot part (right).
−71 dBm, while the artificial noise was ca. −66 dBm. When the noise was within the bandwidth of the scanner, a strong artifact appeared at the corresponding position. When the noise was out of the bandwidth, there was no apparent effect in the image, and the SNR was not changed from the baseline condition. 2) Detection of noise source from ultrasonic motor: It was found that the amplifier emitted most of the noise, and some noise also came from the cable to the motor. The motor emitted ca. −68 dBm noise at 12.7 MHz without the low pass filter. With the filter, emission was reduced to −82 dBm. When the filter was inserted, the emission from the cable
3822
Signal strength (dBm)
from CAD programs via the IGES format. Concluding this experiment, the proposed method can simulate the effect of a paramagnetic object that enters the imaging volume. By investigating the extent to which the inhomogeneity was acceptable, this simulation will be useful for designing similar portions of robots, typically end effectors. S+N
S
-64
N S
B. Detection of noise source
-69 -74
6
11 (0) No noise
16 6
11 16 6 11 16 Frequency (MHz) (1) Noise at 12.7 MHz (2) Noise at 11 MHz
Fig. 6. Images of spherical phantoms and spectrum peaks with (0) no noise added (left), (1) noise at 12.709935 MHz (= resonance frequency) (middle) and (2) noise at 11 MHz (right). When the noise was in the bandwidth of the scanner, it masked the image signal (middle). When it was out of the bandwidth (right), no effect was observed and the SNR was the same as the baseline condition (left).
Signal strength (dBm)
-64 ca. 170 kHz
(a) motor turn on
C. Future work
-74
-84 -89 11
(b) motor power off 12 Frequency (MHz)
The correlation of the noise and the bandwidth of the MR scanner agreed with the theory, and the effect of noise reduction was visualized by the spectrum analyzer. The harmonic components from the motor amplifier were probably the source of the noise. When the rotation rate was changed, the harmonic components shifted. When any peaks of the harmonics enter the bandwidth of the scanner, there will be noise in the image. To validate the MR compatibility of an ultrasonic motor-driven device, one should set the rotation rate of the motors so that the harmonic components are within the bandwidth, not necessarily at the fastest speed.
13
Fig. 7. Spectrum peaks of noise radiated by a turning ultrasonic motor. When motor power was turning (a), periodic peaks appeared at ca. 170 kHz and ca. 40 kHz, while the the noise level was low when the motor power was turned off (b).
was also smaller at the far side from the amplifier. These results suggested that the turning motor was the source of the noise. The spectrum also revealed that there were periodic peaks of noise from the amplifier at ca. 170 kHz and ca. 40 kHz intervals7. These were considered to be the harmonic components of the vibration of the ultrasonic motor, which is around 42 kHz. By changing the rotation rate, a shift of the harmonic components was observed. V. D ISCUSSION A. Estimation of the field inhomogeneity The agreement between the simulation and the experiment was excellent except on the lower frequency side below the resonance peak. The part was indeed placed at the positive gradient side, where the higher frequency components appear in the spectrum. Therefore, the influence of the part on the magnetic field is not likely to be the cause of the disagreement on the lower frequency side. The authors consider that the cause of the disagreement is the change of RF probe characteristics caused by coupling with the robot part. The FEM program is able to import complex solid objects imported
The authors consider that the following issues require further investigation. 1) Simulation of the effect of induced currents: In the homogeneity estimation, the effect of the induced field is not simulated. To simulate the effect of a metallic object precisely, it is necessary to include the induction in the simulation. Although it is not particularly difficult to do this, a conductive object would also affect imaging by its coupling to the RF probe. Estimation of this effect requires modeling the RF probe and the internal structure of the scanner, which makes the simulation complex. We will investigate the extent to which the effect of inductive coupling should be considered (or when we can ignore it) and methods of validating this extension. 2) Simulation of the field distribution outside the imaging volume: This program can solve the field distribution with the field sources given as functions, such as solenoids. This simulation is useful for assessing the effect of a robot entering the imaging volume. In practice, the effect when the robot does not enter the imaging volume is also useful, particularly when the volume of the robot is large. To compute this situation, the FEM program must be able to accept complex field distributions, which are probably difficult to express by functions. Currently the authors are working for implementing the simulation on the FEM programs with this capability. 3) Quantitative noise test: The experiment described here was insufficient to conclude that this method could detect any noise that would affect the image quality. To validate the ability of this method quantitatively, the authors plan to conduct more precise experiments with carefully designed protocols. To do a simulation, the properties of the noise source and of the emission from the wiring will be necessary. The authors think that it will be possible to develop such a simulation method combined with experimental measurements.
3823
VI. C ONCLUSION A method for numerical simulation of the effect of a paramagnetic object on the magnetic field and a quick test method to find the source of electromagnetic noise were introduced. Numerically and experimentally obtained resonance spectra were compared and gave excellent agreement, except on the lower frequency side below the resonance peak. The cause of the disagreement was considered to be the change of RF probe characteristics, not a magnetic effect. By determining the tolerance of the inhomogeneity, this method will be useful for designing similar portions of robots, typically end effectors. The noise search test could visualize the noise sources in the imaging with a spectrum analyzer. The visualization was also able to show that an ultrasonic motor could emit harmful noise while rotating at less than its maximum rate. Although we are not currently able to predict the degree of noise in the MRI quantitatively, the authors consider this test will form a part of quantitative simulation of noise distribution. ACKNOWLEDGMENT Part of this work has been funded by NEDO grant #02A47019b and AIST. R EFERENCES [1] F. A. Jolesz, P. R. Morrison, S. J. Koran, R. J. Kelley, S. G. Hushek, R. W. Newman, M. P. Fried, A. Melzer, R. M. Seibel, and H. Jalahej, “Compatible instrumentation for intraoperative MRI: Expanding resources,” J Magn Reson Imaging, vol. 8, no. 1, pp. 8–11, 1998. [2] “A primer on medical device interactions with magnetic resonance imaging systems,” CDRH, FDA,” Draft, Feb. 1997. [Online]. Available: http://www.fda.gov/cdrh/ode/primerf6.html [3] GE Medical Systems. (1997, Oct.) MR safety and MR compatibility: Test guidelines for Signa SPTM . [Online]. Available: http://www.gehealthcare.com/inen/rad/mri/products/spi/safety.html [4] K. Masamune, E. Kobayashi, Y. Masutani, M. Suzuki, T. Dohi, H. Iseki, and K. Takakura, “Development of an MRI-compatible needle insertion manipulator for stereotactic neurosurgery,” J Image Guid Surg, vol. 1, no. 4, pp. 242–8, 1995. [5] K. Chinzei, R. Kikinis, and F. A. Jolesz, “MR compatibility of mechatronic devices: Design criteria,” in Proc. MICCAI’99, ser. Lecture Notes in Computer Science, vol. 1679, Cambridge, UK, Sep. 1999, pp. 20–30. [6] K. Chinzei and K. Miller, “Towards MRI guided surgical manipulator,” Med Sci Monit, vol. 7, no. 1, pp. 153–63, 2001. [7] E. Hempel, H. Fischer, L. Gumb, T. Hohn, H. Krause, U. Voges, H. Breitwieser, B. Gutmann, J. Durke, M. Bock, and A. Melzer, “An MRI-compatible surgical robot for precise radiological interventions,” Comput Aided Surg, vol. 8, no. 4, pp. 180–91, 2003. [8] D. Kim, E. Kobayashi, T. Dohi, and I. Sakuma, “A new, compact MRcompatible surgical manipulator for minimally invasive liver surgery,” in Proc. MICCAI 2002, ser. Lecture Notes in Computer Science, vol. 2488, Tokyo, Japan, Sep. 2002, pp. 99–106. [9] Y. Koseki, T. Washio, K. Chinzei, and H. Iseki, “Endoscope manipulator for trans-nasal neurosurgery, optimized for and compatible to vertical field open MRI,” in Proc. MICCAI 2002, ser. Lecture Notes in Computer Science, vol. 2488, Tokyo, Japan, Sep. 2002, pp. 114–21. [10] Y. Koseki, R. Kikinis, F. A. Jolesz, and K. Chinzei, “Precise evaluation of positioning repeatability of MR-compatible manipulator inside MRI,” in Proc. MICCAI 2004, ser. Lecture Notes in Computer Science, vol. 3217, Rennes, France, Sep. 2004, pp. 192–9. [11] G. Fichtinger, A. Krieger, R. C. Susil, A. Tan´acs, L. L. Whitcomb, and E. Atalar, “Transrectal prostate biopsy inside closed MRI scanner with remote actuation, under real-time image guidance,” in Proc. MICCAI 2002, ser. Lecture Notes in Computer Science, vol. 2488, Tokyo, Japan, Sep. 2002, pp. 91–8.
[12] N. Hata, F. Ohara, R. Hashimoto, M. Hashizume, and T. Dohi, “Needle guiding robot with five-bar linkage for MR-guided thermotherapy of liver tumor,” in Proc. MICCAI 2004, ser. Lecture Notes in Computer Science, vol. 3217, Rennes, France, Sep. 2004, pp. 161–8. [13] K. Masamune, T. Inagaki, N. Takai, I. Sakuma, and T. Dohi, “MRI compatible manipulator: Image distortion estimation and correction method,” in Proc. CARS 2001, ser. International Congress Series, vol. 1230, Berlin, Germany, June 2001, pp. 1249–50. [14] J. B. Mathieu, S. Martel, L. Yahia, G. Soulez, and G. Beaudoin, “MRI systems as a mean of propulsion for a microdevice in blood vessels,” in Proc. IEEE Engineering in Medicine and Biology Society (EMBS 2003), vol. 4, Cancun, Mexico, Sep. 2003, pp. 3419–22. [15] N. Miyata, E. Kobayashi, D. Kim, K. Masamune, I. Sakuma, N. Yahagi, T. Tsuji, H. Inada, T. Dohi, H. Iseki, and K. Takakura, “Micro-grasping forceps manipulator for MR-guided neurosurgery,” in Proc. MICCAI 2002, ser. Lecture Notes in Computer Science, vol. 2488, Tokyo, Japan, Sep. 2002, pp. 107–13. [16] R. Moser, R. Gassert, E. Burdet, L. Sache, H. R. Woodtli, J. Erni, W. Maeder, and H. Bleuler, “An MR compatible robot technology,” in Proc. ICRA 2003, vol. 1, Taipei, Taiwan, Sep. 2003, pp. 670–5. [17] E. Taillant, J. C. Avila-Vilchis, Allegrini, I. Bricault, and P. Cinquin, “CT and MR compatible light puncture robot: Architectural design and first experiments,” in Proc. MICCAI 2004, ser. Lecture Notes in Computer Science, vol. 3217, Rennes, France, Sep. 2004, pp. 142–52. [18] F. Tajima, K. Kishi, K. Nishizawa, K. Kan, H. Ishii, K. Sudo, M. G. Fujie, T. Dohi, and S. Takamoto, “A prototype master-slave system consisting of two MR-compatible manipulators with interchangeable surgical tools: Part of a unified support system for diagnosis and treatment,” in Proc. ICRA 2004, vol. 3, New Orleans, LA, May 2004, pp. 2505–10. [19] G. Ganesh, R. Gassert, E. Burdet, and H. Bleuler, “Dynamics and control of an MRI compatible master-slave system with hydrostatic transmission,” in Proc. ICRA 2004, vol. 2, New Orleans, LA, May 2004, pp. 1288–94. [20] E. R. Gizewski, O. Koeze, K. Uffmann, A. De Greiff, M. E. Ladd, and M. Forsting, “Cerebral activation using a MR-compatible piezoelectric actuator with adjustable vibration frequencies and in vivo wave propagation control,” Neuroimage, vol. 24, no. 3, pp. 723–30, 2005. [21] S. M. Golaszewski, F. Zschiegner, C. M. Siedentopf, J. Unterrainer, R. A. Sweeney, W. Eisner, S. Lechner-Steinleitner, F. M. Mottaghy, and S. Felber, “A new pneumatic vibrator for functional magnetic resonance imaging of the human sensorimotor cortex,” Neurosci Lett, vol. 324, no. 2, pp. 125–8, 2002. [22] S. J. Graham, W. R. Staines, A. Nelson, D. B. Plewes, and W. E. Mcilroy, “New devices to deliver somatosensory stimuli during functional MRI,” Magn Reson Med, vol. 46, no. 3, pp. 436–42, 2001. [23] J. Vogan, A. Wingert, J. S. Plante, S. Dubowsky, M. Hafez, D. Kacher, and F. Jolesz, “Manipulation in MRI devices using electrostrictive polymer actuators: With an application to reconfigurable imaging coils,” in Proc. ICRA 2004, vol. 3, New Orleans, LA, May 2004, pp. 2498–504. [24] A. C. Zappe, T. Maucher, K. Meier, and C. Scheiber, “Evaluation of a pneumatically driven tactile stimulator device for vision substitution during fMRI studies,” Magn Reson Med, vol. 51, no. 4, pp. 828–34, 2004. [25] D. Chapuis, R. Gassert, L. Sache, E. Burdet, and H. Bleuler, “Design of a simple MRI/fMRI compatible force/torque sensor,” in Proc. IROS 2004, vol. 3, Sendai, Japan, Sep. 2004, pp. 2593–9. [26] M. Tada and T. Kanade, “An MR-compatible optical force sensor for human function modeling,” in Proc. MICCAI 2004, ser. Lecture Notes in Computer Science, vol. 3217, Rennes, France, Sep. 2004, pp. 129–36. [27] N. Takahashi, M. Tada, J. Ueda, Y. Matsumoto, and T. Ogasawara, “An optical 6-axis force sensor for brain function analysis using fMRI,” in Proc. IEEE Sensors 2003, vol. 1, Toronto, Canada, Oct. 2003, pp. 253–8. [28] Standard Practice for Marking Medical Devices and Other Items for Safety in the Magnetic Resonance Environment, ASTM International Std. F2503-05, Aug. 2005. [29] K. Chinzei, N. Hata, F. A. Jolesz, and R. Kikinis, “Surgical assist robot for the active navigation in the intraoperative MRI: Hardware design issues,” in Proc. IROS 2000, vol. 1, Takamatsu, Japan, Oct. 2000, pp. 727–32.
3824