AQUATIC MICROBIAL ECOLOGY Aquat Microb Ecol
Vol. 61: 249–260, 2010 doi: 10.3354/ame01452
Published online November 11
Contribution to AME Special 4 ‘Progress and perspectives in aquatic microbial ecology’
OPEN ACCESS
Nutrient pathways through the microbial food web: principles and predictability discussed, based on five different experiments Tron Frede Thingstad*, L. Antonio Cuevas Department of Biology, University of Bergen, PO Box 7003, 5020 Bergen, Norway
ABSTRACT: Although explanatory and predictive powers are 2 closely interconnected aspects of conceptual and mathematical models of complex systems, the two are not equivalent. The 2 aspects are discussed here for the microbial part of photic zone food webs of the marine pelagic. We focus on the specific question of how limiting nutrients are transferred from the dissolved form, through the microbial food web, to mesozooplankton. For this purpose, 5 different nutrient addition experiments are reviewed and compared to a ‘simplest possible’ conceptual food web model. The experiments range in scale from artificial food webs constructed in laboratory chemostats, via mesocosm experiments, to a Lagrangian open-ocean addition experiment and cover time scales from days to weeks. We conclude that main system responses in all cases can be explained within the framework of the simple model, and that each experiment therefore also adds credibility to the basic concepts of this model. However, different system attributes profoundly affect the pathway and speed of nutrient transfer in each experiment. A re-occurring theme seems to be how the interactions between flexible stoichiometry and predatory processes modify experimental outcomes. Understanding the flexibility in the behavior of the system has thus increased with each experiment, but the requirement for new ad hoc assumptions to be added to the basic model structure in each case makes reliable predictions of the experimental outcome appear only possible with further model elaboration. KEY WORDS: Microbial food web · Flexible stoichiometry · Predator control · Mesocosm Resale or republication not permitted without written consent of the publisher
INTRODUCTION Over the last ca. 30 yr, the perspective of the community of marine plankton ecologists has shifted from one emphasizing the simplicity of an ecosystem then believed to be dominated by a linear nutrients–phytoplankton–zooplankton food chain, to a present fascination for the increasing evidence of immense system complexity. The focus on complexity has largely been boosted by the recent applications of metagenomic techniques demonstrating high biodiversity in the lower, microbial, parts of the food web (Bench et al. 2007, DeLong 2009, Galand et al. 2009, Not et al. 2009). Coincidentally, this focus on system complexity has developed in parallel with an increasing demand for predictive models in the neighboring discipline of ocean biogeochemistry, a demand driven in particular
by the need for a realistic representation of the ocean’s C-cycle and related biogeochemistry in global circulation models (e.g. Le Quere et al. 2005). With this duality in contemporary marine microbial ecology, a fundamental question seems to be: How much of the system’s complexity needs to be explicitly represented in a model of the interactions between chemistry and biology, when the model’s goal is to provide predictive power for a changing ocean? The answer is not trivial, and if an answer to such a general question exists, it is not likely to be very precise. What is clear, however, is that complexity in detail does not in itself preclude simplicity at higher levels of organization. Traditional examples include the macroeconomic theories of Keynes (1936) and the laws of classical thermodynamics, both illustrating how relatively simple relationships may connect variables at a higher level without
*Email:
[email protected]
© Inter-Research 2010 · www.int-res.com
250
Aquat Microb Ecol 61: 249–260, 2010
requiring any explicit representation of the underlying complexity at the level of microeconomics or molecular motion. A drastically down-scaled version of the general ‘predictability of the ocean’s response to climate change’ question is to ask whether we can predict ecosystem responses to (more or less) controlled perturbation experiments. To reduce the subject further towards a well-defined question, consider the simple fact that abandoning the concept of a linear food chain automatically introduces the potential for alternative pathways for the limiting element(s), from the free mineral form, through the microbial food web, to mesozooplankton. The potential biogeochemical consequences are profound; one does not need a sophisticated analysis to predict that an entry of the mineral nutrients through prokaryotes with a subsequent release by viral lysis will have a very different effect on the photic zone C-cycle than an entry through large, fast-sinking diatoms, grazed by fecal pellet-producing copepods. With this in mind, a seemingly modest first ambition might be to develop an ability to predict which of the alternative nutrient pathways will dominate in a planned experiment. When experimenting with natural or near-natural ecosystems, reproducibility is not a trivial matter. System response does not depend only on the experimental perturbations applied, but also both on the initial conditions and, in the case of most outdoor experiments, on non-controlled environmental variables such as temperature and light histories throughout the experiment. A model may appear quite convincing when one can explain observed results in many mesocosm units starting from 1 initial water mass, but perturbed in different manners, using 1 model with 1 set of parameter values and an assumption of steady state prior to the perturbations (e.g. Thingstad et al. 2007). However, a single experiment of this type can only prove that the model reproduced the correct set of responses for one particular set of initial conditions and environmental drivers. The strategy of systematically repeating similarly designed mesocosm experiments is rarely applied, but has been used to compare results in a Baltic, a Mediterranean, and a Norwegian fjord environment: Olsen et al. (2006) found 2 orders of magnitude difference in autotrophic biomass between these experiments. A study in which a full 2-level, 3-factor (N-addition, P-addition, removal of mesozooplankton) 23 factorial design was repeated 10 times through the growing season in the Baltic demonstrated huge variations in the responses as the experiments were started from the seasonally changing initial conditions (Kivi et al. 1993). In the present study, we tried to approach the issue of between-experiment variability by reviewing
how added mineral nutrients passed through the microbial food web in a series of different experiments, ranging in scale from simple artificial food webs constructed in laboratory chemostats, via mesocosm experiments, to a Lagrangian in situ experiment.
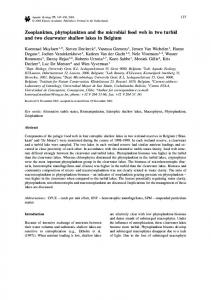
THE ‘MINIMUM’ MODEL A modest step up in complexity from a linear nutrients–phytoplankton–zooplankton model is the 3pathway model shown in Fig. 1A with (1) a ‘bacterial,’ (2) an ‘autotrophic flagellate’, and (3) a ‘diatom’ entry point for the mineral nutrients. Each of these osmotroph (those that feed on dissolved nutrients) plankton functional types (PFT) has its separate phagotroph (those that eat particles) predator, forming 3 parallel ‘vertical’ (in Fig. 1A) food chains. The phagotrophs
A
Heterotrophic flagellates
BDOC
Heterotrophic bacteria
Copepods phagotrophs
Ciliates
Autotrophic flagellates
Diatoms
2
1
Si osmotrophs
3
Free mineral nutrients
B Glucose-C
Bodo sp.
Pseudomonas putida
1 C
Private resource 1
Skeletonema sp.
PO4
Si
3
Predator or parasite
Defense specialist
Competition specialist
Private resource 2
Shared Resource
Fig. 1. Idealized models of the microbial part of the photic zone food web, (A) emphasizing the 3 pathways discussed for mineral nutrients through the microbial part of the pelagic food web — (1) heterotrophic bacteria, (2) autotrophic flagellates, and (3) diatoms, (B) as an experimental model system in the PROMARE experiment (Pengerud et al. 1987) and (C) as the generic ‘killing-the-winner’ principle allowing coexistence of a competition and a defense specialist (Thingstad & Lignell 1997). BDOC: bioavailable dissolved organic carbon
Thingstad & Cuevas: Microbial nutrient pathways
are again connected through the ‘horizontal’ carnivorous food chain from ‘heterotrophic flagellates’ via ‘ciliates’ to ‘copepods’. Similar to most other recent attempts to model the pelagic microbial food web, this construction can be considered an idealized version of Fenchel’s (1987) conceptual model, although it is modified here by arranging organisms according to feeding mode (osmo- and phagotrophy), rather than by auto- and heterotrophy. This particular 6-PFT version has been discussed and used in several contexts, both as a conceptual construction (Thingstad & Rassoulzadegan 1999, Thingstad et al. 2008) and in more rigorous mathematical forms (Thingstad et al. 2007). The 6-PFT model of Fig. 1A is a convenient basis for the present discussion, since our question can now be re-phrased in a relatively precise form: Which pathway (1, 2, or 3) will become dominant in a given experiment? Among the models of the pelagic microbial food web with clear resemblances to the structure in Fig. 1A is the conceptual model by Legendre & Rassoulzadegan (1995); they pointed out the continuum in systems from those dominated by what they termed a ‘herbivorous’ food web, corresponding to a dominance of Pathway 3 in Fig. 1A, via ‘microbial food webs’ (Pathway 2), to their ‘microbial loop’ (Pathway 1). Their discussions of how the balance between these shifts between different oceanic regions, and how systems dominated by either the microbial loop or the herbivorous pathways have a more temporary nature, certainly suggest that a fair amount of predictability may exist at this level of system resolution. Several aspects are missing in the food web structure of Fig. 1A. Obvious simplifications include: (1) the lack of any cross-linking between osmotroph and phagotroph groups, e.g. from autotrophic flagellates to copepods; (2) the lack of mixed feeding modes (e.g. mixotrophic protists; Havskum & Riemann 1996, Thingstad et al. 1996, Zubkov & Tarran 2008); and (3) the lack of an explicit representation of picoautotrophs. It is possible that these and other omissions result in an overly simplistic representation of the natural system. However, some support for the structure in Fig. 1A can be drawn from experiments. An interesting prediction of the simple 3-link food chain structure is that increasing copepod abundance should have the opposite effect on diatoms (decreasing) and autotrophic flagellates (increasing), caused by the intermediate link through ciliates between copepods and flagellates. Since this predicted effect has been experimentally confirmed in mesocosms (Stibor et al. 2004, Vadstein et al. 2004), the simplified structure of Fig. 1A seems to capture this essential aspect of the system. The steady states of a model as simple as this can, with some assumptions, be solved analytically (Thing-
251
stad 2000). For appropriate time scales, this allows a formalized discussion of how the balance between the pathways changes with factors such as: (1) total content of the common limiting element, (2) whether bacterial growth is limited by organic carbon or by mineral nutrients, (3) the availability of silicate, and (4) organism properties such as nutrient uptake affinities in osmotrophs, clearance rates in phagotrophs, and yield coefficients. Some general properties of the model’s response to nutrient perturbations are easily conceived from simple heuristic arguments. Consider an experiment starting with a system characterized by mineral nutrientlimited phytoplankton growth rate. When limiting nutrient(s) are added, this will alleviate growth rate limitations, lasting for a period depending on the ratio between existing osmotroph biomass and the dose supplied. As the nutrients are assimilated and converted into new osmotrophs, the system somewhat paradoxically shifts to increased growth rate limitation since the biomass of osmotroph competitors has increased, but not the rate of recycling. In this state, bacteria will therefore experience high competition pressure for mineral nutrients, driving the system towards mineral nutrient-limited bacterial growth. If mineral nutrient-stressed phytoplankton excretes organic C available to bacteria, this will drive the system further towards bacterial mineral nutrient limitation. With high osmotroph biomass, a trophic succession to the phagotrophs would be expected. The effect of this passing of matter up the ‘vertical’ food chains to the phagotrophs in Fig. 1A would be reduced competition as well as increased recycling, and therefore a reduced mineral nutrient stress for the remaining osmotrophs and an increased potential for bacterial consumption of bioavailable dissolved organic carbon (BDOC). The timing of these shifts in nutrient limitation thus depends on the characteristic time scales for the numerical response in the different phagotrophs. Since one would expect a faster numerical response in ciliates than in copepods, this model predicts a phytoplankton bloom in a system dominated by diatoms (Pathway 3) to last longer and reach higher levels than a flagellatedominated bloom (Pathway 2). From the arguments above, the consequence is also that the model predicts a prolonged period with mineral nutrient-limited bacterial growth when diatoms are present.
EXPERIMENTS The between-experiment variability in nutrient pathways through the microbial food web is illustrated by comparing the 5 different experiments summarized in Table 1. All experiments have ‘bottom-up’ manipu-
252
Aquat Microb Ecol 61: 249–260, 2010
Table 1. Experiments compared in this article. DIN: dissolved inorganic nitrogen Experiment
Type; location
Comment
Source
PROMARE
Chemostat; laboratory
Artificial food webs with different combinations of a diatom, a bacterium and a heterotrophic flagellate in a gradient of chemostats with increasing reservoir glucose, fixed phosphate concentration. Nitrate concentration in excess of biological demand
Pengerud et al. (1987)
MEDEA
Mesocosm; Danish fjord
Two glucose gradients, one without silicate addition, the other kept silicate replete. Daily addition of nitrate and phosphate (100 nM) in Redfield ratio to all units
Havskum et al. (2003), Thingstad et al. (2007)
PAME-I
Mesocosm; Ny Ålesund, Svalbard
Two glucose gradients, one without silicate addition, the other kept silicate replete. Daily addition of ammonium and phosphate (100 nM) in Redfield ratio to all units
Thingstad et al. (2008)
PAME-II
Mesocosm; Ny Ålesund, Svalbard
Two glucose gradients, both kept silicate replete, one with ammonium, the other with nitrate as DIN source. Daily additions of DIN and phosphate to all units
Marine Microbiology Research Group, University of Bergen (unpubl.)
CYCLOPS
Lagrangian; Cyprus Gyre, eastern Mediterranean
Pulse addition of phosphate (~120 nM)
Thingstad et al. (2005a)
lations in the form of mineral nutrients (inorganic N and P) in different combinations with silicate and easily degradable organic C (as glucose). The laboratory chemostat experiment (PROMARE) and the 3 mesocosm experiments (MEDEA, PAME-I, and PAME-II) were all constructed with the experimental units arranged along gradients in increasing supply of allochthonous organic C (as glucose). The chemostats (PROMARE) were fed continuously with a P-deficient (relative to N) medium, while the mesocosms were fed with daily doses of dissolved inorganic N and P (DIN and DIP) in Redfield ratio. The Lagrangian experiment (CYCLOPS) received a single pulse of phosphate only. All experiments except PAME-II have been published, and experimental detail can be found in the references given in Table 1. The unpublished experiment PAMEII was done in the same location as PAME-I. Note the differences in silicate additions and in the type of DIN source in the 3 mesocosm experiments (Table 1).
Fundamental mechanisms demonstrated in an artificial food web: the PROMARE chemostat experiment The principles behind the steady-state relationships are best illustrated in the PROMARE experiment, using artificially constructed combinations of the reduced 3-PFT food web model in Fig. 1B (Pengerud et al. 1987). When the chemostats contained only bacteria, increasing levels of reservoir glucose concentra-
tions gave steady states wherein bacterial abundance increased linearly with increasing glucose, up to the reservoir C:P ratio (glucose C:PO4 P ratio ~140 molar), where all free phosphate was consumed by the bacteria. Interestingly, this was followed by a region in reservoir C:P ratios (~140 to ~250) for which both glucose and phosphate were depleted (C,P co-limitation?), demonstrating the degree of flexibility in stoichiometric coupling of C and P consumption in the bacterium (Pseudomonas putida) used. Additional reservoir glucose beyond this ratio (C:P > ~ 250) was not consumed, but remained in the culture medium. Mixing the bacterial inoculum with a diatom (Skeletonema sp.), the diatom could establish only in the region with C-limited bacteria and partly into the middle co-limited region, but not in the purely P-limited (glucose replete) region. This is also in general agreement with expectations when using the traditional assumption that bacteria are superior mineral nutrient competitors. In the present context, the bacteria + heterotrophic flagellate + diatom combination is the most interesting. In this case, the community became dominated by the diatom while glucose consumption was reduced to very low levels. The interpretation within the model framework is that bacterial growth rate (μ) was restricted due to mineral nutrient competition with the diatoms, and bacterial biomass (B) was restricted by predation from heterotrophic flagellates. With these restrictions, bacterial phosphate consumption (~μB) was locked at a low level, and the remaining part of the supplied phosphate became available to the diatom population. The
Thingstad & Cuevas: Microbial nutrient pathways
result was thus diatom dominance, despite the inferior competitive ability of the diatom. In generic terminology (Fig. 1C), the stable co-existence of a ‘competition specialist’ (the bacterium) and a ‘defense specialist’ (the diatom in this system), was allowed by a mechanism (flagellate predation) that selectively killed the winner (the competition specialist; Thingstad & Lignell 1997). The model has 2 theoretical steady states with different mechanisms allowing stable coexistence of bacteria and phytoplankton: one in which their growth rates are limited by different substrates and one in which they are limited by the same shared substrate (phosphate in Fig. 1B). An important message from analyzing the model foodweb in Fig. 1B is that the pathway taken for nutrients (Pathways 1 or 3) does not depend solely on the relative competitive abilities of the bacterium and diatom used, but also strongly on the properties of the predator and the total amount of limiting nutrients available for sharing among the 3 groups. The balance among the 3 populations is thus an emergent property of the total system and cannot be understood from knowledge of isolated parts reduced to a level less than the 3 populations in Fig. 1C. Conceptual models of the generic type in Fig. 1C have been used to explain other experiments, such as the coexistence of resistant and sensitive bacterial host strains when viruses are present (Bohannan & Lenski 1997), the favoring of grazing-resistant forms of bacteria in mixed bacterial communities subject to protozoan grazing (Matz & Jürgens 2003), and the favoring of grazing-resistant phytoplankton when subject to metazoan grazing (McCauley & Briand 1979, Steiner 2003). Assuming that an increase in cell size is a means to avoid strong grazing pressure from small microzooplankton, the principle of ‘more nutrients result in more defense strategists’ can be used to explain the observations indicating that average cell size in phytoplankton is positively correlated with chlorophyll level in oceanic datasets (Irigoien et al. 2004). A non-steady state extension of the same principles is the ‘loophole’ concept (Irigoien et al. 2005), which suggests that blooms of phytoplankton reflect a temporary absence of an efficient predator.
The MEDEA experiment: diatom success due to slow predator response? All mesocosm units in the MEDEA mesocosm experiment (Havskum et al. 2003) received the same daily dose of phosphate (100 nM) and nitrate (in Redfield ratio). The units were arranged in 2 gradients, with daily additions of glucose increasing along the gradients. After about 3.5 d, the free silicate initially
253
present in the water was depleted, and silicate additions started in 1 gradient (+ Si) to keep these units silicate replete. This led to a bloom of large, chainforming diatoms in the + Si gradient, versus a flagellate + Mesodinium rubrum-dominated bloom in the other (–Si) gradient. Chlorophyll a (chl a) and estimated diatom C biomass levels reached much higher levels in the + Si gradient, indicating that the added nutrients in this case primarily entered the food web through the diatoms (Pathway 1) and were immobilized there over the time scale of the experiment (10 d). This was explained in the heuristic model analysis above as less efficient grazing on diatoms than on autotrophic flagellates in the –Si gradient. The diatom success was accompanied by a reduction in the system’s ability to consume glucose, also explained in the previous heuristic analysis as the consequence of immobilization of the limiting element(s) in diatom biomass (Thingstad et al. 2007). Without silicate (–Si gradient), the system’s ability for glucose consumption increased over time, which is explained in the same analysis as the consequence of a fast response in the flagellate–ciliate trophic link (Pathway 2). Despite the contrast between the complex near-natural food web in MEDEA and the highly simplified web in the PROMARE experiment, the success of the diatoms and their negative effect on bacterial consumption of glucose were features common to both experiments, explainable with the same basic principles (Fig. 1A,B). With this body of experimental evidence, a potentially robust prediction may be as follows: adding silicate will stimulate a diatom bloom, which, due to a slow response in the diatom–mesozooplankton food chain, will keep limiting elements immobilized at the diatom level for a prolonged period. This will drive bacteria to mineral nutrient limitation and thereby limit bacterial consumption of otherwise degradable organic C.
The PAME-I experiment: Does the structure of the diatom community matter? One strategy for exploring differences between 2 environments is to take an experimental setup you believe you understand in one environment and repeat it in the other. Following this strategy, the concepts and experience derived above from the PROMARE and MEDEA experiments were used to design a mesocosm experiment (PAME-I) in Kongsfjorden, Ny Ålesund, Svalbard, Norway, that was intended to improve our understanding of Arctic pelagic systems. The design strongly resembled that of the MEDEA experiment, but practical considerations necessitated
254
Aquat Microb Ecol 61: 249–260, 2010
modifications such as the use of robust plastic containers (Thingstad et al. 2008) rather than plastic bags and a choice of ammonium as the N source as opposed to nitrate used in the MEDEA experiment. As predicted, silicate addition in the absence of glucose again led to a diatom bloom that lasted longer and reached a higher level than the flagellate bloom in the –Si gradient. However, the response expected from the MEDEA experiment, in which silicate addition reduced bacterial activity, was not reproduced. Instead, glucose addition led to a strong proportional reduction of the diatom population. Because the dominating diatom (Thalassiosira sp.) apparently fixed organic C in a high C:N ratio, the paradoxical net effect of increasing the rate of addition of organic C to the system was a strong reduction in the accumulation rate of organic C in the system. Both responses can be qualitatively described within the framework of Fig. 1A, but the biogeochemical consequences expected from a ‘bacteriawin-over-diatoms’ situation, as in PAME-I, are profoundly different from those expected from a ‘diatoms-win-over-bacteria’ situation as in the MEDEA experiment. With our present level of understanding of this system, we suggest a possible reason for this difference in system response. The diatom community in the PAMEI experiment was totally dominated by small (10 µm increased faster during the first 5 d in the PeECE III mesocosm experiment, with a subsequent increase in the fraction between 5 and 10 µm after 10 d (Egge et al. 2009) immobilizing the limiting elements at the diatom level (Pathway 3). Particulate P and 33PO4 uptake indicated that phosphate was transferred to the >10 µm fraction during the same period (Tanaka et al. 2008). After this period, phosphate turnover decreased to values >1 h, and 33PO4 uptake increased in the fraction between 1 and 5 µm, suggesting a faster transport of the limiting element through the microbial food web pathway. The effect of copepods produces a similar response, resulting in a trophic cascade through ciliates to autotrophic flagellates (Vadstein et al. 2004), which indicates a faster numerical response through this pathway. In high latitude systems (e.g. Baltic Sea, Southern Ocean) the microbial food web or the herbivorous food web models seem to dominate depending on the addition of silicate and N sources (Table 3), following a similar result as our MEDEA, PAME-I, and PAME-II mesocosm experiments. Chl a increased rapidly after mineral nutrient additions with maximum abundances for autotrophic flagellates (Pyramimonas sp.) followed by a high proportion of heterotrophic nanoflagellates and ciliates (Andersson et al. 2006). In a separate experiment with 4 light regimes and the addition of silicate, phosphate, and ammonium, the autotrophic biomass was mainly represented by large diatoms (Thalassiosira antarctica), and bacteria and autotrophic flagellates were controlled by a high biomass and growth rates of heterotrophic flagellates and ciliates (Duarte et al. 2005).
CONCLUSION A main conclusion is that responses both in our 5 experiments and in many other mesocosm experiments may be explained qualitatively using the idealized food web models of Fig. 1. The role of this structure as a useful tool for qualitative, and in some cases quantitative (Thingstad et al. 2007), understanding and analysis of the lower part of the pelagic ecosystem is therefore supported. Understanding the properties of these ‘first-order’ models thus seems required to establish a foundation upon which more elaborate models can be built, potentially minimizing some of the ‘castles built on sand’ properties associated with more complex ecosystem models (e.g. Flynn 2005). However, comparing the 5 experiments and the occurrence of both unexpected and counterintuitive results, the ambition to reliably predict the pathway taken by nutrients in a given experiment is not fulfilled with these first-order models alone. Interestingly, the mechanisms suggested as additions necessary for explaining the observed variability in nutrient pathways are all related to flexible stoichiometry, to predator control, or to the interactions between the two: • The hypothesized difference in diatom storage capabilities for nitrate and ammonium was suggested to influence the size-structure of the diatom community, translating into an effect on the grazing control of the phytoplankton bloom and a subsequent effect on diatom–bacteria nutrient competition (PAME-I). • A carbon:nutrient ratio much larger than Redfield (molar C:P = 106) in the small diatom dominating the PAME-I experiment gave the counter-intuitive response of decreasing accumulation of organic C with increasing glucose addition. • The storage of reserve material in mineral nutrientlimited (organic C replete) bacteria was hypothesized to reduce the trade-off between nutrient competition and predator defense (MEDEA experiment). • The luxury consumption of phosphate leading to rapid change of the P:C ratio in osmotrophs was suggested to change the food quality for copepods, translating into a rapid response in egg production (CYCLOPS). • Differences in the initial predator food chain structure (loophole effect) were suggested as an important source of variation leading to different nutrient pathways (PAME II). Taken together, this produces a picture of a system wherein the interactions between flexibility in organism stoichiometry and predatory processes seem to be a central factor behind many of the unexpected and counterintuitive responses observed. This may thus seem a natural candidate mechanism to suggest for
Thingstad & Cuevas: Microbial nutrient pathways
259
terivorous, pigmented flagellates (mixotrophs) in the Bay inclusion in ‘second-order’ models aiming at increasof Aarhus, Denmark. Mar Ecol Prog Ser 137:251–263 ing explanatory power. Due to the uncertainties added Havskum H, Thingstad TF, Scharek R, Peters F and others ➤ by increasing the number of state variables and model (2003) Silicate and labile DOC interfere in structuring the parameters, however, it is not obvious whether this will microbial food web via algal–bacterial competition for improve the models’ general predictive power. mineral nutrients: results of a mesocosm experiment. Limnol Oceanogr 48:129–140 Acknowledgements. This work was supported by the Research Council of Norway through Project 186369 NUTRITUNNEL and the International Polar Year project 175939/S30 ‘PAME-Nor’ and from the European Research Council through the advanced researcher’s grant MINOS. Additional support for the PAME experiments was given by the Norwegian Polar Institute as ‘Arktisstipend.’ L.A.C. was also funded by the EU Marie Curie EST project METAOCEANS (MEST-CT-2005-019678).
➤ Hessen DO (1992) Nutrient element limitation of zooplankton
➤
➤ LITERATURE CITED
➤ Allers
➤ ➤
➤ ➤ ➤ ➤
➤
➤
➤
➤ ➤
➤
E, Gomez-Consarnau L, Pinhassi J, Gasol JM, 2imek K, Pernthaler J (2007) Response of Alteromonadaceae and Rhodobacteriaceae to glucose and phosphorus manipulation in marine mesocosms. Environ Microbiol 9:2417–2429 Andersson A, Samuelsson K, Haecky P, Albertsson J (2006) Changes in the pelagic microbial food web due to artificial eutrophication. Aquat Ecol 40:299–313 Bench SR, Hanson TE, Williamson KE, Ghosh D, Radosovich M, Wang K, Wommack KE (2007) Metagenomic characterization of Chesapeake Bay virioplankton. Appl Environ Microbiol 73:7629–7641 Bohannan BJM, Lenski RE (1997) Effect of resource enrichment on a chemostat community of bacteria and bacteriophage. Ecology 78:2303–2315 Dawes EA, Senior PJ (1973) The role and regulation of energy reserve polymers in micro-organisms. Adv Microb Physiol 10:135–266 DeLong EF (2009) The microbial ocean from genomes to biomes. Nature 459:200–206 Duarte CM, Agustí S, Gasol JM, Vaqué D, VazquezDominguez E (2000) Effect of nutrient supply on the biomass structure of planktonic communities: an experimental test on a Mediterranean coastal community. Mar Ecol Prog Ser 206:87–95 Duarte CM, Agustí S, Vaqué D, Agawin NSR, Felipe J, Casamayor EO, Gasol JM (2005) Experimental test of bacteria–phytoplankton coupling in the Southern Ocean. Limnol Oceanogr 50:1844–1854 Egge JK, Thingstad TF, Larsen A, Engel A, Wohlers J, Bellerby RGJ, Riebesell U (2009) Primary production during nutrient-induced blooms at elevated CO2 concentrations. Biogeosciences 6:877–885 Fenchel T (1982) Ecology of heterotrophic microflagellates. IV. Quantitative occurrence and importance as bacterial consumers. Mar Ecol Prog Ser 9:35–42 Fenchel T (1987) Ecology — potentials and limitations. In: Kinne O (ed) Excellence in ecology. Book 1. International Ecology Institute, Oldendorf/Luhe Flynn KJ (2005) Castles built on sand: dysfunctionality in plankton models and the inadequacy of dialogue between biologists and modellers. J Plankton Res 27:1205–1210 Galand PE, Casamayor EO, Kirchman DL, Lovejoy C (2009) Ecology of the rare microbial biosphere of the Arctic Ocean. Proc Natl Acad Sci USA 106:22427–22432 Havskum H, Riemann B (1996) Ecological importance of bac-
production. Am Nat 140:799–814 X, Huisman J, Harris RP (2004) Global biodiversity patterns of marine phytoplankton and zooplankton. Nature 429:863–867 Irigoien X, Flynn KJ, Harris RP (2005) Phytoplankton blooms: a ‘loophole’ in microzooplankton grazing impact? J Plankton Res 27:313–321 Keynes JM (1936) The general theory of employment, interest and money. Palgrave, MacMillan, Basingstoke Kivi K, Kaitala S, Kuosa H, Kuparinen J, Leskinen E, Lignell R, Marcussen B, Tamminen T (1993) Nutrient limitation and grazing control of the Baltic plankton community during annual succession. Limnol Oceanogr 38:893–905 Krom MD, Herut B, Mantoura RFC (2004) Nutrient budget for the eastern Mediterranean: implications for phosphorus limitation. Limnol Oceanogr 49:1582–1592 Krom MD, Thingstad TF, Brenner S, Carbo P and others (2005) Summary and overview of the CYCLOPS P addition Lagrangian experiment in the Eastern Mediterranean. Deep-Sea Res II 52:3090–3108 Kuuppo-Leinikki P, Autio R, Hallfors S, Kuosa H, Kuparinen J, Pajuniemi R (1994) Trophic interactions and carbon flow between picoplankton and protozoa in pelagic enclosures manipulated with nutrients and a top predator. Mar Ecol Prog Ser 107:89–102 Lebaron P, Servais P, Troussellier M, Courties C and others (2001) Microbial community dynamics in Mediterranean nutrient-enriched seawater mesocosms: changes in abundances, activity and composition. FEMS Microbiol Ecol 34:255–266 Legendre L, Rassoulzadegan F (1995) Plankton and nutrient dynamics in marine waters. Ophelia 41:153–172 Le Quere C, Harrison SP, Prentice IC, Buitenhuis ET and others (2005) Ecosystem dynamics based on plankton functional types for global ocean biogeochemistry models. Global Change Biol 11:2016–2040 Litchman E, Klausmeier CA, Yoshiyama K (2009) Contrasting size evolution in marine and freshwater diatoms. Proc Natl Acad Sci USA 106:2665–2670 Matz C, Jürgens K (2003) Interaction of nutrient limitation and protozoan grazing determines the phenotypic structure of a bacterial community. Microb Ecol 45:384–398 McCauley E, Briand F (1979) Zooplankton grazing and phytoplankton species richness. Limnol Oceanogr 24:243–252 Not F, del Campo J, Balague V, de Vargas C, Massana R (2009) New insights into the diversity of marine picoeukaryotes. PLoS ONE 4:e7143 Olsen Y, Agustí S, Andersen T, Duarte CM and others (2006) A comparative study of responses in planktonic food web structure and function in contrasting European coastal waters exposed to experimental nutrient addition. Limnol Oceanogr 51:488–503 Øvreås L, Bourne D, Sandaa RA, Casamayor EO and others (2003) Response of bacterial and viral communities to nutrient manipulations in seawater mesocosms. Aquat Microb Ecol 31:109–121 Pengerud B, Skjoldal EF, Thingstad TF (1987) The reciprocal interaction between degradation of glucose and ecosystem structure. Studies in mixed chemostat cultures of
➤ Irigoien
➤
➤
➤
➤ ➤
➤
➤
➤
➤
260
➤ ➤ ➤ ➤
➤ ➤
➤
➤
➤
➤
Aquat Microb Ecol 61: 249–260, 2010
marine bacteria, algae, and bacterivorous nanoflagellates. Mar Ecol Prog Ser 35:111–117 Rassoulzadegan F, Sheldon RW (1986) Predator–prey interactions of nanozooplankton and bacteria in an oligotrophic marine environment. Limnol Oceanogr 31:1010–1021 Sommer U (1985) Comparison between steady-state and nonsteady state competition: experiments with natural phytoplankton. Limnol Oceanogr 30:335–346 Steiner CF (2003) Keystone predator effects and grazer control of planktonic primary production. Oikos 101:569–577 Stibor H, Vadstein O, Diehl S, Gelzleichter A and others (2004) Copepods act as a switch between alternative trophic cascades in marine pelagic food webs. Ecol Lett 7:321–328 Stolte W, Riegman R (1995) Effect of phytoplankton cell size on transient-state nitrate and ammonium uptake kinetics. Microbiology 141:1221–1229 Tanaka T, Taniguchi A (1999) Predator–prey eddy in heterotrophic nanoflagellate–bacteria relationships in a bay on the northeastern Pacific coast of Japan. Mar Ecol Prog Ser 179:123–134 Tanaka T, Fujita N, Taniguchi A (1997) Predator–prey eddy in heterotrophic nanoflagellate–bacteria relationships in a coastal marine environment: a new scheme for predator– prey associations. Aquat Microb Ecol 13:249–256 Tanaka T, Thingstad TF, Lovdal T, Grossart HP and others (2008) Availability of phosphate for phytoplankton and bacteria and of glucose for bacteria at different pCO2 levels in a mesocosm study. Biogeosciences 5:669–678 Tanaka T, Thingstad TF, Gasol JM, Cardelus C, Jezbera J, Montserrat Sala M, 2imek K, Unrein F (2009) Determining the availability of phosphate and glucose for bacteria in Plimited mesocosms of NW Mediterranean surface waters. Aquat Microb Ecol 56:81–91 Thingstad T (2000) Control of bacterial growth in idealised food webs. In: Kirchman DL (ed) Microbial ecology of the ocean. John Wiley & Sons, New York, NY, p 229–259 Thingstad TF (2005) Simulating the response to phosphate additions in the oligotrophic eastern Mediterranean using an idealized four-member microbial food web model. Deep-Sea Res II 52:3074–3089 Submitted: March 19, 2010; Accepted: August 24, 2010
➤ Thingstad ➤
➤ ➤
➤
➤
➤ ➤
➤
➤
➤
TF, Lignell R (1997) Theoretical models for the control of bacterial growth rate, abundance, diversity and carbon demand. Aquat Microb Ecol 13:19–27 Thingstad T, Rassoulzadegan F (1999) Conceptual models for the biogeochemical role of the photic zone food web, with particular reference to the Mediterranean Sea. Prog Oceanogr 44:271–286 Thingstad TF, Havskum H, Garde K, Riemann B (1996) On the strategy of ‘eating your competitor’. A mathematical analysis of algal mixotrophy. Ecology 77:2108–2118 Thingstad TF, Krom MD, Mantoura RFC, Flaten GAF and others (2005a) Nature of phosphorus limitation in the ultraoligotrophic eastern Mediterranean. Science 309: 1068–1071 Thingstad TF, Øvreås L, Egge JK, Lovdal T, Heldal M (2005b) Use of non-limiting substrates to increase size; a generic strategy to simultaneously optimize uptake and minimize predation in pelagic osmotrophs? Ecol Lett 8:675–682 Thingstad TF, Havskum H, Zweifel UL, Berdalet E and others (2007) Ability of a ‘minimum’ microbial food web model to reproduce response patterns observed in mesocosms manipulated with N and P, glucose, and Si. J Mar Syst 64:15–34 Thingstad TF, Bellerby RGJ, Bratbak G, Borsheim KY and others (2008) Counterintuitive carbon-to-nutrient coupling in an Arctic pelagic ecosystem. Nature 455:387–390 Vadstein O, Stibor H, Lippert B, Loseth K, Roederer W, SundtHansen L, Olsen Y (2004) Moderate increase in the biomass of omnivorous copepods may ease grazing control of planktonic algae. Mar Ecol Prog Ser 270:199–207 Weisse T, Scheffel-Möser U (1991) Uncoupling the microbial loop: growth and grazing loss rates of bacteria and heterotrophic nanoflagellates in the North Atlantic. Mar Ecol Prog Ser 71:195–205 Zohary T, Herut B, Krom MD, Mantoura RFC and others (2005) P-limited bacteria but N and P co-limited phytoplankton in the Eastern Mediterranean — a microcosm experiment. Deep-Sea Res II 52:3011–3023 Zubkov MV, Tarran GA (2008) High bacterivory by the smallest phytoplankton in the North Atlantic Ocean. Nature 455:224–226 Proofs received from author(s): October 29, 2010