Catalogue no. 82-003-X ISSN 1209-1367
Health Reports
Nutritional risk, hospitalization and mortality among community-dwelling Canadians aged 65 or older
by Pamela L. Ramage-Morin, Heather Gilmour and Michelle Rotermann Release date: September 20, 2017
How to obtain more information For information about this product or the wide range of services and data available from Statistics Canada, visit our website, www.statcan.gc.ca. You can also contact us by email at
[email protected] telephone, from Monday to Friday, 8:30 a.m. to 4:30 p.m., at the following numbers: •• Statistical Information Service •• National telecommunications device for the hearing impaired •• Fax line
1-800-263-1136 1-800-363-7629 1-514-283-9350
Depository Services Program •• Inquiries line •• Fax line
1-800-635-7943 1-800-565-7757
Standards of service to the public Statistics Canada is committed to serving its clients in a prompt, reliable and courteous manner. To this end, Statistics Canada has developed standards of service that its employees observe. To obtain a copy of these service standards, please contact Statistics Canada toll-free at 1-800-263-1136. The service standards are also published on www.statcan.gc.ca under “Contact us” > “Standards of service to the public.”
Note of appreciation Canada owes the success of its statistical system to a long‑standing partnership between Statistics Canada, the citizens of Canada, its businesses, governments and other institutions. Accurate and timely statistical information could not be produced without their continued co‑operation and goodwill.
Published by authority of the Minister responsible for Statistics Canada © Minister of Industry, 2017 All rights reserved. Use of this publication is governed by the Statistics Canada Open Licence Agreement. An HTML version is also available. Cette publication est aussi disponible en français.
Statistics Canada, Catalogue no. 82-003-X • Health Reports, Vol. 28, no. 9, pp. 17-27, September 2017
Nutritional risk, hospitalization and mortality among community-dwelling Canadians aged 65 or older • Research Article
17
Nutritional risk, hospitalization and mortality among community-dwelling Canadians aged 65 or older by Pamela L. Ramage-Morin, Heather Gilmour and Michelle Rotermann Abstract:
Background: Nutritional risk has been associated with various negative health outcomes among older people. Limited longitudinal research has examined the relationship between nutritional risk and hospitalization and death in community-dwelling older people. Data and methods: Data from the 2008/2009 Canadian Community Health Survey–Healthy Aging (CCHS–HA) linked to the Discharge Abstract Database and the Canadian Mortality Database were used to estimate the prevalence of nutritional risk among seniors and examine its relationship with acute care hospitalization and death during the 25- to 36-month period following the CCHS–HA interview. Multivariate Cox proportional hazards models were used to identify important covariates, while adjusting for demographic and socioeconomic characteristics, health status, and lifestyle factors. Results: A third (34%; 979,000) of Canadians aged 65 or older living in 9 provinces (excluding Quebec) were at nutritional risk in 2008/2009. These seniors had a higher risk of an acute care hospitalization (hazard ratio (HR) 1.2; 95% CI: 1.1 to 1.4) or death (HR 1.6; 95% CI: 1.3 to 2.0) during the follow-up period, even when potential confounders were taken into account. Seniors at nutritional risk in 2008/2009 were more likely than those not at nutritional risk to die during follow-up (9% versus 5%) and averaged shorter survival times: 498 days (95% CI: 462 to 534) compared with 538 days (95% CI: 501 to 574). Interpretation: Based on an analysis of data from a large population-based survey linked to routinely collected hospital and death data, nutritional risk is independently associated with acute care hospitalization and mortality. Results highlight the importance of monitoring seniors for nutritional risk. Keywords: Data linkage, diet, eating, food intake, malnutrition, morbidity, nutrition assessment, seniors
A
dvancing age may bring diet-related challenges. Among seniors, chronic conditions and the medications used to treat them can interfere with appetite,1 the taste and enjoyment of food,2 and the absorption of nutrients.3,4 Impaired mobility and dexterity, declining health, and lack of transportation can be barriers to purchasing and preparing food.5 Poor oral health may also hinder eating.6 Some older people live in “food deserts” devoid of supermarkets and characterized by convenience stores and fast-food outlets with “empty calorie” choices.7,8 Changes in living arrangements due to the loss of a spouse can affect seniors’ diets through loneliness and the logistics of cooking for one. A paradox of aging is that caloric needs decrease, but the need for a nutritious diet does not.9 It is important to identify the people most likely to be at risk of nutritional depletion, who, without intervention, may become malnourished, frail, and susceptible to negative health outcomes including functional limitations, poor quality of life, longer hospital stays and readmissions, and earlier death.10-17 Nutritional risk increases at older ages.18 Thus, with Canada’s aging population, the prevalence of nutritional risk and the associated adverse health outcomes could become more common. Previous studies have investigated associations between nutritional risk and hospitalization19-21 and mortality,10,16,19,22-29 but the analyses were limited by small samples, lack of representativeness, or restricted subpopulations.
Recent linkages of Canadian population health surveys to hospital data and to mortality records offer an opportunity to study a more complete range of risk factors in association with acute care hospitalization and death than do administrative data sources alone. This analysis examines hospitalization and death in relation to nutritional risk status using a large, population-based sample of community-dwelling seniors aged 65 or older from the 2008/2009 Canadian Community Health Survey–Health Aging (CCHS–HA). Prospective hospitalization and death were monitored through linkage to the Discharge Abstract Database and the Canadian Mortality Database up to December 31, 2011 (a follow-up period of 25 to 36 months after the CCHS–HA interview). Multivariate analyses controlled for socioeconomic, physical health, and lifestyle characteristics.
Methods Canadian Community Health Survey—Healthy Aging (CCHS–HA) The cross-sectional 2008/2009 CCHS–HA collected information about factors, influences, and processes that contribute to healthy aging. The target population was people aged 45 or older living in private dwellings in the 10 provinces. The survey excluded residents of the three territories, First Nations reserves, certain remote regions, institutions, and Canadian Forces bases, and full-time members of the Canadian Forces. Together, these
Authors: Pamela L. Ramage-Morin (
[email protected]), Heather Gilmour and Michelle Rotermann are with the Health Analysis Division at Statistics Canada, Ottawa, Ontario, K1A 0T6.
18
Health Reports, Vol. 28, no. 9, pp. 17-27, September 2017 • Statistics Canada, Catalogue no. 82-003-X
Nutritional risk, hospitalization and mortality among community-dwelling Canadians aged 65 or older • Research Article
exclusions represented about 4% of the target population. CCHS–HA data were collected from December 2008 through November 2009. Computer-assisted personal interviews were conducted for 94% of the sample; telephone interviews were permitted to accommodate the language needs of respondents. If, because of physical or mental ill health, respondents were unable to complete the survey, another knowledgeable person was allowed to respond on their behalf. Those proxy respondents comprised 2.2% of the sample (n = 689). The overall response rate was 74.4%, for a final sample of 30,865 respondents. Detailed documentation for the CCHS–HA is available elsewhere.30
Discharge Abstract Database (DAD) The DAD is a census of hospital discharges from public hospitals in Canada (excluding Quebec), provided annually to Statistics Canada by the Canadian Institute for Health Information.31 The DAD contains demographic, administrative, and clinical data for about 3 million hospital discharges each year.32 Acute care hospital discharge records for fiscal years 2007/2008 through 2011/2012 were used for the linkage on which this analysis was based.
Canadian Mortality Database (CMDB) The CMDB is a census of all deaths registered in Canada. The provincial and territorial Vital Statistics Registries report deaths to Statistics Canada, providing information on cause coded according to the International Classification of Diseases (ICD–version 10), dates of birth and death, names, and postal code at the time of death. Deaths occurring from December 2008 through December 31, 2011 were linked to the CCHS–HA records.
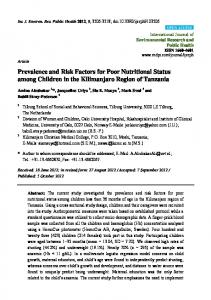
Study sample The study sample was established by linking records for CCHS–HA respondents aged 65 or older from
the provinces (except Quebec) who agreed to share and link their data with records from the DAD and the CMDB (Appendix Figure A). Proxy respondents and non-respondents to the nutritional risk questions were excluded. To establish a relatively healthy cohort at baseline, 801 respondents who had been hospitalized in an acute care facility and discharged in the year before the CCHS‑HA were excluded, resulting in a study sample of 9,878 (4,080 men and 5,798 women; average age 77).
Data linkage Probabilistic linkages were performed in accordance with the Directive on Record Linkage33 and approved by Statistics Canada’s Executive Management Committee.34 Statistics Canada ensures respondent privacy during the linkage and subsequent use of linked files. Only employees directly involved in the process have access to the unique identifying information required for linkage (such as names and health insurance numbers); they do not access health and/or deathrelated information. When a linkage is completed, an analytical file is created from which identifying information is removed. This de-identified file is accessed by researchers for analysis. Details about the linkages are available elsewhere.35,36 Internal and external validations were conducted on both the CCHS-DAD and CCHS-CMDB files to evaluate the accuracy of the linkage process. Evaluations confirmed that the linked files are suitable for analysis.35,36
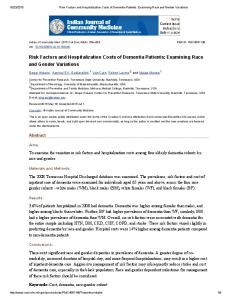
Definitions Nutritional risk was evaluated in the 2008/2009 CCHS–HA using Seniors in the Community Risk Evaluation for Eating and Nutrition II–Abbreviated (SCREEN II-AB), which has been validated for “cognitively intact community-living seniors” aged 55 or older.12,37 Nutritional risk questions pertain to weight change (gains and losses), nutrition intake, and dietary habits (Appendix Figure B). The
What is already known on this subject? ■■ About a third of community-dwelling Canadian seniors are at nutritional risk. ■■ Nutritional risk has been associated with poor health outcomes among seniors, but studies of community-living seniors have been limited by small samples, lack of representativeness, or restricted subpopulations.
What does this study add? ■■ Results of a large, population-based study show that compared with those at low nutritional risk, acute care hospitalization within 25 to 36 months of the survey interview was more likely among seniors at nutritional risk. ■■ As well, seniors at nutritional risk in 2008/2009 had a 60% increased risk of dying over a 25- to 36-month follow-up period, even when socio-demographic characteristics, health status, and health behaviours were taken into account.
SCREEN questions were modified to accommodate the change from self-administered to computer-assisted personal interviews. Values corresponding to the response categories for the 11 component variables were summed for a maximum score of 48; a score below 38 indicates nutritional risk.12 Demographic and socioeconomic variables were age, sex and main source of household income. Among the older, often retired, population, current income may not be a reliable indicator of socioeconomic status. To identify people of limited means, respondents were asked about their main source of income: wages and salaries; income from self-employment; dividends and interest (for example, from bonds or savings); Employment Insurance; Worker’s Compensation; Canada or Québec Pension Plan benefits; retirement pension, superannuation and annu-
Statistics Canada, Catalogue no. 82-003-X • Health Reports, Vol. 28, no. 9, pp. 17-27, September 2017
Nutritional risk, hospitalization and mortality among community-dwelling Canadians aged 65 or older • Research Article ities; Old Age Security and Guaranteed Income Supplement; Child Tax Benefit; provincial or municipal social assistance or welfare; child support; alimony; other (rental income or scholarships, for example); or none. Respondents who cited Old Age Security and Guaranteed Income Supplement or provincial/ municipal social assistance or welfare were grouped and compared with those relying on other income sources. Respondents’ self-perceived health was classified as good, very good or excellent versus fair or poor. Selfperceived health was chosen as a covariate because of its reliability and validity, and because it is strongly correlated with various aspects of health status including functional ability, chronic diseases, and psychological well-being.38 Current daily smokers were compared with all others (occasional smokers, former smokers, and those who never smoked). Body mass index (BMI = weight in kilograms/height in metres squared) categories were: underweight (less than 18.5), normal/overweight (18.5 to less than 30.0), and obese (30.0 or more). A correction was applied to BMI to reduce bias from self-reported weight and height.39 Acute care facilities were identified with the DAD variable: analytical_ inst_type_code = 1. Respondents with at least one admission between the date of their CCHS–HA interview and December 31, 2011 were considered to have had an acute care hospitalization. Deaths and dates of death were taken from the CMDB. Only CMDB deaths occurring on or before December 31, 2011 were included in the CCHS-CMDB source files.
Analytical techniques Cross-tabulations were used to estimate the percentage of the population at nutritional risk by sex and age group, and the percentage with at least one acute care hospitalization or who died in the prospective period, by nutritional risk status and other selected characteristics. Data
were examined graphically to check for interactions between nutritional risk and hospitalization or death by sex and age group (none were identified; data not shown). Parsimonious multivariate models were used to examine associations between nutritional risk (the exposure variable) and acute care hospitalization or mortality (Cox proportional hazards). Models controlled for sex, age, main source of household income, and health-related characteristics (self-perceived health, smoking status, and BMI). Selection of covariates was based on the literature and availability in the CCHS–HA. Although living alone may be a risk factor for hospitalization and/or death among seniors, it was not included as a covariate in this analysis because the nutritional risk assessment contains a question about the frequency of eating meals alone, which is highly correlated with living alone (Spearman’s rho 0.78). For both the hospitalization and mortality analyses, the study sample was followed from the date of the CCHS– HA interview to December 31, 2011. The length of the follow-up period, therefore, ranged from 25 to 36 months and was determined by when the respondent was interviewed. The proportional hazards assumption was tested by visual examination of SAS PROC LIFETEST plots for both outcomes. Analyses were performed on weighted data adjusted for agreement to link and share, using SAS Enterprise Guide 7.1. Sampling weights were used to account for the survey design and non-response, and to adjust for differences in agreement to link and share. The use of sampling weights is essential to account for unequal probabilities of selection and to reduce the potential for bias resulting from differing response, share, and agreement to link rates. Bootstrap weights were applied using SAS-Callable SUDAAN 11.0 to account for underestimation of standard errors due to the complex survey design.40 The significance level was set at p < 0.05.
19
Results Close to a million Almost a million (an estimated 979,000) Canadians aged 65 or older were at nutritional risk in 2008/2009. They made up a third (34%) of people in this age range (Table 1). Women were more likely than men to be at nutritional risk (37% versus 29%), as were those aged 75 or older compared with younger seniors (36% versus 32%). The average age of those at nutritional risk was 75 versus 74 for those not at risk (p ≤ 0.05; data not shown in table).
Hospitalization More than a quarter (26%) of seniors were hospitalized at least once during the follow-up period. Older seniors were more likely than those aged 65 to 75 to have been hospitalized: 35% compared with 19% (Table 2). Daily smokers and people who were underweight were more likely to have been hospitalized, while the opposite was true for people who rated their health as good, very good or excellent. Among seniors at nutritional risk in 2008/2009, 31% had an acute care hospitalization during the follow-up period, significantly higher than the 24%
Table 1
Number and percentage at nutritional risk, by sex and age group, household population aged 65 or older, Canada excluding territories and Quebec, 2008/2009 95% % of population confidence interval aged 65 or older from to
Sex and age group
Number '000
Total Sex Men Women† Age group 65 to 74† 75 or older
979
33.7
32.3 35.0
384 595
29.2* 37.4
27.3 31.2 35.5 39.3
514 465
31.7 36.2*
29.7 33.6 34.1 38.3
† reference category * significantly different from reference category (p < 0.05) Sources: 2008/2009 Canadian Community Health Survey–Healthy Aging share/link file; 2007/2008 to 2011/2012 Discharge Abstract Database.
20
Health Reports, Vol. 28, no. 9, pp. 17-27, September 2017 • Statistics Canada, Catalogue no. 82-003-X
Nutritional risk, hospitalization and mortality among community-dwelling Canadians aged 65 or older • Research Article
Table 2
Number and percentage with acute care hospitalization or death during 25- to 36-month follow-up, by selected characteristics, household population aged 65 or older, Canada excluding territories and Quebec, 2008/2009
Total Sex Men Women† Age group 65 to 74† 75 or older Main source of household income Social assistance or Old Age Security and Guaranteed Income Supplement Other† Self-perceived health Good, very good, excellent Fair, poor† Current daily smoker Yes No† BMI category Underweight Normal weight/Overweight† Obese Nutritional risk Yes No†
Acute care hospitalization 95% confidence Number interval
Death
Number
95% confidence interval
'000 760
% 26.1
from to 24.8 27.5
'000 195
% 6.7
from 6.1
to 7.4
358 402
27.2 25.2
25.2 29.3 23.5 27.1
105 90
7.9* 5.7
6.8 5.0
9.2 6.4
306 454
18.8 35.4*
17.1 20.6 33.3 37.6
49 146
3.0 11.4*
2.4 3.8 10.2 12.6
157 561
28.6 25.2
25.9 31.5 23.6 26.9
49 134
8.9* 6.0
7.3 10.9 5.4 6.8
514 246
22.6* 38.7
21.2 24.2 35.5 42.0
118 77
5.2* 12.1
4.5 5.9 10.4 14.0
71 689
31.6* 25.7
27.1 36.6 24.3 27.2
25 170
11.0* 6.3
8.3 14.4 5.7 7.0
17 537 194
39.1* 26.3 25.1
29.8 49.3 24.8 27.9 22.4 28.0
7E 143 41
15.5*E 7.0 5.3*
9.6 24.0 6.3 7.8 4.1 6.8
305 455
31.2* 23.6
28.8 33.6 21.9 25.3
92 103
9.4* 5.4
8.1 10.7 4.7 6.1
* significantly different from reference category (p < 0.05) † reference category E use with caution Sources: 2008/2009 Canadian Community Health Survey - Healthy Aging (CCHS-HA) share/link file; 2007/2008 to 2012/2013 Discharge Abstract Database; CCHS-HA linked Canadian Mortality Database.
of those not at nutritional risk who were hospitalized. Even when age, sex, major source of household income, health status, and health behaviours were taken into account, those at nutritional risk had significantly increased risk (1.2) of acute care hospitalization (Table 3).
Death An estimated 7% of the senior population died during the follow-up period (Table 2). Being male, older age, daily smoking, and underweight were associated with an increased risk of death; good, very good or excellent perceived health was protective. Those at nutritional risk in 2008/2009 were more likely than those not at risk to die, with respective estimates of 9% and
5%. When the confounding effects of socio-demographic characteristics, health status, and health behaviours were considered, the hazard ratio for all-cause mortality was significantly higher (1.6) for seniors at nutritional risk (Table 3). As well, those at nutritional risk had a shorter average survival time during the follow-up period than did those not at nutritional risk: 498 days (95% CI: 462 to 534) versus 538 days (95% CI: 501 to 574) (data not shown in table).
Discussion
For the first time, acute care hospitalization and death in Canada (excluding Quebec and the territories) have been prospectively estimated in relation to nutritional risk status using linked population-based survey and administrative
data. About a third of seniors living in the community were at nutritional risk in 2008/2009. A diet of inadequate quality or quantity can contribute to over- or underweight, decreased bone mass, immune dysfunction, cognitive impairment, functional limitations, anemia, and a lowered ability to rebound from illness or surgery.41,42 This study reinforces the association between nutritional risk and compromised health. Although the prevalence of nutritional risk differed by sex and age group, multivariate analyses confirmed associations with hospitalization and death; that is, regardless of sex, age and other potentially confounding factors, those at nutritional risk in 2008/2009 were significantly more likely to have been hospitalized or to have died during the 25- to 36-month follow-up period, compared with those not at nutritional risk. It is likely an iterative process whereby an inadequate diet can lead to chronic conditions, while existing conditions and associated treatments may impair nutritional well-being.9,18,43 Results of the relatively few studies that have examined nutritional risk and hospitalization among community-dwelling seniors are mixed: two studies found a significant association,19,20 but another did not.21 However, hospitalization is only one component of a health care system. Analyses of a broader range of services did not find significant associations between nutritional risk and physician visits or nursing home admissions, but relationships with home care and length of hospitalization did emerge.19-21,23 It is possible that associations between nutritional risk and hospitalization depend on the cause/reason for hospitalization and/or whether the hospitalization was planned (for example, for surgery) or unplanned (for example, due to a worsening health condition). The association between nutritional risk and mortality in the present analysis is consistent with several,10,16,21-25 but not all,21,26,44 previous studies. Differences in nutritional screening tools, follow-up periods, age ranges, covariates,
Statistics Canada, Catalogue no. 82-003-X • Health Reports, Vol. 28, no. 9, pp. 17-27, September 2017
Nutritional risk, hospitalization and mortality among community-dwelling Canadians aged 65 or older • Research Article
Limitations
Table 3
Adjusted hazard ratios relating acute care hospitalization and death during 25- to 36-month follow-up to selected characteristics, household population aged 65 or older, Canada excluding territories and Quebec, 2008/2009
Selected characteristics Sex Men Women† Age (continuous) Main source of household income Social assistance or Old Age Security and Guaranteed Income Supplement Other† Self-perceived health Good, very good, excellent Fair, poor† Current daily smoker Yes No† BMI category Underweight Normal weight/Overweight† Obese Nutritional risk Yes No†
Acute care hospitalization 95% confidence interval Hazard ratio
from
to
1.2* 1.0 1.06*
1.0 1.3 ... ... 1.05 1.07
Death 95% confidence interval Hazard ratio
from
to
1.7* 1.0 1.11*
1.3 2.1 ... ... 1.09 1.12
1.0 1.0
0.8 ...
1.1 ...
1.1 1.0
0.9 ...
1.5 ...
0.6* 1.0
0.5 ...
0.7 ...
0.6* 1.0
0.4 ...
0.7 ...
1.4 * 1.0
1.1 ...
1.7 ...
2.2* 1.0
1.5 ...
3.0 ...
1.4 1.0 1.0
1.0 ... 0.9
1.9 ... 1.2
1.8* 1.0 0.9
1.1 ... 0.7
3.1 ... 1.3
1.2* 1.0
1.1 ...
1.4 ...
1.6* 1.0
1.3 ...
2.0 ...
* significantly different from reference category (p < 0.05) † reference category ... not applicable Sources: 2008/2009 Canadian Community Health Survey–Healthy Aging (CCHS–HA) share/link file; 2007/2008 to 2012/2013 Discharge Abstract Database; CCHS-HA linked Canadian Mortality Database.
sample sizes, representativeness, and geographic locations make comparisons with other research difficult. Two studies10,16 that used a version of the SCREEN nutritional risk tool similar to that employed in this analysis also found significant associations with mortality. A recent systematic review13 concluded that nutritional screening tools were most predictive of mortality in acute or higher-level care settings, but less so for community-dwelling older people. Nonetheless, the present study shows that the SCREEN II–AB instrument captures associations between nutritional risk and hospitalization and mortality among community-dwelling seniors, which contribute to the predictive validity of this screening tool.
Future research could examine specific causes of hospitalization or death, and identify subgroups of older adults (for instance, immigrants, socially isolated seniors) among whom nutritional risk is most strongly associated with hospitalization and mortality. In addition, hospitalized individuals could be stratified by whether they were surgical or medical patients and/or whether the hospital days accumulated were because the patient was receiving active treatment, or whether some/all days were considered alternate level of care (ALC). ALC patients no longer require acute care, but may remain in acute care beds while waiting for placement in a long-term care facility.45
21
Results of this study are based on seniors living in the community and do not reflect nutritional risk or associations with hospitalization and death among residents of long-term care facilities. Proxy respondents did not complete the nutritional risk survey questions, and therefore, were excluded from the analysis. While this has the potential to introduce bias, so would inclusion of survey records completed on behalf of infirm individuals.46 An analysis of selected characteristics of the study population indicates that proxy respondents were more likely to be men, older, and in worse health than self-reporting respondents.47 However, proxy respondents comprised just 2.2% of the sample. CCHS–HA data are self-reported and not verified by any other source. The nutritional status of individuals was not measured in the CCHS–HA, and the SCREEN II–AB instrument does not distinguish between respondents at risk of becoming nutritionally depleted and those who are already undernourished. Additionally, nutritional risk was measured only once—at the time of the CCHS–HA interview―so it is not known if nutritional risk status changed during the follow-up period or how long it lasted. Some variables of potential relevance (for instance, medication use and history) were not available. CCHS–HA respondents from Quebec could not be included in the study, because the DAD does not contain data for that province. As well, if respondents who lived in other provinces were hospitalized in Quebec, their hospital stays were not captured in the DAD or in this study. Only acute care hospitalizations were examined; findings are not generalizable to other types of hospitalization such as day surgery and psychiatric services, or to health service use generally. In addition, after 2005, mental health hospitalizations in Ontario tended to be reported to a different administrative database: the Ontario Mental Health
22
Health Reports, Vol. 28, no. 9, pp. 17-27, September 2017 • Statistics Canada, Catalogue no. 82-003-X
Nutritional risk, hospitalization and mortality among community-dwelling Canadians aged 65 or older • Research Article
Reporting System.48 Therefore, acute care mental health hospitalizations are underrepresented in the linked data. Probabilistic linkage was used to match survey records to hospitalization and death information; the possibility of false links or missed links exists.
Conclusion
This analysis illustrates the value of linking administrative hospital and death data to large, nationally representative population health surveys. The results indicate that nutritional risk is independently associated with acute care hospitalization and mortality, and highlight the importance of monitoring
and treating seniors for nutritional risk in primary care settings in an effort to reduce hospitalizations and improve survival. Understanding the impact of nutritional risk on seniors’ health can inform programs aimed at reducing morbidity, and aid in planning for future needs for health care resources.
Acknowledgements
Statistics Canada thanks all participants for their input and advice during the development of the 2008/2009 CCHS–HA. The survey content was developed by the Health Statistics Division at Statistics Canada in consultation with Health Canada, the Public
Health Agency of Canada, and experts conducting the Canadian Longitudinal Study on Aging (CLSA), a major initiative of the Canadian Institutes of Health Research. Consultations included stakeholders from Human Resources and Social Development Canada and provincial and territorial health ministries. The addition of 5,000 respondents aged 45 to 54 was funded by the CLSA. Statistics Canada gratefully acknowledges Dr. Heather Keller for permission to use SCREEN II-AB and for her help in adapting the instrument for use in the CCHS–HA. ■
Statistics Canada, Catalogue no. 82-003-X • Health Reports, Vol. 28, no. 9, pp. 17-27, September 2017
Nutritional risk, hospitalization and mortality among community-dwelling Canadians aged 65 or older • Research Article
23
References 1.
Imoscopi A, Inelmen EM, Sergi G, et al. Taste loss in the elderly: Epidemiology, causes and consequences. Aging Clinical Experimental Research 2012; 24(6): 570-9.
2.
Toffanello ED, Inelmen EM, Imoscopi A, et al. Taste loss in hospitalized multimorbid elderly subjects. Clinical Interventions in Aging 2013; 8: 167-74.
3.
Zenuk C, Healey J, Donnelly J, et al. Thiamine deficiency in congestive heart failure patients receiving long-term furosemide therapy. Canadian Journal of Clinical Pharmacology 2003; 10: 184-8.
4.
Valuck RJ, Ruscin JM. A case-control study on adverse effects: H2 blocker or proton pump inhibitor use and risk of vitamin B12 deficiency in older adults. Journal of Clinical Epidemiology 2004; 57: 422-8
5.
Donini LM, Scardella P, Piombo L et al. Malnutrition in elderly: Social and economic determinants. The Journal of Nutrition, Health and Aging 2013; 17(1): 9-15.
6.
Furuta M, Yamashita Y. Oral health and swallowing problems. Current Physical Medical Rehabilitation Reports 0213; 1: 216-22.
7.
Coveney J, O’Dwyer LA. Effects of mobility and location on food access. Health and Place 2009; 15: 45-55.
8.
Walker RE, Keane CR, Burke JG. Disparities and access to healthy food in the United States: A review of food deserts literature. Health and Place 2010; 16: 876-84.
9.
Donini LM, Savina C, Cannella C. Eating habits and appetite control in the elderly: The anorexia of aging. International Psychogeriatrics 2003; 15(1): 73-87.
10. Keller HH, Ǿstbye T. Nutritional risk and time to death: Predictive validity of SCREEN©. The Journal of Nutrition, Health and Aging 2003; 7(2): 274-9. 11. Keller HH, Østbye T, Goy R. Nutritional risk predicts quality of life in elderly community-living Canadians. The Journals of Gerontology. Series A, Biological Sciences and Medical Sciences 2004; 59(1): 68-74.
14. Martinez-Reig M, Gomez-Arnedo L, Alfonso-Silguero AS, et al. Nutritional risk, nutritional status and incident disability in older adults. The FRADEA study. The Journal of Nutrition, Health and Aging 2014; 8(3):270-6. 15. Lengyel CO, Tate RB, Bayomi DJ. Nutritional risk in community-dwelling older men: The Manitoba follow-up study. Canadian Journal of Dietetic Practice and Research 2014; 75(2): 84-8. 16. Broeska VE, Lengyel CO, Tate RB. Nutritional risk and 5-year-mortality of older community-dwelling Canadian men: The Manitoba Follow-Up Study. Journal of Nutrition in Gerontology and Geriatrics 2013; 32(4): 317-29. 17. Hamirudin AH, Charlton K, Walton K. Outcomes related to nutrition screening in community living older adults: A systematic review. Archives of Gerontology and Geriatrics 2016; 62: 9-25. 18. Ramage-Morin PL, Garriguet D. Nutritional risk among older Canadians. Health Reports 2013; 24(3): 3-13. 19. Buys DR, Roth DL, Ritchie CS, et al. Nutritional risk and Body Mass Index predict hospitalization, nursing home admissions, and mortality in community-dwelling older adults: Results from the UAB Study of Aging with 8.5 years of follow-up. The Journals of Gerontology. Series A, Biological Sciences and Medical Sciences 2014; 69(9): 1146-53. 20. Yang Y, Brown CJ, Burgio KL, et al. Undernutrition at baseline and health services utilization and mortality over a 1-year period in older adults receiving Medicare home health services. Journal of the Medical Directors Association 2011; 12(4): 287-94. 21. Beck AM, Ovesen L, Osler M. The ‘Mini Nutritional Assessment’ (MNA) and the ‘Determine Your Nutritional Health’ Checklist (NSI Checklist) as predictors of morbidity and mortality in an elderly Danish population. British Journal of Nutrition 1999; 81(1): 31-6.
12. Keller HH, Goy R, Kane SL. Validity and reliability of SCREEN II (Seniors in the community: Risk evaluation for eating and nutrition, Version II). European Journal of Clinical Nutrition 2005; 59(10): 1149-57.
22. Lundin H, Sääl M, Strender L-E, et al. Mini nutritional assessment and 10-year mortality in free-living elderly women: A prospective cohort study with 10-year follow-up. European Journal of Clinical Nutrition 2012; 66: 1050-3.
13. Dent E, Visvanathan R, Piantodosi C, Chapman I. Nutritional screening tools as predictors of mortality, functional decline, and move to higher level care in older people: A systematic review. Journal of Nutrition in Gerontology and Geriatrics 2012; 31(2): 97-145.
23. Tsai AC, Yang SF, Wang JY. Validation of a population-specific mini-nutritional assessment with its long-term mortality-predicting ability: Results of a population-based longitudinal 4-year study in Taiwan. British Journal of Nutrition 2010; 104: 93-9.
24. Saletti A, Johansson I, Yifter-Lindgren E, et al. Nutritional status and a 3-year follow-up in elderly receiving support at home. Gerontology 2005; 51(3): 192-8. 25. Sahyoun NR, Jacques PF, Dallal GE, Russell RM. Nutrition Screening Initiative Checklist may be a better awareness/ educational tool than a screening one. Journal of the American Dietetic Association 1997; 97(7): 750-4. 26. Coe RM, Romeis JC, Miller DK, et al. Nutritional risk and survival in elderly veterans: A five-year follow-up. Journal of Community Health 1993; 18(6): 327-34. 27. Söderström L, Rosenblad A, Thors Adolfsson E, et al. Nutritional status predicts preterm death in older people: A prospective cohort study. Clinical Nutrition 2014; 33(2): 354-9. 28. Tevik K, Thürmer H, Husby MI, et al. Nutritional risk is associated with long term mortality in hospitalized patients with chronic heart failure. Clinical Nutrition ESPN 2016; 12: e20-9. 29. Charlton K, Nicols C, Bowden S, et al. Poor nutritional status of older subacute patients predicts clinical outcomes and mortality at 18 months of follow-up. European Journal of Clinical Nutrition 2012; 66(11): 1224-8. 30. Statistics Canada. Canadian Community Health Survey-Healthy Aging. Available at: http://www23.statcan.gc.ca/ imdb/p2SV.pl?Function=getSurvey &SDDS=5146&Item_Id=1724 31. Canadian Institute for Health Information. Discharge Abstract Database (DAD) Metadata. Available at: http://secure.cihi. ca/cihi-ext-portal/internet/en/document/ types+of+care/hospital+care/acute+care/ dad_metadata. 32. Canadian Institute for Health Information. Discharge Abstract Database (DAD) Re-abstraction Studies. Available at: https://secure.cihi.ca/estore/productSeries. htm?pc=PCC228. 33. Statistics Canada. Directive on Record Linkage. Available at: http://www. statcan.gc.ca/record-enregistrement/ policy4-1-politique4-1-eng.htm 34. Statistics Canada. Approved Record Linkages. Available at: http://www. statcan.gc.ca/record-enregistrement/ summ-somm-eng.htm 35. Sanmartin C, Decady Y, Trudeau R, et al. Linking the Canadian Community Health Survey and the Canadian Mortality Database: An enhanced data source for the study of mortality. Health Reports 2016; 27(12): 10-8.
24
Health Reports, Vol. 28, no. 9, pp. 17-27, September 2017 • Statistics Canada, Catalogue no. 82-003-X
Nutritional risk, hospitalization and mortality among community-dwelling Canadians aged 65 or older • Research Article
36. Statistics Canada. Summary Report of the Canadian Community Health Survey (CCHS) – Discharge Abstract Database (DAD) Record Linkage Study. Unpublished internal report. Available by request. 37. Phillips MS, Foley AL, Barnard R, et al. Nutritional screening in community-dwelling older adults: A systematic literature review. Asia Pacific Journal of Clinical Nutrition 2010; 19(3): 440-9. 38. Shields M, Shooshtari S. Determinants of self-perceived health. Health Reports 2001; 13(1): 35-51. 39. Shields M, Connor Gorber S, Janssen I, Tremblay MS. Bias in self-reported estimates of obesity in Canadian health surveys: An update on correction equations for adults. Health Reports 2011; 22(3): 1-11. 40. Rust KF, Rao JNK. Variance estimation for complex surveys using replication techniques. Statistical Methods in Medical Research 1996; 5(3): 283-310.
41. Ahmed T, Haboubi N. Assessment and management of nutrition in older people and its importance to health. Clinical Interventions in Aging 2010; 5: 207-16. 42. Leslie W, Hankey C. Aging, nutritional status and health. Healthcare 2015; 3: 648-58. 43. Hickson M. Malnutrition and ageing. Postgraduate Medical Journal 2006; 82:2-8. doi: 10.1136/pgmj.2005.037564 44. Boult C, Krinkle UB, Urdangarin CF, Skarin V. The validity of nutritional status as a marker for future disability and depressive symptoms among high-risk older adults. Journal of American Geriatrics Society 1999; 47(8): 995-9.
45. Canadian Institute for Health Information. Seniors and Alternate Level of Care: Building on Our Knowledge. Available at: https://secure.cihi.ca/free_products/ ALC_AIB_EN.pdf 46. Shields M. Proxy reporting of health information. Health Reports 2004; 15(3): 21-33. 47. Ramage-Morin PL. Hearing difficulties and feelings of social isolation among Canadians aged 45 or older Health Reports 2016; 27(11): 3-12. 48. Canadian Institute for Health Information. Mental Health and Addiction – Metadata. Accessed Aug 31, 2016. Available at: https://www.cihi.ca/en/ types-of-care/specialized-services/ mental-health-and-addictions
Statistics Canada, Catalogue no. 82-003-X • Health Reports, Vol. 28, no. 9, pp. 17-27, September 2017
Nutritional risk, hospitalization and mortality among community-dwelling Canadians aged 65 or older • Research Article
25
Appendix Figure A
Study sample and exclusion criteria
2008/2009 Canadian Community Health Survey–Healthy Aging (CCHS-HA) Age 45 or older, 10 provinces n = 30,865
CCHS-HA share link file 82.6% agreed to link and share n = 25,486 Exclude Quebec residents n = 4,558
n = 20,928 Exclude missing nutritional risk (proxy and non-response) n = 539 n = 20,389 Exclude ages 45 to 64 n = 9,710 n = 10,679 Link to Discharge Abstract Database (DAD) records December 2007 to December 2011
Exclude acute care hospitalizations a year or less before CCHS-HA interview n = 801
n=9,878
Link to Canadian Mortality Database (CMBD) records December 2007 to December 2011
Study sample, death analysis prospective death up to December 31, 2011 n = 9,878
records with CMDB link (death) n = 911
records with no CMBD link (no death) n = 8,967
Study sample, acute care hospitalization analysis prospective hospitalization up to December 31, 2011 n = 9,878 records with CCHS–DAD link (hospitalized at least once during follow-up) n = 2,985
records with no CCHS–DAD link (not hospitalized during follow-up) n = 6,893
26
Health Reports, Vol. 28, no. 9, pp. 17-27, September 2017 • Statistics Canada, Catalogue no. 82-003-X
Nutritional risk, hospitalization and mortality among community-dwelling Canadians aged 65 or older • Research Article
Figure B
Nutritional risk questions and response categories in Canadian Community Health Survey-Healthy Aging (CCHS-HA) and SCREEN II-AB Item number 1
CCHS-HA†
SCREEN II - AB
Question
Question
Response categories (points)
Response categories
1. Compared with 6 months ago, have you gained weight, lost weight or stayed about the same?
Has your weight changed in the past 6 months?
Stayed the same (8) Don't know (0) Gained weight (0) Lost weight (0)
2. How much weight did you lose/gain in the past 6 months?
Yes, I gained more than 10 pounds Yes, I gained 6 to 10 pounds Yes, I gained about 5 pounds No, my weight stayed within a few pounds Yes, I lost about 5 pounds Yes, I lost 6 to 10 pounds Yes, I lost more than 10 pounds I don’t know how much I weigh or if my weight has changed
More than 10 pounds/4.5 kilos (0) 6 to 10 pounds/2.7 to 4.5 kilos (2) About 5 pounds/2.3 kilos (4) Less than 5 pounds/2.3 kilos (8) 2
3
4
5
3. In general, how often do you skip meals?
Do you skip meals?
Almost every day (0) Often (2) Sometimes (4) Never or rarely (8)
Almost every day Often Sometimes Never or rarely
4. In general, how would you describe your appetite?
How would you describe your appetite?
Poor (0) Fair (4) Good (6) Very good (8)
Poor Fair Good Very good
5. In general, how often do you cough, choke or have pain when swallowing food or fluid?
Do you cough, choke or have pain when swallowing food or fluids?
Often or always (0) Sometimes (2) Rarely (6) Never (8)
Often or always Sometimes Rarely Never
6. In general, how many servings of fruits and vegetables do you eat in a day?
How many pieces or servings of fruit and vegetables do you eat in a day?
Less than two (0) Two (1) Three (2) Four (3) Five (4) Six (4) Seven or more (4) 6
Two Three Four Five or more
7. How much fluid do you drink in a day?
How much fluid do you drink in a day?
Less than two cups (0) About two cups (1) Three to four cups (2) Five to seven cups (3) Eight or more cups (4)
Less than two cups About two cups Three to four cups Five to seven cups Eight or more cups
Statistics Canada, Catalogue no. 82-003-X • Health Reports, Vol. 28, no. 9, pp. 17-27, September 2017
Nutritional risk, hospitalization and mortality among community-dwelling Canadians aged 65 or older • Research Article
27
Figure B
Nutritional risk questions and response categories in Canadian Community Health Survey-Healthy Aging (CCHS-HA) and SCREEN II-AB (continued) Item number 7
8
CCHS-HA†
SCREEN II - AB
Question
Question
Response categories (points)
Response categories
8. How often do you eat at least one meal each day with someone?
Do you eat one or more meals a day with someone?
Never or rarely (0) Sometimes (2) Often (3) Almost always (4)
Never or rarely Sometimes Often Almost always
9. Do you usually cook your own meals?
Who usually prepares your meals?
No
Someone else cooks most of my meals I share my cooking with someone else I do
Yes 10. Which of the following statements best describes meal preparation for you? I usually find cooking a chore (0) I sometimes find cooking a chore (2) I enjoy cooking most of my meals (4)
11. Which of the following statements best describes the meals prepared for you? I'm not satisfied with the quality of the food prepared by others (0) I'm satisfied with the quality of the food prepared by others (4)
Which statement best describes meal preparation for you? I usually find cooking a chore I sometimes find cooking a chore I enjoy cooking most of my meals Which statement best describes meal preparation for you? I’m not satisfied with the quality of the food prepared by others I’m satisfied with the quality of the food prepared by others
Based on the Seniors in the Community Risk Evaluation for Eating and Nutrition I I – Abbreviated (SCREEN I I-AB) developed by Dr. Heather Keller of the University of Waterloo, Ontario and adapted, with permission, for computer-assisted interviewing in the CCHS-HA. †