Object-Centric Debugging Preprint version to be published at ICSE 2012
Jorge Ressia Software Composition Group University of Bern Switzerland
Alexandre Bergel PLEIAD Lab Department of Computer Science (DCC) University of Chile
Oscar Nierstrasz Software Composition Group University of Bern Switzerland
scg.unibe.ch
pleiad.dcc.uchile.cl
scg.unibe.ch
Abstract—During the process of developing and maintaining a complex software system, developers pose detailed questions about the runtime behavior of the system. Source code views offer strictly limited insights, so developers often turn to tools like debuggers to inspect and interact with the running system. Unfortunately, traditional debuggers focus on the runtime stack as the key abstraction to support debugging operations, though the questions developers pose often have more to do with objects and their interactions. We propose object-centric debugging as an alternative approach to interacting with a running software system. We show how, by focusing on objects as the key abstraction, natural debugging operations can be defined to answer developer questions related to runtime behavior. We present a running prototype of an object-centric debugger, and demonstrate, with the help of a series of examples, how object-centric debugging offers more effective support for many typical developer tasks than a traditional stack-oriented debugger.
I. I NTRODUCTION Debugging is formally the process of finding and reducing the number or defects in a computer program, thus making it behave as expected. More broadly, however, debugging is the process of interacting with a running software system to test and understand its current behavior. Software developers frequently turn to debuggers to obtain insight into parts of a running system before attempting to change it, rather than to remove defects. Similarly, in test-driven development [1], debuggers are frequently used as a development tool to identify those parts of the system that need to be implemented next. Traditional debuggers are focused on the execution stack. The developer identifies parts of the source code of interest and sets breakpoints accordingly. The software then runs until a breakpoint is reached, and the developer can then inspect and interact with the code and entities in the scope of the breakpoint. Unfortunately this process is ill-matched to typical development tasks. First of all, breakpoints are set purely with respect to static abstractions, rather than to specific objects of the running system. As a consequence, identifying the right place to set breakpoints in the source code requires a deep understanding of what happens during
the execution. Second, debugging operations are focused on the execution stack, rather than on the objects. There exists therefore a considerable conceptual gap between the interface offered by the debugger and the questions of interest by the developer. Sillito et al. [2] identified 44 kinds of questions that programmers ask themselves when they perform a change task on a code base. A typical such question which is particularly relevant here is: Where is this variable or data structure being accessed? Developers take two approaches to answer this question. The first approach is to follow the control flow and use the step over and step into stackbased operations. Manual step-wise execution works well when the code space to explore is relatively small, but may be impractical otherwise. The second approach is to place breakpoints in all potential places where the variable might be accessed. Again, this can work well for a small code space, but can quickly become impractical if a variable is potentially accessed from many methods. Some debuggers allow the developer to insert breakpoints on accesses to instance variables. However, when such a breakpoint is applied to a particular class all instances of the class are affected. If the developer needs to follow a specific object’s instance variable access, then he needs to proceed through breakpoint executions until the right object is found. Even with a small number of instances this process is error prone and not straightforward. These approaches are inherently static since they start from the static source code. Neither approach directly answers the question Where is this variable or data structure being accessed? for a specific object. There is consequently a gap between the kinds of questions developers ask about the running software system and the support offered by traditional debuggers to answer these questions. Object-centric debugging attempts to close the gap between developers’ questions and the debugging tool by shifting the focus in the debugger from the execution stack to individual objects. The essence of object-centric debugging is to let the user perform operations directly on the objects involved in a computation, instead of performing operations
on the execution stack. A fundamental difference between conventional and object-centric debugging is that the latter is specified on an already running program. Instead of setting breakpoints that refer to source code, one sets breakpoints with reference to a particular object. The contributions of the present paper are: • A new technique called object-centric debugging which provides a set of operations targeted to objects than to the execution stack. • Examples illustrating the advantages of object-centric debugging over traditional stack-based debugging. • A prototype implementation of an object-centric debugger. Outline: The remainder of this paper is structured as follows: Section II explains and motivated the need for object-centric debugging. Section III presents the objectcentric approach with its operations. In Section IV we demonstrate how our approach solves the challenges of object-centric debugging with various case studies. Section V presents our infrastructure to implement objectcentric debuggers. Section VI analyzes how object-centric debugging can be implemented in other languages. In Section VII we discuss the state of the art of debugging. Section VIII summarizes the paper and discusses future work.
Where are instances of this class created? (Q.14) Where is this variable or data structure being accessed? (Q.15) • What are the values of the argument at runtime? (Q.19) • What data is being modified in this code? (Q.20) • How are these types or objects related? (Q.22) • How can data be passed to (or accessed at) this point in the code? (Q.28) • What parts of this data structure are accessed in this code? (Q.33) Sillito et al. note: “In several sessions, the debugger was used to help answer questions of relevancy. Participants set breakpoints in candidate locations (without necessarily first looking closely at the code).” In the context of a running object-oriented system these questions express that programmers need to deal with specific objects at runtime. Consider, for example, questions 13 and 14. Simply by placing a breakpoint in the method concerned (Q.13), or in the constructor(s) of the class being instantiated (Q.14), and running either the program or its test suite one can quickly obtain answers to these questions and then explore the execution stack to obtain detailed information about the calling context. This procedure works fine when trying to understand the general behavior of objects. However, when introducing polymorphism and delegation the behavior of objects of the same class changes depending on their composition. These cases require an object-specific analysis and simple breakpoint are not the best option. Conditional breakpoints are heavily used in real world application development when programmers need to interrupt the execution of the application when a particular expression is evaluated to true. First the programmer needs to find the specific object he is interested in. Then the programmer has to specify a suitable condition to identify the specific object already found, rather than directly interacting with it. This approach may be feasible if there exist only few objects to analyze. If, however, there are many instances of many classes, setting conditional breakpoints may be tedious and error prone. The situation is much the same with many of the other questions. • •
II. M OTIVATION During software development and evolution, programmers typically need answers to various questions about how the software behaves at runtime. Although various dynamic analysis tools exist, the programmers’ first mainstream tool choice to explore the state of a running program is the debugger. The classical debugger requires the programmer to set breakpoints in the source code before debugging is enabled, and then offers the programmer operations to explore the execution stack. Unfortunately the debugger is not designed to answered many of the questions that programmers typically pose, making it difficult, if not impossible for the programmer to set meaningful breakpoints. In this section we explore these questions, and establish three challenges that a debugger should meet to better support software evolution tasks, namely: (i) intercepting access to object-specific runtime state; (ii) monitoring objectspecific interactions; and (iii) supporting live interaction. These challenges lead us to propose object-centric debugging to meet these challenges.
B. Getting to the Objects Both traditional stack-centric and object-centric debuggers share a common operational process. Developers use debuggers to understand the runtime behavior of a system. In the runtime the developer deals with objects instead of with their static representation in the source code. Stack-centric and object-centric debugging diverge when the developer finds a particular object that is not behaving as expected. In a traditional stack-centric debugger the developer leaves the debugger and turns to the static representation of the system to place regular or conditional breakpoints to steer the execution around a particular object. In an object-centric
A. Questions Programmers Ask Sillito et al. [2] identified 44 kinds of questions that programmers ask when they perform a change task on a code base. Several of these questions involve understanding the program execution: • When during the execution is this method called? (Q.13) 2
debugger the developer does not need to leave the debugger but applies object-centric operations directly on the object of interest. In both cases we need to get to the objects that are relevant for the debugging case. However, once the relevant objects have been detected, the steering method is completely different. Object-centric debugging allows the developer to continue interacting with the runtime, applying operations directly on the objects, instead of working with the static representation of the system.
setting suitable breakpoints may be an overwhelming task, and running the debugger may yield false positives. D. Monitoring Object-specific Interactions Let us reconsider question 13: When during the execution is this method called? If the programmer is only interested in knowing when the method is called for a specific object (or caller), then a conditional breakpoint may be set, i.e., which will only cause the debugger to start if the associated condition is met. This, however, assumes that the object can be statically identified, since the breakpoint is set in the source code view, not at runtime. Furthermore, if the source code of the object in question is not accessible, the programmer will be forced to set breakpoints at the call sites. Question 22 poses further difficulties for the debugging approach: How are these types or objects related? In statically typed languages this question can be partially answered by finding all the references to a particular type in another type. Due to polymorphism, however, this may still yield many false positives. (An instance variable of type Object could be potentially bound to instances of any type we are interested in.) Only by examining the runtime behavior can we learn precisely which types are instantiated and bound to which variables. The debugging approach would, however, require heavy use of conditional breakpoints (to filter out types that are not of interest), and might again entail the setting of breakpoints in a large number of call sites.
C. Intercepting Object-specific State Access Questions 15, 19, 20, 28 and 33 all have to do with tracking state at runtime. Consider in particular question 15: Where is this variable or data structure being accessed? Let us assume that we want to know where an instance variable of an object is being modified. This is known as keeping track of side-effects [3]. One approach is to use step-wise operations until we reach the modification. However, this can be time-consuming and unreliable. Another approach is to place breakpoints in all assignments related to the instance variable in question. Finding all these assignments might be troublesome depending on the size of the use case, as witnessed by our own experience. During the development of a reflective tool we faced the situation that an unexpected side effect occurred. The bytecode interpreter of the host language1 is modeled by the class InstructionStream. This class defines an instance variable called pc (i.e., program counter) which models where the execution is in the instruction stream. The class MethodContext is a subclass of ContextPart, itself a subclass of InstructionStream. During our development, we encountered an unexpected increase of the variable pc in an instance of MethodContext. Tracking down the source of this side effect is highly challenging: 31 of the 38 methods defined on InstructionStream access the variable, comprising 12 assignments; the instance variable is written 9 times in InstructionStream’s subclasses. In addition, the variable pc has an accessor that is referenced by 5 intensively-used classes. Without a deep understanding of the interpreter, it is difficult to track down the source of the error with simple debugging strategy. Some debuggers provide instance variable related breakpoints. However, these breakpoints are not object-specific thus requiring the introduction of conditional breakpoints to interrupt execution only in the right context. Questions 19, 20, 28 and 33 can also be difficult to answer through classical debugging. The typical approach in each case is to statically identify possible call sites that may access or modify the data in question, insert breakpoints, and then invoke the debugger. For complex programs (which are the only programs that are really of interest), finding and
E. Supporting Live Interaction Back-in-time debugging [4], [5] can potentially be used to answer many of these questions, since it works by maintaining a complete execution history of a program run. There are two critical drawbacks, however, which limit the practical application of back-in-time debugging. First, the approach is inherently post mortem. One cannot debug a running system, but only the history of completed run. Interaction is therefore strictly limited, and extensive exploration may require many runs to be performed. Second, the approach entails considerable overhead both in terms of runtime performance and in terms of memory requirements to build and explore the history. Although conventional debugging is more interactive, it also requires much advance preparation in terms of exploring the static source code to set breakpoints of potential interest. As a consequence, also conventional debuggers fall short in supporting live, interactive debugging. F. Towards Object-Centric Debugging If we reexamine the set of questions identified by Sillito et al. that relate to running software, we can see that they essentially cover all possible combinations of: “From where and what is this object’s state accessed?” and “How does this object interact with other objects?” In other words,
1 http://www.pharo-project.org/
3
the focus of programmers’ questions appears to be not the execution stack but rather the objects in the running system. We therefore hypothesize that an object-centric debugger — i.e., a debugger that allows one to set breakpoints on access to individual objects, to its methods and to its state — might better support programmers in answering typical development questions. In particular an objectcentric debugger would (i) intercept object-specific state access without needing one to set breakpoints in call sites or state. (ii) monitor interactions with individual objects without requiring conditional breakpoints; and (iii) support lightweight, live interaction with a running system without requiring breakpoints in source code.
Halt on read. The execution is halted when an object’s instance variable is used. We can scope this operation to any instance variable or to a specific one. C. Interaction operations There are six object-centric debugging operations that deal with object interactions. Halt on call. When any of an object’s methods is called from any other object, execution should be halted. This operation can be applied to one or several objects and can be scoped to apply to a single method or to several ones. Halt on invoke. When an object invokes any method, execution should be halted. This operation can be applied to one or several objects and can be scoped to apply to one or several method declarations. Halt on creation. Execution is halted when an instance of a certain class is created. Halt on object in invoke. Execution is halted when an object’s method is invoked and a particular object is present in the invocation parameters. This operation can be applied to all methods an object can answer or to a subset of them. Halt on object in call. When a particular object is used as a parameter of a method call the execution should be halted. This operation can be applied to all called methods or to a subset of them. Halt on interaction. Every time two particular object interact by invoking a method between each other the execution is halted.
III. O BJECT-C ENTRIC D EBUGGING A. Object-Centric Debugging in a Nutshell Conventional debugging allows one to interrupt and interact with a running program by specifying breakpoints in the execution flow of the program. Object-centric debugging, by contrast, interrupts execution when a given object is accessed or modified. Whereas conventional debugging requires breakpoints to be set at locations corresponding to points in the source code, object-centric debugging intercepts interactions that do not necessarily correspond to fixed points in the source code. As we saw in the previous section, of the questions that programmers pose about software, the most problematic ones are those dealing with how and where the state of an object is accessed, and how an object interacts with other objects. Object-centric debugging therefore introduces mechanisms to intercept execution on precisely those interactions. A fundamental difference between conventional and object-centric debugging is that the latter is specified on an already running program. Instead of setting breakpoints that refer to source code, one sets breakpoints with reference to a particular object. This means that object-centric debugging operations can only be applied to a running program which has already been interrupted, possibly with the help of a conventional breakpoint. Clearly this implies that object-centric debugging is intended to augment conventional debugging, not to replace it. Let us see which object-centric debugging operations are supported.
IV. E XAMPLES : ADDRESSING DEBUGGING CHALLENGES In this section we demonstrate how object-centric debugging fulfills the three key debugging challenges we identified (Section II): (i) intercepting object-specific state access without requiring breakpoints in call sites or on state; (ii) monitoring interactions with individual objects without requiring conditional breakpoints; and (iii) supporting lightweight, live interaction with a running system without requiring breakpoints in source code. We present three case studies and compare how stack-based debuggers are used against the advantages of using an object-centric debugger. A. Example: Tracking object-specific side-effects The motivating problem presented in Section II is an example of tracking the cause and location of a side effect. Pharo provides a bytecode interpreter modeled by the class InstructionStream. This class defines an instance variable called pc which models the current location of execution in the instruction stream. The class MethodContext is a subclass of ContextPart, itself a subclass of InstructionStream. During our development, we encountered an unexpected increase of the variable pc hold in an instance of MethodContext. Identifying the circumstance in which a side-effect occurs is known
B. State-related operations There are two object-centric debugging operations that intercept accesses to object state. Halt on write. When an instance variable of an object is changed the execution should be halted. We can scope this operation to any instance variable of the object or to a particular one. 4
to be difficult [6], [7]. Debuggers are often employed to understand the cause of execution effect [2]. With a conventional debugger, it takes 18 step in operations to reach the first modification of the pc instance variable, and over 30 operations to reach the next one. Setting breakpoints in all possible call sites that might access pc does not offer any improvement: 31 of the 38 methods defined on InstructionStream access the variable, comprising 12 assignments; the instance variable is written 9 times in InstructionStream’s subclasses. In addition, the instance variable pc has an accessor that is referenced by 5 intensively used classes. Object-centric debugging solves this problem trivially: by applying the halt on write debugging operation on the MethodContext instance, the source of the problem is quickly identified. Since this operation can be scoped to a specific instance variable, we can specify that execution should halt only on a write of the pc instance variable.
object-centric debugging we flow through the execution and see only the points that are relevant to us. With stack-centric debugging we see the whole execution and we need to steer the execution by manually introducing breakpoints. This case study illustrates how object-centric debugging intercepts object-specific state access without needing breakpoints to be set at call sites or on state. B. Example: Individual Object Interaction Modifications to compilers can introduce subtle bugs that are very hard to understand and track down. The compilation process of Pharo Smalltalk transforms source code to bytecode. In a first phase the source code is parsed and transformed to an Abstract Syntax Tree (AST) which, afterwards, is processed by the bytecode generator. It can be cumbersome and extremely complicated to debug during the compilation process. ASTs are traversed using the visitor pattern [8]. The tree is analyzed several times for different purposes, like semantic analysis, closure analysis and early optimizations. This data is used by the BytecodeGenerator to produce the bytecode representation. At bytecode level variables are accessed through indices. In a compiled method, variables might have different indices depending on the context in which they are being used. For example, a variable can have index 3 in the outer scope of the method, but index 2 in an inner scope. Instances of LexicalScope model the different scopes in a particular method, mapping each variable to its index in that scope. A common bug we have encountered when modifying the compiler is to produce variables with the wrong accessing index in the bytecode, thus leading to unpredictable behavior. To debug this situation, we need to be able to track a single AST node, intercept all the messages it receives. This should enable us to see why the LexicalScope instances indexed are incorrect. Analyzing the visitor patterns in a stack-based debugger is sometimes difficult due to the number of methods being sent back and forth between the objects and the visitor. Moreover, we are interested in analyzing the indexing of a single variable. To be able to follow a single AST node we need to place breakpoints in all potential methods in which the node might be called, including inherited methods. Instances of the class ASTVariableNode understand up to 523 methods, rendering this approach impractical. Moreover, in a class-based system like Pharo Smalltalk, placing a breakpoint in a particular method affects all instances of ASTVariableNode. Conditional breakpoints could be used, however, we need to manually deal with the identity of the object and still introduce them in all the methods that may be possibly invoked (523 methods). Object-centric debugging offers a high-level operation called halt on call. This operation allows method calls on a particular object to be intercepted. Using this operation we are able to follow a particular instance of
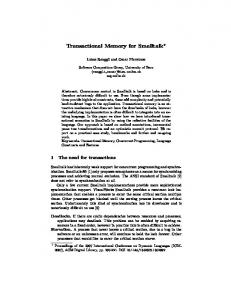
stack-centric debugging
step into, step over, resume
InstructionStream class>>on: InstructionStream class>>new InstructionStream>>initialize CompiledMethod>>initialPC InstructionStream>>method:pc: InstructionStream>>nextInstruction MessageCatcher class>>new InstructionStream>>interpretNextInstructionFor: ... object-centric debugging
centered on the InstructionStream class next message, next change
on: new
centered on the InstructionStream object initialize next message, method:pc: next change nextInstruction
...
interpretNextInstructionFor:
...
Figure 1.
Evolution from stack-centric to object-centric debugging.
We can observe in Figure 1 how object-centric debugging differs from conventional debugging. In the upper part of Figure 1 we observe a traditional stack-centric debugger which is manipulated using step-wise operations. In the lower part of Figure 1 we observe two different objectcentric debugging scopes for the same example. In one case we apply the halt on call and halt on write to the InstructionStream class object, thus we get the debugger to take into account messages to the class that perform these operations. In the other case we apply the same two operations to an instance of the class InstructionStream . The debugger takes into account the method calls and the instance variables changes happening in this particular object. The results of object-centric debugging are more concise and directly related to the developer’s needs. With 5
ASTVariableNode and detect why a LexicalScope in the
will be interrupted. No conditional breakpoints have to be manually defined. We also avoid dealing with object identity, and we avoid relying on the static representation of the objects. With this case study we show how object-centric debugging can support lightweight, live interaction with a running system without requiring breakpoints in source code.
compilation process was producing an erroneous index. We can obtain the problematic instance of ASTVariableNode by inspecting the AST tree. In this case, the method name was being used by a particular visitor in charge of the indexing. The indices in an instance of LexicalScope were wrongly calculated due to a string problem in the name of the variable. With this case study we show how object-centric debugging can monitor interactions with individual objects without requiring conditional breakpoints.
V. I MPLEMENTATION There were two main implementation requirements for object-centric debugging. First, the execution of high-level debugging operations should not break other development tools such as code browsers and versioning tools. Second, we need to instrument the application to insert object-specific breakpoints at locations of interest. Because of this, we need to rely on the meta-programming facilities of the host language. These facilities are not always uniform and require ad hoc code to hook in behavior. To avoid this drawback we decided to use a framework that provides uniform metaprogramming abstractions. The prototype of object-centric debugging is built on top of the Bifr¨ost reflection framework [10]. Bifr¨ost offers finegrained unanticipated dynamic structural and behavioral reflection through meta-objects. Instead of providing reflective capabilities as an external mechanism we integrate them deeply into the environment. Explicit meta-objects allow us to provide a range of reflective features and thereby evolve both application models and the host language at run-time. Meta-objects provide a sound basis for building different coexisting meta-level architectures by bringing traditional object-oriented techniques to the meta-level. In recent years researchers have worked on the idea of applying traditional object-oriented techniques to the metalevel while attempting to solve various practical problems motivated by applications [11]. These approaches, however, offer specialized solutions arising from the perspective of particular use cases. The Bifr¨ost model solves the main problems of previous approaches while providing the main reflection requirements. • Partial Reflection. Bifr¨ ost allows meta-objects to be bound to any object in the system thus reflecting selected parts of an application. • Selective Reification. When and where a particular reification should be reified is managed by the different meta-objects. • Unanticipated Changes. At any point in time a metaobject may be bound to any object thus supporting unanticipated changes. • Meta-level Composition. Composable meta-objects provide the mean for bringing together different adaptations. • Runtime Integration. Bifr¨ ost’s reflective model lives entirely in the language model, so there is no VM
C. Example: Live Object Interaction Mondrian [9] is an open and agile visualization engine. Mondrian models visualizations as graphs, i.e., in terms of nodes and edges modeled by classes MONode and MOEdge. Generally, Mondrian visualizations are composed of hundreds to thousands of nodes and edges. The rendering involves a complex interaction between the various entities. When a particular node is not being rendered correctly, it can be very difficult to debug. The rendering of Mondrian entities is performed by a Shape object. Each node passes itself as a parameter to a Shape object that specifies the rendering (double dispatch). In the case of an abnormal rendering for a particular node, traditional debuggers promote the insertion of a breakpoint in the rendering method. However, the execution will be halted each time Mondrian renders a node. This is clearly impractical for large graphs. Conditional breakpoints might help in this situation. To achieve this the object being tracked somehow has to be globally accessible. In languages like Java, C, C# and Smalltalk, conditional breakpoints have to be defined separately and we cannot build conditions depending on a manually selected dynamic value. The debugger has no operations to insert at runtime conditional breakpoints that are object specific. This means that objects that are not active in the current state can only be accessed with the help of globals. Object-centric debugging offers a high-level operation called halt on object in call. We apply this operation to the Shape object performing the rendering and we specify the MONode instance that we want to analyze. We obtain the Shape object by invoking a method on the Mondrian easel which models the plane in which nodes and edges are rendered. We can inspect a Mondrian graph visualization by clicking on each node and obtaining the object it represents. In this case the abnormally-rendered node is not being rendered with the correct size. We select that object from the visualization and thus obtain the MONode instance. We assume that any object constructed at runtime can be reflectively accessed and used by object-centric debugging operations. Every time that the node is passed as parameter of a method call by the particular Shape object, execution 6
modification or low level adaptation required. From an implementation point of view, object-centric debugging requires a mechanism for runtime method redefinition. Object-specific behavior can be built on top of this mechanism. The prototype of object-centric debugging2 and the examples presented in this paper are implemented in Pharo Smalltalk3 , an open-source Smalltalk [12] implementation.
the object that received the message haltOnNextMessage . The instrumentation behavior in lines 4–7 will only be executed when the object bound to the meta-object receives a message. In this case since we are not defining any particular message name, the instrumentation will be executed when any message is received by the adapted object. To instrument an object for a particular message name, the message when: anEvent in: aMessageName do: aBlock should be used instead. There is already an object-centric debugging operation defined in Object which does exactly that: haltOnCall: aMessage subjectTo: aBlock. In the next snippet of code we can observe the halt on write operation definition.
A. Debugging Operation Definition Each debugging operation is defined as a method in the Object class. Due to this, these operations can be executed
on any object of the system. In the next snippet of code we can observe the halt on call operation definition. (Readers unfamiliar with the syntax of Smalltalk might want to read the code examples aloud and interpret them as normal sentences: An invocation to a method named method:with:, using two arguments looks like: receiver method: arg1 with: arg2. Other syntactic elements of Smalltalk are: the dot to separate statements: statement1. statement2, and square brackets to denote code blocks or anonymous functions: [ statements ].) 1 2 3 4 5 6 7 8
1 2 3 4 5 6 7 8
Listing 2. Pharo Smalltalk implementation of Halt on write object-centric operation
As we can see the definition is almost identical to Listing 1 but with a different meta-event. The class StateWriteEvent models the event when an object’s instance variable is changed. This particular example instruments an object to trigger a halt when any instance variable is changed. For specifying a particular instance variable the object-centric operation haltOnWriteFor: aVariableName of the class Object should be used instead.
haltOnCall | aMetaObject | aMetaObject := BehavioralMetaObject new. aMetaObject when: ( MessageReceiveEvent new ) do: [ self metaObject unbindFrom: self. TransparentBreakpoint signal ]. aMetaObject bindTo: self Listing 1. Pharo Smalltalk implementation of Halt on call object-centric operation.
In line 3 a behavioral meta-object is instantiated. In Smalltalk objects interact by sending messages to each other. A method invocation is therefore called a message send, and an object’s method is called when a message is received. Behavioral meta-objects work by perceiving the execution of the system as a set of events like: message send, received message, state read, state write, object creation, etc. We use this meta-object to instrument a particular object behavior when it receives a message. The message when:do: defines that when a particular event is happening to an object then we want a particular behavior to be executed. The class MessageReceiveEvent models the event when an object receives a message. The second argument is a block with the instrumentation behavior. This instrumentation is divided in two steps. First, in line 6 the instrumentation is removed from the object by unbinding it from the metaobject. Second, in line 7, a TransparentBreakpoint, an exception used as a breakpoint by the Smalltalk environment, is signaled thus triggering the debugger. In line 8 the meta-object that defines the adaptation is bound to
haltOnWrite | aMetaObject | aMetaObject := BehavioralMetaObject new. aMetaObject when: ( StateWriteEvent new ) do: [ self metaObject unbindFrom: self. TransparentBreakpoint signal ]. aMetaObject bindTo: self
B. Extending Operations Bifr¨ost meta-objects provide facilities to manage the extension to which the adaptation should be applied. When a particular event is triggered the instrumentation block can reify various abstractions which will only be known at runtime. 1 2 3
aMetaObject when: ( MessageReceiveEvent new ) do: [:receiver :selector :arguments | ... ].
In line 3 we can observe that the receiver, selector and arguments of the message received will be available as arguments of the block. The developer can use these arguments for evaluating conditions at runtime and define new and more specific object-centric debugging operations. C. User Interface Modifications To facilitate the use of object-centric debugging features the Pharo debugger and inspector were modified. The debugger was enhanced with direct buttons for halt on call and halt on write. We added menu items to the inspector with direct access to the object-centric operations. From the
2 http://scg.unibe.ch/research/bifrost/ocd/ 3 http://www.pharo-project.org/
7
debugger, a developer may thus inspect any object in the current context, and from the inspector apply object-centric operations to objects of interest. A key requirement of our implementation is not to break the existing toolchain. Smalltalk is a class-based language, so code browsers show the method definitions for each class. Object-specific modifications of the code are not well-suited to these browsers, so object-centric debugging operations are only available in the debugger and inspector.
debugger. This section revises the available approaches for that purpose outside Pharo Smalltalk. Iguana [14] offers selective reification making it possible to select program elements down to individual expressions. It also allows dynamic changes to be applied in an objectspecific manner. Iguana is developed for C++ and works by placing annotations in the source code to define behavioral reflective actions. Java is a class-based object-oriented language with good support for introspection but poor support for intercession. However, several tools and techniques have been developed to overcome this limitation. Iguana/J [15], [16] is the implementation of Iguana for Java. Iguana/J enables unanticipated changes to Java applications at run-time without requiring instrumentation or restarting the application for the changes to be available. Object-specific adaptation behavior is built into the VM modifications provided by this tool. Partial Behavioral Reflection was introduced by Tanter et al. [17]. This model is implemented in Reflex for the Java environment. The key advantage is that it provides a means to selectively trigger reflection, only when specific, predefined events of interest occur. Object-specific behavior can be introduced at runtime with conditional instructions in the adapted behavior. Developers can define object-centric debugging operations and offer them through the Java Debugging Interface (JDI). It is then up to the IDE, i.e., Eclipse, IntelliJ IDEA or NetBeans, to provide a user interface for object-centric actions in the debuggers. Aspect-Oriented Programming (AOP) [18] modularizes cross-cutting concerns. Join points define all locations in a program that can possibly trigger the execution of additional cross-cutting code (advice). Pointcuts define at runtime whether an advice is executed. AOP features have been introduced in various languages thus making objectcentric debugging feasible in these languages. Recently, new advances in AOP, like AspectWerkz [19] and EAOP [20], provide dynamic aspects that can be defined at runtime for specific objects. Object-centric operations can be then modeled by advice containing a breakpoint. Recently, Moret et al. introduced Polymorphic Bytecode Instrumentation (PBI) [21], a technique that allows dynamic dispatch amongst several, possibly independent instrumentations. These instrumentations are saved and indexed by a version identifier. These versions can control the visibility of the adaptations to specific objects. This technique is an excellent candidate to implement OCD with low overhead in a conventional programming language like Java. Self [22] is a prototype-based language which follows the concepts introduced by Lieberman [23]. In Self there is no notion of class; each object conceptually defines its own format, methods, and inheritance relations. Objects are derived from other objects by cloning and modification.
D. Performance Instrumentation always impacts the performance of the application being modified. We have performed a microbenchmark to assess the maximal performance impact of our Smalltalk prototype of object-centric debugging. We assume that the behavior required to fulfill the profiling requirements is constant to any instrumentation strategy. All benchmarks were performed on an Apple MacBook Pro, 2.8 GHz Intel Core i7 in Pharo 1.1.1 with the jitted Cog VM. Consider a benchmark in which a test method is being invoked one million times from within a loop. We measure the execution time of the benchmark with Bifr¨ost reifying all 106 method activations of the test method. This shows that in the reflective case the code runs about 35 times slower than in the non-reflective case. However, for a realworld application with only few reifications the performance impact is significantly lower. Bifr¨ost’s meta-objects provide a way of adapting selected objects thus allowing reflection to be applied within a fine-grained scope only. This provides a natural way of controlling the performance impact of reflective changes. Let us consider the Mondrian profiling problem presented by Bergel et al. [13]. The main source of performance degradation is from the execution of the method displayOn:, i.e., whenever a node is redisplayed. We developed a benchmark where the user interaction is simulated to prevent human interaction from polluting the measurements. In this benchmark we redraw one thousand times the nodes in the Mondrian visualization. This implies that the method displayOn: is called extensively. The results showed that the profiler-oriented instrumentation produces on average a 20% performance impact. The user of this Mondrian visualization can hardly detect the delay in the drawing process. Note that our implementation has not been aggressively optimized. Another important detail of our implementation is that instrumentations are removed once they have interrupted the execution. The impact on performance is consequently temporal and local to specific objects of the application. VI. F EASIBILITY OF O BJECT- CENTRIC D EBUGGING IN OTHER LANGUAGES
Dynamically modifying the behavior of individual objects is an essential ingredient for implementing an object-centric 8
Modifications can be applied to a specific object at runtime. Ruby [24] introduced mixins as a building block of reusability, called modules. Modules can be applied to specific objects without modifying other instances of the class adding or modifying state and methods. Object-centric operations can be modeled as modules for modifying the behavior of a particular method of an object introducing breakpoints.
way than TOD. Information about objects that are eligible for garbage collection is discarded. Performance is also significantly better than in TOD because this approach is implemented at the virtual machine level, whereas all previously mentioned approaches are based on bytecode instrumentation. This approach stores historical data directly in the application memory, so does not require any additional logging facility to gather and store data. In query-based debugging the user defines a query in a higher-level language that is then applied to the logged data [30], [31], [32], [33]. Queries can test complex object interrelationships and sequences of related events. Some back-in-time debuggers instead of saving the execution data replay the program until a desired point in the past. The main advantage of replay-based approaches over logging-based approaches is their low performance overhead. Debuggers like Bdb [34] and Igor [35] take periodic state snapshots to optimize the time required to reach a particular point in the past. A drawback of replay-based approaches is that deterministic replay cannot be guaranteed depending on the behavior of program. Omniscient debugging looks backwards to analyze the static history of a debugged program. Object-centric debugging looks forward to analyze the relationships between objects. Object-centric debugging avoids these scalability issues by using a runtime object-specific operations. Objectcentric debugging can answer the same questions as Omniscient debugging without the scalability issues. The Whyline is a debugging tool that allows programmers to ask “Why did” and “Why did not” questions about their program’s output Whyline [36] tries to aid the developer by applying static and dynamic analyses and then answer some of the developer’s questions. OCD brings the debugging actions closer to the developer’s mental model of the domain in terms of objects. They are therefore two different approaches.
VII. R ELATED W ORK In recent years researchers have worked on enhancing debuggers to address the questions the developers ask themselves. In this section we review research related to objectcentric debugging. Breakpoint generation: Most development environments offer convenient breakpoint facilities, however the use of these environments usually requires considerable effort to set useful breakpoints. Determining the location to insert a breakpoint entails programmer knowledge and expertise. Breakpoint generation has been proposed to reduce the effort required to select the location to insert breakpoints [25] by identifying the execution path commonly taken by failed tests. This approach uses dynamic fault localization techniques to identify suspicious program statements and states, through which both conditional and unconditional breakpoints are generated. Dynamic languages: The popularity of dynamic web content produced a number of debugging techniques for dynamic languages and web pages. Web page breakpoints [26] are conditional breakpoints dedicated to the web domain. For example, this approach proposes operations like “Break on attribute change” and “Break on element removal”. The authors added domain-specific breakpoints capabilities to a general-purpose debugger for Javascript allowing the developer to initiate the debugging process via web page abstractions rather than lower level source code views. Omniscient debugging: Omniscient debugging [27], [4], [28] is also known as back-in-time debugging or reversible debugging. These debuggers record the whole history, or execution trace, of a debugged program. Developers can explore the history by simulating step-by-step execution both forward and backward. However, omniscient debugging has scalability issues due to the large number of traces to manage and the challenge of quickly responding to queries on these. To overcome these issues Pothier et al. [5] proposed a trace oriented debugger (TOD) in the context of Java. TOD is composed of an efficient instrumentation for event generation, a specialized database for scalable storage, and support for partial traces to reduce trace volume. While this approach has the benefit that no data is lost, its drawback is that it requires extensive hardware power, which is not available for many developers today. Lienhard et al. [29] presented a practical approach to back-in-time debugging using partial traces in a different
VIII. C ONCLUSION In this paper we have presented a new debugging approach called object-centric debugging. By focusing on objects, natural debugging operations are defined to answer developer questions related to runtime behavior. Objectcentric operations directly act on objects by intercepting access to runtime state; monitoring how objects interact; and supporting live interaction. We demonstrated that the results of object-centric debugging are more concise and directly related to the developer’s needs. With object-centric debugging we flow through the execution and see only the points that are relevant to us. In contrast, with traditional stack-centric debuggers we see the whole execution and we need to steer the execution by manually introducing breakpoints. Conventional debugging better handles scenarios where the assumptions are general to all the instances of a class, 9
and closer to the source code. OCD handles situation where the developer questions are closer to the objects which model the domain. Once you have an assumption about an object then you would like to follow that object and avoid dealing with traditional breakpoint management, i.e., if in Mondrian you have 1000 nodes and you need to follow a single one, this is better handled by OCD. We have presented a fully working prototype of an objectcentric debugger and shown how this debugger is used to solve three non-trivial realistic examples. The Smalltalk prototype implementation has shown the feasibility of this approach. The impact on performance due to instrumentation is not perceived by the user. Since the history of the execution is not saved both performance and memory consumption are not as important as in omniscient debugging approach. We have discussed how other mainstream languages can provide object-centric debugging thus demonstrating that this approach is not limited to a single language. So far we have only taken a traditional debugger and enhanced it with object-centric capabilities. Despite the new object-centric operations, it inherently limits the users to a stack-frame introspection. Although the debugger operates on the inter-object interactions, the runtime is still presented in terms of stack-frames. Our future work includes a dedicated user interface for our object-centric debugger. The user should navigate through a web of interacting objects instead of being constrained by the stack frame presentation.
[4] B. Lewis, “Debugging backwards in time,” in Proceedings of the Fifth International Workshop on Automated Debugging (AADEBUG’03), Oct. 2003. [Online]. Available: http: //arxiv.org/abs/cs/0310016v1 [5] G. Pothier, E. Tanter, and J. Piquer, “Scalable omniscient debugging,” Proceedings of the 22nd Annual SCM SIGPLAN Conference on Object-Oriented Programming Systems, Languages and Applications (OOPSLA’07), vol. 42, no. 10, pp. 535–552, 2007. [6] J. P. Banning, “An efficient way to find the side effects of procedure calls and the aliases of variables,” in Proceedings of the 6th ACM SIGACT-SIGPLAN symposium on principles of programming languages (POPL’79). New York, NY, USA: ACM, 1979, pp. 29–41. [7] J. J. Dolado, M. Harman, M. C. Otero, and L. Hu, “An empirical investigation of the influence of a type of side effects on program comprehension,” IEEE Transactions on Software Engineering, vol. 29, no. 7, pp. 665–670, 2003. [8] E. Gamma, R. Helm, R. Johnson, and J. Vlissides, Design Patterns: Elements of Reusable Object-Oriented Software. Reading, Mass.: Addison Wesley Professional, 1995. [9] M. Meyer, T. Gˆırba, and M. Lungu, “Mondrian: An agile visualization framework,” in ACM Symposium on Software Visualization (SoftVis’06). New York, NY, USA: ACM Press, 2006, pp. 135–144. [Online]. Available: http://scg.unibe.ch/archive/papers/Meye06aMondrian.pdf [10] J. Ressia, L. Renggli, T. Gˆırba, and O. Nierstrasz, “Run-time evolution through explicit meta-objects,” in Proceedings of the 5th Workshop on
[email protected] at the ACM/IEEE 13th International Conference on Model Driven Engineering Languages and Systems (MODELS 2010), Oct. 2010, pp. 37–48, http://sunsite.informatik.rwth-aachen.de/Publications/CEURWS/Vol-641/. [Online]. Available: http://scg.unibe.ch/ archive/papers/Ress10a-RuntimeEvolution.pdf
ACKNOWLEDGMENTS We thank St´ephane Ducasse, Fabrizio Perin, Lukas Renggli and the anonymous reviewers for their feedback on drafts of this paper. We gratefully acknowledge the financial support of the Swiss National Science Foundation for the project “Synchronizing Models and Code” (SNF Project No. 200020-131827, Oct. 2010 – Sept. 2012). We also thank CHOOSE, the special interest group for Object-Oriented Systems and Environments of the Swiss Informatics Society, for its financial contribution to the presentation of this paper. This work has been partially funded by Program U-INICIA 11/06 VID 2011, grant U -INICIA 11/06, University of Chile, and FONDECYT project 1120094. We thank ESUG (esug.org), the European Smalltalk User Group, for its financial support.
[11] J. McAffer, “Engineering the meta level,” in Proceedings of the 1st International Conference on Metalevel Architectures and Reflection (Reflection 96), G. Kiczales, Ed., San Francisco, USA, Apr. 1996. [12] A. Goldberg and D. Robson, Smalltalk 80: the Language and its Implementation. Reading, Mass.: Addison Wesley, May 1983. [Online]. Available: http://stephane.ducasse.free. fr/FreeBooks/BlueBook/Bluebook.pdf
R EFERENCES [1] K. Beck, Test Driven Development: By Example. Wesley Longman, 2002.
[13] A. Bergel, O. Nierstrasz, L. Renggli, and J. Ressia, “Domain-specific profiling,” in Proceedings of the 49th International Conference on Objects, Models, Components and Patterns (TOOLS’11), ser. LNCS, vol. 6705. SpringerVerlag, Jun. 2011, pp. 68–82. [Online]. Available: http: //scg.unibe.ch/archive/papers/Berg11b-Profiling.pdf
Addison-
[2] J. Sillito, G. C. Murphy, and K. De Volder, “Questions programmers ask during software evolution tasks,” in Proceedings of the 14th ACM SIGSOFT international symposium on Foundations of software engineering, ser. SIGSOFT ’06/FSE14. New York, NY, USA: ACM, 2006, pp. 23–34.
[14] B. Gowing and V. Cahill, “Meta-object protocols for C++: The Iguana approach,” AAA, Tech. Rep., 1996.
[3] K. Maruyama and M. Terada, “Debugging with reverse watchpoint,” in Proceedings of the Third International Conference on Quality Software (QSIC’03). Washington, DC, USA: IEEE Computer Society, 2003, p. 116.
[15] B. Redmond and V. Cahill, “Supporting unanticipated dynamic adaptation of application behaviour,” in Proceedings of European Conference on Object-Oriented Programming, vol. 2374. Springer-Verlag, 2002, pp. 205–230.
10
[16] ——, “Iguana/J: Towards a dynamic and efficient reflective architecture for Java,” in Proceedings of European Conference on Object-Oriented Programming, workshop on Reflection and Meta-Level Architectures, 2000.
[27] H. Lieberman, “Reversible object-oriented interpreters,” in Proceedings ECOOP ’87, ser. LNCS, J. B´ezivin, J.-M. Hullot, P. Cointe, and H. Lieberman, Eds., vol. 276. Paris, France: Springer-Verlag, Jun. 1987, pp. 11–19.
´ Tanter, J. Noy´e, D. Caromel, and P. Cointe, “Partial [17] E. behavioral reflection: Spatial and temporal selection of reification,” in Proceedings of OOPSLA ’03, ACM SIGPLAN Notices, nov 2003, pp. 27–46. [Online]. Available: http://www.dcc.uchile.cl/∼etanter/research/publi/ 2003/tanter-oopsla03.pdf
[28] C. Hofer, M. Denker, and S. Ducasse, “Design and implementation of a backward-in-time debugger,” in Proceedings of NODE’06, ser. Lecture Notes in Informatics, vol. P-88. Gesellschaft f¨ur Informatik (GI), Sep. 2006, pp. 17–32. [Online]. Available: http://scg.unibe.ch/archive/papers/Hofe06aUnstuckNode.pdf
[18] G. Kiczales, J. Lamping, A. Mendhekar, C. Maeda, C. Lopes, J.-M. Loingtier, and J. Irwin, “Aspect-oriented programming,” in ECOOP’97: Proceedings of the 11th European Conference on Object-Oriented Programming, ser. LNCS, M. Aksit and S. Matsuoka, Eds., vol. 1241. Jyvaskyla, Finland: SpringerVerlag, Jun. 1997, pp. 220–242.
[29] A. Lienhard, T. Gˆırba, and O. Nierstrasz, “Practical object-oriented back-in-time debugging,” in Proceedings of the 22nd European Conference on Object-Oriented Programming (ECOOP’08), ser. LNCS, vol. 5142. Springer, 2008, pp. 592–615, ECOOP distinguished paper award. [Online]. Available: http://scg.unibe.ch/archive/papers/ Lien08bBackInTimeDebugging.pdf
[19] J. Bon´er, “What are the key issues for commercial aop use: how does aspectwerkz address them?” in Proceedings of the 3rd international conference on Aspect-oriented software development, ser. AOSD ’04. New York, NY, USA: ACM, 2004, pp. 5–6.
[30] M. Martin, B. Livshits, and M. S. Lam, “Finding application errors and security flaws using pql: a program query language,” in Proceedings of Object-Oriented Programming, Systems, Languages, and Applications (OOPSLA’05). New York, NY, USA: ACM Press, 2005, pp. 363–385.
[20] R. Douence, O. Motelet, and M. Sudholt, “A formal definition of crosscuts,” in Proceedings of the Third International Conference on Metalevel Architectures and Separation of Crosscutting Concerns (Reflection 2001), ser. Lecture Notes in Computer Science, vol. 2192. Berlin, Heidelberg, and New York: Springer-Verlag, Sep. 2001, pp. 170–186.
[31] R. Lencevicius, U. H¨olzle, and A. K. Singh, “Query-based debugging of object-oriented programs,” in Proceedings of the 12th ACM SIGPLAN conference on Object-oriented programming (OOPSLA’97). New York, NY, USA: ACM, 1997, pp. 304–317.
[21] P. Moret, W. Binder, and E. Tanter, “Polymorphic bytecode instrumentation,” in Proceedings of the tenth international conference on Aspect-oriented software development, ser. AOSD ’11. New York, NY, USA: ACM, 2011, pp. 129– 140.
[32] A. Potanin, J. Noble, and R. Biddle, “Snapshot query-based debugging,” in Proceedings of the 2004 Australian Software Engineering Conference (ASWEC’04). Washington, DC, USA: IEEE Computer Society, 2004, p. 251.
[22] D. Ungar and R. B. Smith, “Self: The power of simplicity,” in Proceedings OOPSLA ’87, ACM SIGPLAN Notices, vol. 22, Dec. 1987, pp. 227–242.
[33] S. Ducasse, T. Gˆırba, and R. Wuyts, “Object-oriented legacy system trace-based logic testing,” in Proceedings of 10th European Conference on Software Maintenance and Reengineering (CSMR’06). IEEE Computer Society Press, 2006, pp. 35–44. [Online]. Available: http://scg.unibe.ch/ archive/papers/Duca06aTestLogtestingCSMR.pdf
[23] H. Lieberman, “Using prototypical objects to implement shared behavior in object oriented systems,” in Proceedings OOPSLA ’86, ACM SIGPLAN Notices, vol. 21, Nov. 1986, pp. 214–223. [Online]. Available: http://web.media.mit.edu/∼lieber/Lieberary/OOP/Delegation/ Delegation.htmlhttp://reference.kfupm.edu.sa/content/u/s/ using prototypical objects to implement 76339.pdf
[34] S. I. Feldman and C. B. Brown, “Igor: a system for program debugging via reversible execution,” in Proceedings of the 1988 ACM SIGPLAN and SIGOPS workshop on Parallel and distributed debugging (PADD’88). New York, NY, USA: ACM, 1988, pp. 112–123.
[24] Y. Matsumoto, Ruby in a Nutshell. O’Reilly, 2001. [25] C. Zhang, D. Yan, J. Zhao, Y. Chen, and S. Yang, “Bpgen: an automated breakpoint generator for debugging,” in Proceedings of the 32nd ACM/IEEE International Conference on Software Engineering - Volume 2, ser. ICSE ’10. New York, NY, USA: ACM, 2010, pp. 271–274.
[35] B. Boothe, “Efficient algorithms for bidirectional debugging,” in Proceedings of the ACM SIGPLAN 2000 conference on Programming language design and implementation (PLDI’00). New York, NY, USA: ACM, 2000, pp. 299–310. [36] A. J. Ko and B. A. Myers, “Designing the whyline: a debugging interface for asking questions about program behavior,” in Proceedings of the 2004 conference on Human factors in computing systems. ACM Press, 2004, pp. 151–158.
[26] J. J. Barton and J. Odvarko, “Dynamic and graphical web page breakpoints,” in Proceedings of the 19th international conference on World wide web, ser. WWW ’10. New York, NY, USA: ACM, 2010, pp. 81–90.
11