427488
TAP22210.1177/0959354311427488MayerTheory & Psychology
Article
Objectifying social structures: Network visualization as means of social optimization
Theory & Psychology 22(2) 162–178 © The Author(s) 2012 Reprints and permission: sagepub.co.uk/journalsPermissions.nav DOI: 10.1177/0959354311427488 tap.sagepub.com
Katja Mayer University of Vienna
Abstract Social network analysis offers a broad range of formal and interpretative methodologies to deal with social structures, not only by discursive, but also by visual means. Sociograms, depicting social relations as nodes and lines, have played an important part in the reification of social structures since the beginnings of sociometry. This paper brings together two strands of analysis: first, a historical perspective on the development of social network visualization; and, second, exemplary stories of black-boxed technologies that inform not only the depiction, but also the interpretation of social networks. The article aims to reflect upon scientific construction of social structures as knowledge that is appropriated by society not least owing to its easy handling as tool and interface. Drawing social networks is regarded as social technology and therefore as an application within the realms of social engineering.
Keywords image production, informatization, network visualization, optimization, performativity, reflexivity, social engineering, social network analysis, social technology, sociometry
“Social networks,” “networked cultures,” “complexity.” Buzzwords like these are often accompanied by visual representations of large networks showing nodes connected by lines. The social network metaphor dominates countless fields. The display of terrorist networks and the epidemic spreading of diseases are just two examples of the iconicity of the node–edge diagram in administrative and media realms. They are to be found also in daily communicative routines such as web-based contact platforms, often called “social media,” where friends of friends can nowadays be explored in the form of a network diagram that allows users to overview and trace their contacts’ activities. Corresponding author: Katja Mayer, Department of Social Studies of Science, University of Vienna, Neues Institutsgebaeude / 2 / 6, Universitaetsstrasse 7, 1010 Vienna, Austria. Email:
[email protected]
Downloaded from tap.sagepub.com at Vienna University Library on April 1, 2012
163
Mayer
Whereas such diagrams have only recently been appropriated by public media and politics, they have a long-standing tradition in social-scientific research practice, where they are deployed as tool, rationale, and proof within the methodological canon of social network analysis. Stemming from social psychology, anthropology, and sociology, the “social network” perspective treats collections of actors (e.g., people, institutions, nations, and machines) and their relationships (e.g., kinship, friendship, exchange of goods, knowledge, and beliefs) as networks. Actors are described as nodes and their relationships as ties. The social network approach comprises a fast-growing scientific set of methodologies and models, providing powerful tools for the investigation of complex social relationships. Through measuring the centrality of a node, for example, one can get insights into various roles and groupings: “[W]ho are the connectors, mavens, leaders, bridges, isolates, where are the clusters and who is in them, who is in the core of the network, and who is on the periphery?” (Krebs, 2008). While, in the 1930s, the first sociometric depictions of networks were drawn manually and produced without a mathematical and computational dispositif, today’s imaging processes are largely automated, owing to advancements in digitization and information visualization. So-called “sociograms” still make measurable social structures “self-”evident, but in contrast to early academic involvement in making social structures visible and understandable, today there is ubiquitous demand in the social media realm to see, navigate, and interfere with the communicative backbones of the “network society” (Castells, 2000). With this paper I am trying to follow selected paths of appropriation of this specific technique of making social structures visible by social scientists. I will show how the further refinement of drawing social networks leads to a black-boxing of several basic technologies into interactive and navigable surfaces of social space that are highly successful and do not need to disclose their internal complexity as they become settled as matters of fact (cf. Latour, 1999). This approach stems from my Ph.D. study on visualization practices in social network analysis, where I conducted interviews with network analysts and information visualization experts. For this project, I also observed and participated in analytical visualization processes as well as in the contextual discourses revolving around the role and function of network imagery in the research process and for mediation purposes outside the scientific field. By bringing together two strands of analysis—a historical perspective on the development of social network visualization, in particular of large networks; and exemplary stories of black-boxed technologies—this paper aims to reflect the realities that social-scientific knowledge and its applications co-shape. It intends to show how drawing social networks has evolved from being developed as a sociometric means to enable structural change in social groups, to its further appropriation as an instrument of social optimization and control for scientists and administrators. This latter development has taken place under the aegis of an informatization paradigm, before re-emerging as an automated technique in daily life to reify social structures as matters of fact rather than as objects of concern (cf. Latour, 2004).Three exemplary observations will then illustrate this reification of social structures and ascribe it to the alleged implicitness and naturalness of social network diagrams, which is due not only to their ubiquitous usage, but also to the black-boxing of the essential technological dimensions underlying them.
Downloaded from tap.sagepub.com at Vienna University Library on April 1, 2012
164
Theory & Psychology 22(2)
In becoming ergonomically refined, service applications dealing with social structures and/or communication network visualizations lose their appearance as “technology” to users and turn into black-boxed interfaces and see-through media. This is a development observable in all fields relying heavily on imaging technologies, such as medical information visualization. Unfortunately the journal at hand cannot print color images, which led to the paradoxical exercise of writing about imaging practices and color use in their absence. I therefore count on the imagination of the reader, who will have to look for social network visualizations elsewhere. Surely, they will catch your attention sooner or later, if they have not already done so.
Drawing social networks Methodologies for studying social structures were developed within a predominantly relational style of thought in the early 20th century. Einstein recommended reading Pearson’s The Grammar of Science (1892), and in mathematics, set theory, topology, game theory, and graph theory were about to be formalized (cf. Biggs, Lloyd, & Wilson, 1976). In parallel to the growth of state power, an optimistic vision had gained ground according to which “a rationality based on mathematics and empirical observation will lead to objectivity and hence to a transparency that will apply to both description and decisions” (Desrosières, 2005, p. 33). Mathematical survey methods and statistical methods in turn gave rise to fields such as biometrics and econometrics. Expanding infrastructures such as telegraph wires and telephone or transit networks enjoyed great popularity, undermining notions of the state as the centralized unit of power and of society as a coherent community. Leading social theorists had directly addressed social structures in the late 19th century, but whereas, for example, Durkheim (1895/1982) and Tönnies (1887/2001) acted on the assumption that society is always present, criminologist Tarde (1893/2009) called on sociology to aim to study associations and not to take the social and society as given phenomena, but to explain how they come into being and change. Simmel (1917) described the mission of a “pure” sociology at the beginning of the 20th century as follows: it was meant to extract the moment of socialization from the phenomena, separated inductively and psychologically from their contents and purposes, like grammar separates the pure forms of language from the contents that give life to these forms. Simmel focused on the interactions between individuals and society and on the social dynamics and structures evolving from them. He preferred researching “social forms” and “forms of socialization” (cf. Simmel, 1908/2009)—that is, networks of relationships in many different contexts—over research on the content of social realities, which to him belonged to a different kind of social science. The representatives of structural approaches in social psychology, sociology, and anthropology in the 1930s and 1940s, as well as their successors in the field of social network analysis, repeatedly referred to Simmel. Moreno—one of the prominent scholars in the field—already investigated the relationship between psychological wellbeing and the given social configurations at the beginning of the 20th century. His objective was to study social action and further develop his socio-psychological methods of group
Downloaded from tap.sagepub.com at Vienna University Library on April 1, 2012
165
Mayer
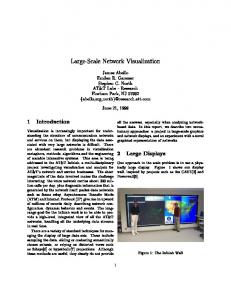
Figure 1. Sociogram and matrix Source: drawing by Katja Mayer; Caption: A–F members of a group, A: Groupleader, B: Rejected member, F: Outsider. Continuous lines: Choice, Dashed lines: Rejection.
therapy, such as role games (called “sociodrama” or “psychodrama”) and impromptu theater. He argued that “psychodrama is on the action level what psychoanalysis is on the verbal level” (Moreno, 1947, p. 353). He called his method “sociometry” and connected it to a political goal: the “sociometrical revolution” (cf. Moreno, 1934/1953) was meant not only to refine societies’ understanding of the behavior and dynamics of social groups, but also to bring about equal rights among human beings through self-empowerment. Taking part themselves in “sociometric experiments,” clients and experts should become able to reconfigure their situation and their structural embedding, and to re-create social order according to their own perspective. Unlike statistics and survey sociology, this method should not bring any prefabricated categories into data acquisition. Instead, such categories were supposed to emerge and become visible from the observed social structures themselves. Sociometrists continuously worked on new techniques of measurement and representation. Observation, interviews, and role-plays were used to learn about attraction and repulsion experienced by individuals, and social choices were noted as tables or in matrices (cf. Figure 1). In this way, following an analysis of the group and its relationship types, social cohesion could also be measured. “Before the advent of sociometry no one knew what the interpersonal structure of a group ‘precisely’ looked like,” states Moreno (1934/1953, p. lvi). Sociometry introduced sociograms as important methodological tools and as part of “sociometric experiments” and further sociometric analysis, allowing graphic representations of group structures and relationship patterns among individuals. Dots or symbols represented individuals, while lines represented connections among individuals. The resulting visualization had the purpose of allowing social structures to be handled and reconfigured. By visualizing the embedding of the actors and thereby rendering it evident, these actors could be brought to take charge of their own social embedding and initiate changes to optimize their social positions. According to Moreno, it was the sociogram that first allowed the experimental study and “precise exploration” of complex relationships, since that time considered as “social networks” and “places of origin of public opinion” (Moreno, 1967, p. 267). Social mapping applied in this way led to the discovery of the so-called “sociodynamic law,” describing the predominant choices in a group, as well as the development of patterns and forms such as the “star,” which would certainly be called a “hub” today (cf. Barabasi, 2003).
Downloaded from tap.sagepub.com at Vienna University Library on April 1, 2012
166
Theory & Psychology 22(2)
Mathematical networks or graphs During these early years, the sociometrists created their sociograms manually and in an ad-hoc fashion, giving rise to widespread criticism of the lack of the methodological stringency appropriate to science. In the 1940s, this continuing criticism of the intuitive sociogram led to a strong preference for displaying only data in matrices. The resulting standardization of data on social relations was meant to allow a more objective handling of the data (Forsyth & Katz, 1946). Representing data on social relations in the form of matrices promoted the mathematization of sociometry (Wasserman & Faust, 1994, p. 79). For the first time it was possible to identify sub-groups with mathematical means, and to calculate the status of a person, as well as prestige within a social network, all on the basis of the measured social relations. In the 1950s and 1960s this form of notation led to the emergence of topological and graph-theoretical approaches in sociometry. As a consequence, it was possible to represent social space topographically, in the form of its relationships in social graphs. The emerging availability of electronic computation of sociometric data paved the way for more complex applications of graph-theory to the analysis of group behavior (cf. Barnes & Harary, 1983). This was partly made possible by social matrices, while, for the time being, sociograms lost in importance. The advocates of sociograms (e.g., Moreno, 1946) criticized matrix notation as it made it difficult to see social patterns such as triangles, stars, and chains, but the formal processing of network data allowed the operationalization of weighted and rated connections, and, above all, the analysis of a group’s structure from the point of view of each individual group member (cf. Bavelas, 1950; Cartwright & Zander, 1953; Harary & Norman, 1953). This approach was of interest to the emerging theory of group dynamics, allowing it to model group cohesion, social pressure, cooperation, and relationships of power. However, the application of such algorithms was slow and cumbersome. Automatic processing and computers were rarely available, and in the instances where they were, the production of punch cards consumed a large amount of resources.
Informetric optimization While social graphs or sociograms were displaced from the front stage of science by matrices and matrix algebra—they still existed in sociometric pedagogy to make the relational perspective on society understandable—network diagrams became an important asset in another field: cybernetics and operations research that focused on sociotechnical networks investigating their logics of cause and effect. Flow graphs for process control and network maps were also constructed as topological graphs, making it easy to establish analogies between the measuring of social groups and electronic networks (cf. Cherry, 1963; Schüttpelz, 2007). While military logistics and the automation of weapon systems stood at the origin of cybernetics, cybernetic theories of automation and control of complex machine systems soon developed into a science of control and communication and the regulation and optimization of information resources (Wiener, 1961). Information was reified “into a free-floating, de-contextualized, quantifiable entity” (Hayles, 1999, p. 19) and elevated to the constitutive principle of a progressive, telematic society; it immediately became the measure of probable social as well as
Downloaded from tap.sagepub.com at Vienna University Library on April 1, 2012
167
Mayer
machine processes. One cybernetic goal was the management and minimization of insecurities. In such a vision of an information-based society, social relations are transformed into communication links including feedback loops. Communication behavior and information diffusion are modeled as epistemic units, while the focus is shifted away from the content towards socio-technological patterns of diffusion. Flow diagrams helped cyberneticists and futurologists in laying out world-systems as complex cause and effect models. They were also used as diagrammatic machines for decision-making, while their graphic design was borrowed from analytical philosophy but also from engineering, where technical diagrams of circuit boards and flow charts were already common. Informatization brought about not only better tools for calculation, but also new graphic interfaces. Computer-aided design (CAD) and automatic graph drawing were developed in the 1960s, first to make radar screens interactive tools, and to assist with technical drawings that use recurring elements and are the basis of construction of machinery. Such drawings quickly spread into computer science and industrial process management. As Entity-Relationship Diagrams, data flow graphs or call graphs in database design, software engineering, or CASE tools, they are based on algorithms that compute a drawing automatically according to basic rules: The graph drawing community has developed objective criteria to measure the quality of a drawing. One of these criteria is the number of crossings between edges in the drawing. We want to have as few crossings as possible. Other criteria are the length of the edges of the graph and the number of bends in the edges. The goal is to find the optimal embedding. (Mutzel & Weiskircher, 1999, para. 5)
Finding the optimal visual layout of a large and complex social network is an optimization problem, just like the ones in automatic graph drawing. Since the merging of this part of the field of information visualization with social network analysis in the mid-1990s, there are now powerful visualization engines available for social network analysis. The sociograms are back. But this time they are coming as highly formalized, computergenerated objects. Computer programs let sociologists work on the surface of visual models, without even being aware of the matrix algebra and multi-dimensional scaling algorithms that arrange the network on the screen in the background. Furthermore such programs are already highly interactive and on the verge of becoming dynamic, and therefore being capable of visually manipulating temporal networks. Today, carefully collected data may be visualized and analyzed as a network of relations at the push of a button. With the rise of the internet, social network analysis and the study of social complexity became interesting to several physicists (cf. Barabasi, 2003; Watts, 1999), who set out to describe networks of computers, websites, and users as formal structures supposedly representing patterns of communication and social relations (cf. Scharnhorst, 2003). But the techniques of social network analysis have long left the realms of science behind and settled in commerce-oriented sociology, while academic sociologists seem to cast envious looks at the enormous data sets routinely gathered by businesses and administrations over the years (Savage & Burrows, 2007). Whereas studies of network analysis were extremely time-consuming and costly
Downloaded from tap.sagepub.com at Vienna University Library on April 1, 2012
168
Theory & Psychology 22(2)
undertakings in the early years, the computing capacity and the amount of data available today outrun conventional polling and (inferential) social statistics in many regards. The likely behavior of the basic population does not need to be inferred and forecast through sampling. Organizations such as telecom providers or online search engines are datacollectors on an industrial level. They archive each individual transaction, allowing them to map and rate likely behavior. Data are exchanged with partner institutions within so-called “data consortia” (Marsh, 1998), and, in combination with data provided by public administration units such as statistical and census offices, geo-demographical databases are established in many places (Evans, 2005).
Disappearing technologies The field of social network analysis has constantly grown since the 1970s, bringing with it new methodologies and visualization instruments.With powerful computer programs for analyzing and visualizing social networks, it seems that sociograms have become once again “obligatory passage points” (Callon, 1986) for network analysts, but this time they come as visual surfaces of complex technical assemblages that are hidden within interfaces. The appearance of social structures as matters of facts requires the disappearances of their tools of production. The following section is dedicated to three exemplary dimensions of network visualizations that co-construct scientific practice of the analysis of social space, while at the same time black-boxing it for the sake of efficiency and increasing visual literacy.
Know how? How to? In general, information visualization is not part of the curricula of social science education. Images of social networks in textbooks for students are not explicated in order to make their production process transparent, even if they are applied not only as illustrations, but also as models for a relational perspective.1 Authors started only recently referring to the software used for image creation, but even if they refer to the tools of image creation, they do not explain image production. In an interview conducted in the course of my Ph.D. project, the following complaint was voiced by a computer scientist who wanted to understand quantitative sociological methodologies used in network analysis: Textbooks that elaborate on multidimensional scaling, for example, take hundreds of pages to explain how to gather data and prepare it, as well as another hundred pages of possible interpretations, but they do not explain at all how the projection from input to output data is taking place, how the projection from a high-dimensional space onto a low-dimensional space with conservation of the distances is realized. (T. A., personal communication, August 7, 2006)
Neither commonly used textbooks, nor software in network analysis explains and unfolds the basic processes of laying out a network diagram. The use of scientific images in general cannot always be ascribed to extensive knowledge of “inscription devices” (Latour & Woolgar, 1979) and the construction of figures and diagrams, rather it is linked to the
Downloaded from tap.sagepub.com at Vienna University Library on April 1, 2012
169
Mayer
availability of tools that are easy to use in handling data. During a workshop, when I addressed several social scientists who use statistical software to generate images, asking whether they understand the underlying principles of visualization, they had a hard time abstracting from their data perspective. For them these were data, just in another form. They were taught to use the tools as interpretive mechanisms so that they could then translate and verbalize the visual results back into the discursive flow. The lack of encouragement in education to play around not only with the data, but also with their appearances, to learn and understand the imaging process and its inherent styles and diagrammatic logic, might be the reason why most network analysts stick to the default styles that come with the computer programs they use. When strolling through a large international conference on social network analysis in 2007, I noticed that nearly all presentations and posters were graced with node–edge diagrams of social networks that looked rather similar: white background, nodes as circles and colored in very similar schemes and lines in black, as if they represented the standard iconic look of social network analysis today. Only a few diagrams stood out. As I was interested in the production process of network visualizations, I approached some presenters of these outstanding and aesthetically enhanced diagrams to ask them why their images looked so different. I learned that within the scientific community there is a small group of network analysts, sometimes called the “wizards,” who cooperate with computer scientists and information visualization experts to further the development of sociograms as analytical tools. I was told that they often assist other researchers who have to out-source image production owing to a lack of programming skills or timely resources. They are not only producing images for them: the cooperation ranges from discussions of possible interpretation to training the epistemic gaze in a relational perspective. One network analyst remarked, “You have to know a lot about the network, to be able to ask the right questions and construct a plausible image of it” (K. J., personal communication, August 7, 2006). In the course of my research, I was told repeatedly that in order to produce a social network visualization that can serve for further analysis, a combination of knowledge about data, formal methodologies, but also about visualization techniques is indispensable. I therefore asked where visualization experts get their knowledge from. One visualization expert who originally came from psychology summarized this as follows: “Without an affinity to mathematics and computer science, I could never have immersed myself in this—together with a strong desire to create correct representations … and of course countless hours of sketching networks manually.” He continued: I guess most of the knowledge is coming from experimenting with layouts of graphs, or the drive to optimize layouts of large networks. Call it learning by doing. … It was necessary to explore other fields of visualization, like cartography and chemistry, not only to get ideas, but also software and algorithms. (K.J., personal communication, August 7, 2006)
Other visualization experts tell similar stories. So it seems that social network analysts who want to make use of the visual dimension either trust in their software or trust visualization experts to take over what they have not been taught. Even if the proverb states that a picture is worth a thousand words, in social-scientific education, network visualizations are regarded as mere intermediaries and therefore not
Downloaded from tap.sagepub.com at Vienna University Library on April 1, 2012
170
Theory & Psychology 22(2)
paid much attention. All of my interview partners confirmed that in education, neither the techniques, nor the reflection of representation styles and the performativity of methods get taught. On the rare occasions when workshops in computer-aided network analysis are held, visualization is mostly presented as an interface to complex datasets that are otherwise unmanageable.2 Network visualizations become in that sense interfaces to deal with data. Image processing is therefore black-boxed not only in the technology, which is not made transparent, but also in the ways scholars are handling their analytic instruments. The visualization of data is presented not as a distinct technology, but as a see-through medium for analysis.
Ergonomics Understanding basic principles of visualization processes becomes even more difficult when thinking about all the standardizations already implemented in visualization software. There are many embedded features that escape attention easily as they seem so self-evident and natural. I call such features ergonomic features, as they are based on achievements of the optimization of human–machine interfaces. Ergonomics are developed not only to make the workplace safe, but also to make the worker more efficient, and thus to enhance control of “human factors,” these being the psychological, social, physical, biological, and safety characteristics of a user and her or his working environment. Achievements of psychometrics such as colorimetry are used to make network diagrams more readable. The quantification and description of human color perception serves as basis for the automated coloring of diagrammatic properties. Colorimetric models are based on standardized comparisons of single hues and delineate human color perception through statistical averages resulting from measures of “standard observers” in the normalized environment of a color lab. Computer monitors are assemblages of different color technologies. Pixels are numeric data that describe singular picture elements with relative red, blue, and green parameter values, and still on every screen colors look a little bit different. But monitors and TV screens are not the only settings dependent on such color engineering. We are surrounded by standardized colors in our daily lives. Every industrial color product, from light bulbs to printer ink, is nowadays fitted into schemes administered by the International Commission of Illumination, a statutory corporation for standardization of colors. Visual instruments based on such normalized schemes can produce millions of discriminable colors, if not to the human eye, then supposedly to the human brain. With such image processing, “the computer acts as an extension of the eye and the brain by selecting information the scientists cannot see” (Blumenthal, 1982). Software developers are concerned with scientists’ eyes and their computerized prostheses when confronted with a large, complex visualization of a social network. It is all about the efficiency of perception, which also means that the “extension of the eye” needs to be imperceptible. Network visualization software comes with built-in psychometric color schemes. To make the image efficiently readable, the information presented is automatically carefully colored. Colored elements are perceived as similar or gradually different, so that quantitative attributes can be communicated. Two-dimensional layouts can be furnished
Downloaded from tap.sagepub.com at Vienna University Library on April 1, 2012
171
Mayer
with a third, a color dimension, and even a fourth by gradients of luminosity, and hence more information can be communicated with one image. Automatic efficiency optimization via coloring cannot only be regarded as an “extension,” but must also be declared as imaging technology in itself, a further generative element of the image production process. Besides making perception more efficient, psychometric color schemes also serve to reduce aesthetic intervention by the network analyst. Normalized color usage is just one of many standards embedded in automatic network visualization. Experts in image processing often tweak color schemes in accordance with their own taste. But most users have to deal with ergonomic decisions made for them via “standard observers.” Whether this makes them more efficient, or whether this guarantees better comparability has yet to be proved. Embedded standards are nevertheless hidden technologies, which inform aesthetic practices and scientific construction of evidence, up to the point when commonly used color schemes dominate the look of network analysis. In network analysis, producing and representing knowledge are not separable. The layout of complex networks is a mathematical optimization problem, and therefore relies on another set of hidden technology. Spring embedders are algorithms that arrange the network on the plane of the screen, which they derive from a physical analogy, namely that of energy. Such force-directed algorithms treat the collection of nodes and edges as a system of forces, and the layout as an equilibrium state of the system. Generally, edges between nodes are represented as an attractive force (a “spring” pulling them together), while nodes that do not share a tie are pushed apart by some constraint to help prevent overlap. (Moody, McFarland, & Bender-deMoll, 2005, p. 1215)
The concept of energy therefore informs the understanding of social relations. Furthermore, it insinuates that social actors and their relations systematically tend towards an equilibrium of “social energy.” Even if such an imaginative interpretation is never explicitly put forward, it is inherent in making social structures visible, and in how interpretations deal with positions of actors in the center or in the periphery of the network layout. In an introductory book to network analysis software, users are advised to use the function of the energy algorithm often, until the layout has come to a “halt” (deNooy, Mrvar, & Batagelj, 2005), meaning it has reached the optimal positioning. In the words of the network analyst cited above: “I find it fascinating that one can come up with algorithms that organize such large networks as if by a ghost’s hand” (K. J., personal communication, August 7, 2006). The invisible hand that orders complex social relations makes collected data appear to be self-regulatory social networks. Those two examples of standardizations for the sake of optimizing visual literacy and the visual appearance of social structures are deeply inscribed in potential interpretations of calibrated social space. As hidden technologies, they affect not only scientific analysis of social relations, but also any network visualization based on automatic graph-drawing approaches.
Visual interface markets When network diagrams, being highly complex technological assemblages, are presented to the public, they are often perceived as convincing evidence. As another network
Downloaded from tap.sagepub.com at Vienna University Library on April 1, 2012
172
Theory & Psychology 22(2)
analyst remarked: “Even though we are working hard on our visualizations to make them understandable to a lay audience, and we are always stressing that the imagery can only serve as exploratory tools, people tend to take it for given facts.” She continues: [W]hen they see the image of the network, they think this is it. We were already hesitating sometimes to present the network visualizations at first hand, but the people want the images … because images of networks is what they get when reading newspapers or surfing the web for network-related information, … or with a click they can immerse themselves in their business networking diagram on their favorite business platform. (D.S., personal communication, May 5, 2007)
The network analyst refers to a commonly attributed characteristic of scientific images: namely that of their affirmative power as visual proofs (cf. Beaulieu, 2002). Lay users of scientific imagery can hardly abstract from the assumed evidence of the visual, especially if unaware of the production processes (cf. Mersch, 2004). Sociograms have come a long way, from their first formalized counterparts in a scientific context to the network visualizations of today’s media. But now, owing to their ubiquity, they represent a common “scopic regime” (cf. Metz, 1975) when it comes to the exploration and description of social space, so they appear to non-experts as quite convincing and readable. As noted above, network visualizations are nowadays an obligatory passage point when dealing with large datasets. Such functional images serve for exploration, rationale, and proof of social structures, but not only in academic social sciences. According to Bourdieu and Wacquant (1992), “there are … more and more agents who engage scholarly, if not scientific, knowledge in their practices and more importantly in their work of production of representations of the social world and of manipulation of these representations” (p. 250). The social network metaphor has traveled through uncountable epistemic cultures and has finally arrived in our daily lives, in our own worldviews. It serves as a self-description, co-shaping self-identity that has to be “routinely created and sustained in the reflexive activities of the individual” (Giddens, 1991, p. 51) living in a network society while trying to network through complexity. Also mass media, as well as political and economic decision makers, increasingly appropriate network visualizations to communicate social complexities. Google’s3 Chief Economist recently remarked: The sexy job in the next ten years will be statisticians. … The ability to take data—to be able to understand it, to process it, to extract value from it, to visualize it, to communicate it—that’s going to be a hugely important skill. (Varian, 2009)
Whereas in academia such “sexy” education combining social sciences and information visualization is offered only rarely—possibly related to the fact that not even the textbooks of social sciences explain how visualizations are produced, and aesthetically enhanced visualizations are met with suspicion—in the commercial field new visualization software is popping out every month. There are “draw network” buttons available for online platforms like Google, Facebook, but also for email programs like Outlook and calculation programs like Excel. Based on the theories of social relations and several scientific optimization strategies discussed above, network visualizations by the push of a button have become everybody’s business. The main usage of such visualizations
Downloaded from tap.sagepub.com at Vienna University Library on April 1, 2012
173
Mayer
revolves around self-localizations on the web and/or in economic space: where am I, where are other actors, whom do they know, and how can I position myself/my goods better? On the one hand, this seems to be the mass utilization of Moreno’s sociograms, the mass application of social-scientific knowledge, a form of engineering social space. On the other hand, they are not solely scientific models anymore: laypeople use them in their daily lives. One-click depictions of interrelations of banks, friendship in online territories, productivity in email conversations, frame strong views on social relations and invite users to intervene or change position. Such network visualizations have become social models, ergonomic models for sociality. The technology is dissolving further into interfaces of social life. These interfaces are derived from the same principles of functional imaging and optimization ideals described above, being even more ergonomic than the ones used in academia. They seem intuitively usable because they deliberately modulate with popular visual cultures and are therefore more user-friendly. Software developers are joined by people from the gaming industry, and such collaborations result in fancy and playful interface design that is definitely more fun to work with than traditional and rather cumbersome academic programs. 3D graphics and animations, such as tangible, bouncing nodes, seem to be standard in such programs. The more interactivity is built into such visual and virtually tangible interfaces, the more constructions and the more standards are assembled into the programs. As such they are not just fun to play with for consumers who want to get a glimpse of the social entanglements of friends of friends. The popularization of the automatically produced sociogram is feeding back into science: these kinds of programs are especially popular with students of social network analysis who are used to social media and their visual cultures and who are tired of the default outputs of complicated programs, because nobody taught them to visualize. As one student put it: “When I learned social network analysis … my first experiences with these complicated programs were so tiring. Now I can draw networks, and they are even looking good, I guess” (K.L., personal communication, June 20, 2007). Neither students, nor consumers are the main target groups of network visualization software developers. On the contrary, the main target groups are administrations and companies, which aim to explore, locate, and control social structures. The technology aims to enable reliable judgment based upon visual knowledge. Even if the know-how of image interpretation and navigation is to be more important than that of image production, the sheer enormity of datasets at hand requires elaborate imaging techniques, packed in easy-to-handle interfaces. As another network analyst remarked: “Politicians, businesspeople and their information designers, they do not know about scientific methodology. They just want to make beautiful images.” He continued: “[T]his is the reason we want to pack all the knowledge we have—also the aesthetic knowledge— into software, so that everybody can draw networks that are scientifically correct— well, at least they meet some scientific criteria” (A.R., personal communication, March 28, 2007). With this embedding of relevant technologies in the instrument, software developers are hoping to establish a kind of “mechanical objectivity” (cf. Daston &
Downloaded from tap.sagepub.com at Vienna University Library on April 1, 2012
174
Theory & Psychology 22(2)
Galison, 2007) which assigns the ideal of objective scientific practice to the machine, as the user is regarded as either ignorant or always tempted to manipulate and aesthetically engage with the imaging process. With further automatization and limited access to manual image processing, network diagrams become objectified matters of fact and digital interfaces to social space. Hence as means of (self-)realization of a networked society, they are not only representing or describing social space, but also “optimizing” it, just like the force-directed layouts of the “spring embedder” algorithms.
Concluding notes and outlook Educational textbooks as well as software deal with network visualization as rather self-evident and implicit methodology. According to this reductive perspective, network images serve as models and illustrations of theories and procedures, optimizing the efficiency of the scientific gaze. They are therefore used as if they were transparent media. The intention of this paper is to offer another perspective in line with a reflexive turn towards the performativity of social-scientific technologies and their potentials of “engineering social life” (cf. Mesny, 1998, p. 162). Law and Urry (2003) argue that social-scientific methodologies help to create social realities, and that social scientists should think about the social worlds they co-construct. Whereas these authors stress the reflexive dimension of social-scientific work, others have stressed the social function of social sciences and explicitly called on applied social sciences that should lead to a body of knowledge “in an intelligible form for the use of administrators, voters and reformers” (Henderson, 1901, pp. 480–481), leading to social reform. The creative dimension of social sciences, without a strong emphasis on reflexivity, has been a central concern to theorists of “social technology” (Henderson, 1901) or “social engineering” (Popper, 1945). In their view, social technologies are applications of social-scientific knowledge. In line with the paradigm of post-war enlightenment, Popper emphasized ideals of individualism and freedom of the market in order to oppose totalitarian hegemonies and to support the creation of a responsible and self-reliant civil society. For these early advocates of “social technology” or “social engineering,” applications of the analysis of social structures like visualizations of complex networks with their potential of allocation of every single node and relation were in the reserve of utopian concepts. Today, they are realities, making socio-economic space visible and tangible and allowing precise intervention in terms of social optimization. Visualizations of social networks can thus be regarded as social technologies. As applications of social-scientific knowledge, they do not only help administrators to control society. They have not only become descriptors of social structures, but are now means of self-description and part of the autobiographies and optimization strategies of networked individuals. They bring into being what they describe, creating matters of fact, and hence they should become “matters of concern” (Latour, 2004). When treated as matters of concern, network diagrams become porous objects. A closer look at the various processes of objectification, as presented in this article, should draw attention to the capacities of visual social structures as analytic, but also as realized entities.
Downloaded from tap.sagepub.com at Vienna University Library on April 1, 2012
175
Mayer
The business of drawing networks is no longer in the hands of academic network analysts, even if formal scientific principles are implicit in visualization software. It has been appropriated by the object of research, namely society. With further normalization and standardization, the diagrammatic machinery is informing collective experiences and it is a constitutive factor in networking agency and modeling (cf. Munster, 2006). From diagrammatic analysis to sociometric instrument to control interface, sociograms are treated in the preceding sections of this paper as social technology, but not only as “technical solutions to social issues” (cf. Bulmer, 1982). Because of the reification, commodification, and industrialization of functional network imaging, sociograms are powerful co-constitutors of network society. In daily communicative routines and online profiling, network visualizations can be objectified by the single click of a button. It seems the “scopic regime” (cf. Metz, 1975) of automated sociograms constitutes social space that calls to be optimized by the “flexible selves” (cf. Holmes, 2006) of a network society. The technique of visualizing social networks helps intervenion in social space, just as Moreno and his fellow sociometrists envisioned. But instead of first and foremost empowering the individual to understand and change her or his social positioning, it serves nowadays also as an instrument of control for administration and industry. Network visualizations have the look and feel of ergonomically refined interfaces to social space. Social structures become evident and tangible, and no longer questionable as highly constructed epistemic objects. If visualizing social networks means to objectify social structures in the sense that they become molded into normalized objects, shouldn’t it be in the interest of careful scientists to think about the “ontological politics” (Law & Urry, 2003) that are entwined with their scientific methodology and instrumentation? It is not the concern of this paper to condemn social network visualizations and pleasurable interfaces; on the contrary. Rather, this paper seeks to highlight the utmost importance of making explicit their inherent socio-technical inscriptions: for example, by referencing not only the underlying data, but also the means of image production, or by opening up visualizations to multiple perspectives created with different layout algorithms so that viewers can compare and relativize their gaze. In this vein, the project of “reverse imagineering” (cf. Holmes, 2004) social technologies of network visualization becomes an important one. Funding My Ph.D. research was partly funded by the Austrian Science Fund, project P17600: Materiality and Temporality of Performative Speech Acts.
Acknowledgements Observations and interview excerpts in this text stem from my Ph.D. study: Imag(in)ing Social Networks (2011). I wish to thank Arno Böhler and Ulrike Felt for their continuing support, as well as Anne Beaulieu, Maarten Derksen, and the anonymous reviewer for their useful comments.
Notes 1. This can be linked to an overall neglect of epistemic images in social sciences, even if sociology was no less a visual scientific field, especially until the early 1940s, as Keller (2006) shows (Mayer, 2011).
Downloaded from tap.sagepub.com at Vienna University Library on April 1, 2012
176
Theory & Psychology 22(2)
2. My data are from Germany and Austria. They were collected from 2006 to 2009. Hence this statement relates to this region and period. Currently we are seeing a rising tendency in the supply of courses in computer- and visualization-supported network analysis. 3. Google’s Page Rank Algorithm is also based on achievements of social network analysis and bibliometrics (Mayer, 2009).
References Barabasi, L. (2003). Linked: How everything is connected to everything else and what it means. New York, NY: Plume/Penguin. Barnes, J.A., & Harary, F. (1983). Graph theory in network analysis. Social Networks, 5, 235–244. Bavelas, A. (1950). Communication patterns in task oriented groups. Journal of the Acoustical Society of America, 22, 271–282. Beaulieu, A. (2002). Images are not the (only) truth: Brain mapping, visual knowledge, and iconoclasm. Science, Technology and Human Values, 27, 53–86. Biggs, N.L., Lloyd, E.K., & Wilson, R.J. (1976). Graph theory 1736–1936. Oxford, UK: Oxford University Press. Blumenthal, D. (1982). Image processing. Advances techniques enable scientists to pursue new studies. NIH Record, 24(8), 11. Bourdieu, P., & Wacquant, L. (1992). An invitation to reflexive sociology. Cambridge, UK: Polity. Bulmer, M. (1982). The uses of social research: Social investigation in public policy making. London, UK: Allen & Unwin. Callon, M. (1986). Elements of a sociology of translation: Domestication of the scallops and the fishermen of St. Brieuc Bay. In J. Law (Ed.), Power, action and belief: A new sociology of knowledge? (pp. 196–233). London, UK: Routledge. Cartwright, D., & Zander, A. (1953). Group dynamics: Research and theory (1st ed.). Evanston, IL: Row Peterson. Castells, M. (2000). The information age: Economy, society and culture: Vol. 1. The rise of the network society (2nd ed.). Oxford, UK: Blackwell. Cherry, C. (1963). Kommunikationsforschung—EineneueWissenschaft [Communication research— A new science]. Hamburg, Germany: Fischer. Daston, L., & Galison, P. (2007). Objectivity. Brooklyn, NY: Zone. deNooy, W., Mrvar, A., & Batagelj, V. (2005). Exploratory social network analysis with Pajek: Structural analysis in the social sciences. Cambridge, UK: Cambridge University Press. Desrosières, A. (2005). Die Politik der GroßenZahlen: Eine Geschichte der statistischenDenkweise [The politics of large numbers: A history of statistical reasoning]. Berlin, Germany: Springer. Durkheim, É. (1982). The rules of sociological method (W.D. Halls, Trans.). New York, NY: Free Press. (Original work published 1895) Evans, M. (2005). The data-informed marketing model and its social responsibility. In S. Lace (Ed.), The glass consumer: Life in a surveillance society (pp. 99–132). Bristol, UK: The Policy Press. Forsyth, E., & Katz, L. (1946). A matrix approach to the analysis of sociometric data: Preliminary report. Sociometry, 9, 340–347. Giddens, A. (1991). Modernity and self-identity: Self and society in the late modern age. Palo Alto, CA: Stanford University Press. Harary, F., & Norman, R.Z. (1953). Graph theory as a mathematical model in social science. Ann Arbor: University of Michigan Press. Hayles, N.K. (1999). How we became posthuman: Virtual bodies in cybernetics, literature, and informatics. Chicago, IL: University of Chicago Press. Henderson, C.R. (1901). The scope of social technology. American Journal of Sociology, 6, 465–486.
Downloaded from tap.sagepub.com at Vienna University Library on April 1, 2012
177
Mayer
Holmes, B. (2004). Reverse imagineering: Toward the new urban struggles. Retrieved from http:// brianholmes.wordpress.com/2004/01/29/reverse-imagineering/ Holmes, B. (2006). The flexible personality: For a new cultural critique transversal. Retrieved from http://transform.eipcp.net/transversal/1106/holmes/en Keller, F. (2006). Evidenz der Gesellschaft: Die Genealogie visueller Objekte im American Journal of Sociology [Evidence of society: The genealogy of visual objects in the American Journal of Sociology]. In B. Nitsche, I. Otto, M. Spaniol, & M. Cuntz (Eds.), Die Listen der Evidenz: Mediologie [Lists of evidence: Mediology] (Vol. 15, pp. 203–220). Cologne, Germany: DuMont. Krebs, V. (2008). Social network analysis: A brief introduction. Retrieved from http://www.orgnet.com/sna.html Latour, B. (1999). Pandora’s hope: Essays on the reality of science studies. Cambridge, MA: Harvard University Press. Latour, B. (2004). Why has critique run out of steam? From matters of fact to matters of concern. Critical Inquiry, 30, 225–248. Latour, B., & Woolgar, S. (1979). Laboratory life: The social construction of scientific facts. London, UK: Sage. Law, J., & Urry, J. (2003). Enacting the social. Lancaster, UK: Department of Sociology and Centre for Science Studies, Lancaster University. Retrieved from http://www.lancs.ac.uk/fass/ sociology/papers/law-urry-enacting-the-social.pdf Marsh, H. (1998). What's in store? Marketing, 15 (October), 37–8. Mayer, K. (2009). On the sociometry of search engines: A historical review of methods. In K. Becker & F. Stalder (Eds.), Deep search: The politics of search beyond Google (pp. 54–72). Innsbruck, Austria: Studienverlag. Mayer, K. (2011). Imag(in)ing social networks. Dissertation, Department of Social Studies of Science, University of Vienna, Austria. Retrieved from http://othes.univie.ac.at Mersch, D. (2004). Das Bildals Argument:Visualisierungsstrategien in der Naturwissenschaft [The image as argument: Visualization strategies in natural sciences]. In C. Wulf & J. Zirfas (Eds.), Ikonologien des Performativen [Iconologies of the performative]. Munich, Germany: Fink. Retrieved from http://www.dietermersch.de/files/downloads01.html Mesny, A. (1998). Sociology for whom? The role of sociology in reflexive modernity. Canadian Journal of Sociology, 23, 159–178. Metz, C. (1975). The imaginary signifier. Screen, 16(2), 14–76. Moody, J., McFarland, D., & Bender-deMoll, S. (2005). Visualizing network dynamics. American Journal of Sociology, 110, 1206–1241. Retrieved from http://www.stanford.edu/group/sonia/ papers/DynamicNetworkViz_AJS.pdf Moreno, J.L. (1946). Sociogram and sociomatrix: A note to the paper by Forsyth and Katz. Sociometry, 9, 348–349. Moreno, J.L. (1947, November). Sociometry and the social psychology of G.H. Mead. Sociometry, 10, 350–353. Moreno, J.L. (1953). Who shall survive? Foundations of sociometry, group psychotherapy and sociodrama (2nd ed.). Beacon, NY: Beacon House. (Original work published 1934) Moreno, J. L. (1967). Die Grundlagen der Soziometrie [Foundations of sociometry]. Cologne/ Opladen, Germany: Westdeutscherverlag. Munster, A. (2006). Materializing new media: Embodiment and information aesthetics. Dartmouth, NH: University Press of New England. Mutzel, P., & Weiskircher, R. (1999). Automatic graph drawing. Retrieved from http://domino. mpi-inf.mpg.de/internet/news.nsf/Spotlight/19990308 Pearson, K. (1892). The grammar of science. London, UK: Adam & Charles Black.
Downloaded from tap.sagepub.com at Vienna University Library on April 1, 2012
178
Theory & Psychology 22(2)
Popper, K. (1945). The open society and its enemies. London, UK: Routledge. Savage, M., & Burrows, R. (2007). The coming crisis of empirical sociology. Sociology, 41, 885–899. Scharnhorst, A. (2003). Complex networks and the web: Insights from nonlinear physics. Computer-Mediated Communication, 8(4). Retrieved from http://jcmc.indiana.edu/vol8/ issue4/scharnhorst.html Schüttpelz, E. (2007). Ein absoluter Begriff: Zur Genealogie und Karriere des Netzwerkkonzepts [An absolute concept: The genealogy and career of the network idea]. In S. Kaufmann (Ed.), Vernetzte Steuerung [Networked governance] (pp. 25–46). Zurich, Switzerland: Chronos. Simmel, G. (1917). Grundfragen der Soziologie. (Individuum und Gesellschaft) [Fundamental questions of sociology. (Individual and society)]. Berlin, Germany: Göschen’scheVerlagshandlung. Retrieved from http://socio.ch/sim/gs171.htm Simmel, G. (2009). Sociology: Inquiries into the construction of social forms (A.J. Blasi & M.J. Kanjirathinkal, Eds.). Leiden, The Netherlands: Brill. (Original work published 1908) Tarde, G. (2009). Monadologie und Soziologie [Monadology and sociology] (J. Sames & M. Schillmeier, Trans.). Frankfurt am Main, Germany: Suhrkamp. (Original work published 1893) Tönnies, F. (2001). Community and civil society (J. Harris & M. Hollis, Trans.). Cambridge, UK: Cambridge University Press. (Original work published 1887) Varian, H. (2009, January). How the web challenges managers. McKinsey Quaterly. Retrieved from http://www.mckinseyquarterly.com/Hal_Varian_on_how_the_Web_challenges_managers_ 2286 Wasserman, S., & Faust, K. (1994). Social network analysis. Cambridge, UK: University Press. Watts, D.J. (1999). Small worlds: The dynamics of networks between order and randomness. Princeton, NJ: Princeton University Press. Wiener, N. (1961). Cybernetics or the control and communication in the animal and the machine. Cambridge, MA: MIT Press. Katja Mayer studied sociology, physics, and philosophy, with a focus on social studies of science. Before working as an IT consultant, information analyst, and university lecturer, she was responsible at Public Netbase Vienna for content development, research, and production of lecture series and exhibitions in the following fields: interfaces, robotics, virtual worlds, surveillance, and cultural intelligence. She also worked at the Department of Philosophy, University of Vienna, on the “Performativity of Knowledge” and she wrote her dissertation on visualization practices in social network analysis at the Department of Social Studies of Science in the same university. Address: Department of Social Studies of Science, University of Vienna, Neues Institutsgebaeude / 2 / 6, Universitaetsstrasse 7, 1010 Vienna, Austria. Email:
[email protected]
Downloaded from tap.sagepub.com at Vienna University Library on April 1, 2012