Computers in Human Behavior 49 (2015) 623–634
Contents lists available at ScienceDirect
Computers in Human Behavior journal homepage: www.elsevier.com/locate/comphumbeh
A 3D visualization framework to social network monitoring and analysis Amadeu S. Campos Filho a,⇑, Magdala A. Novaes a,b, Alex S. Gomes c a
Telehealth Center, Clinical Hospital, Federal University of Pernambuco, Recife, PE, Brazil Department of Internal Medicine, Federal University of Pernambuco, Recife, PE, Brazil c Informatics Center, Federal University of Pernambuco, Recife, PE, Brazil b
a r t i c l e
i n f o
Article history:
Keywords: Usability Visualization 3D
a b s t r a c t Since the rise of the Internet, the volume of metrics (indicators) used to measure current conditions of the service has been increasing exponentially. One of the challenges is to transform this amount data into legible information through visualization techniques. Visualization and monitoring indicators design is an actual and relevant challenge to provide intuitive, clear and direct understanding of large datasets. The solutions to the problem points to complex Graphical User Interface (GUI) that demands high cognitive efforts to handle it. This paper aims to present and evaluate the design process of a 3D visualization framework conceived to be easy to understand. We adopted user-centered design process to develop the concept model and usability concept to evaluate it. The usability evaluation was conducted using a Telehealth indicators dataset. Data were collected through observation technique and with the help of usability questionnaires. Data analysis was based on quantitative and qualitative approaches. The results describe the major advantages and limitations of the 3D visualization framework. We observed an overall good usability level. Meanwhile, users reported a total of 18 usability problems and proposed 35 suggestions to improve the user experience. They demonstrated strong motivation and interest in using the prototype. The usability problems of the visualization interface guided new improvements. Ó 2015 Elsevier Ltd. All rights reserved.
1. Introduction Currently, the volume of data increases very fast and it becomes more difficult to extract and visualize informations among it. It is necessary to use tools to transform these data in meaningful information. As a consequence to these phenomena, Schwartzman and Borning (2007) observed an increasing demand for methods and tools to support knowledge construction and variables (indicators) evaluation. These methods are used to present informations to managers in several areas, such as: health, education, economics, mathematics, engineering, and industry. One powerful method to deal with this kind of task is data visualization. Card, Mackinlay, and Shneiderman (1999) define visualization as a process to retrieve raw data and transform it into easy visual forms. Kantardzic (2011) defines visualization as a display of behavior of complex states in such understandable by human. Over time, many hundreds of social network indicators are evaluated in an attempt to get an intuitive sense of this data but it was becoming more difficult. The reason is that traditional visualization techniques do not show clearly all details of complex database. They are not designed to support immediately trends ⇑ Corresponding author. Tel.: +55 (81) 21263903; fax: +55 (81) 21263904. E-mail address:
[email protected] (A.S. Campos Filho). http://dx.doi.org/10.1016/j.chb.2015.03.053 0747-5632/Ó 2015 Elsevier Ltd. All rights reserved.
discover from a fast inspection on two dimensions (2D) visualizations on a piece of paper, without loss of vision (Cvek, Trutschl, Kilgore, Stone, & Clifford, 2011). Adequate representations can often communicate information through indicators more rapidly and effectively. They can help decision makers prioritize theirs actions and regulations required to optimize the outcomes (Malczewski, 2006). In the International Conference on ‘‘Visualizing and Presenting Indicator Systems’’, March 2005, at Federal Statistical Office, Neuchatel, some participants presented new ideas about visualization and indicators monitoring in service quality (Swiss Federal Statistical Office, 2005). According to Alfons, Templ, and Filzmoser (2009) there are many research projects on two dimensions graphical user interface providing quickly insights about indicators and reducing search time and cognitive load of awareness. The presentation of these indicators can efficiently communicate if the information is correct or mislead to users. Visualization of indicators is an issue that requires special attention due to the overwhelming information that users receive and the lack of overview solutions that avoid users to get lost inside of the visualization. In some cases 2D visualization techniques cannot give to the user insights about the data because there is so much data to be represented in a 2D interface. Some authors (Sharafi, 2011; Tufte,
624
A.S. Campos Filho et al. / Computers in Human Behavior 49 (2015) 623–634
2001; Ware, 2012) argue that the use of two dimensions (2D) is sufficient to show only the information. The use of a new dimension (3D) should be applied to visualize the relations between the data in a semantically structured data set; or when more than two variables of the same data set are analyzed. Others, however, think that 3D visualizations techniques facilitate understanding by the human visual system (Irani & Ware, 2003), because they believe that the inclusion of aesthetically appealing elements such as 3D graphics and animations can improve the capabilities of interpretation, intuition and the ability to memorize (Hullman, Adar, & Shah, 2011; Komlodi, Hercegfi, Jozsa, & Koles, 2012). In the other side, social media platform are growing quickly and are becoming increasingly complex. In many cases, social data is unstructured and this makes difficult for users to summarize, understand and make sense of them in order to better decide and discover insights (Chakraborty, 2014; Keim, 2002). To overcome those problems, we designed a 3D visualization framework. The goal of this paper is to describe the design process and the usability evaluation of this 3D framework. For the users tests, our case study was performed using Telehealth and social media data. Telehealth is the use of Information and Communication Technology – ICT to offer health services (Education, research and healthcare) remotely. 1.1. Comparative analysis of competitors Before we develop and evaluate the usability of the prototype, we realized a comparative analysis of existing solutions in order to identify in the literature software with 3D technique that is more suited to the previously identified requirements. The competitor analysis is a technique that involves the assessment of products already on the market in order to collect guidelines and principles of good design practice for the development of a new product (Borchers, 2000). Thus, by identifying these elements can be found useful features and characteristics that must be maintained in the new product design and those that should be avoided. In addition, Nielsen (1993) emphasize that the analysis of competitors can also help to identify potential usability issues because it is important to visualize and to identify the mistakes of competitors so that errors are not repeated. The aim of competition analysis is to extract features of the selected 3D software, assess the strengths and weaknesses of competitors and identify the best 3D software that fits with the requirements defined in the literature review. Before the analysis of competitors, we define the minimum requirement was to have a 3D visualization technique scatterplot. We chose this requirement because the data to be analyzed were multivariate numerical indicators where the 3D scatterplot visualization technique would enable the six variables simultaneously. In addition to this requirement, the software would have to meet the following features that are related to the identified requirements: freeware, database
integrated via XML or Excel file, data filter, Animation, Drag, Zoom, Subtitle, hierarchical cluster and rotation. After research, we identified the following 10 competitors: Origin, Graphing Calculator 3D Grapher10, SimpleGraph3D, 3D Graphs Calculus, CoPlot, 3D Graph Explorer, Excel3Dscatterplot, 3D XY Scatter Chart. All these software were analyzed according to the requirements listed above and the test result can be seen in Table 1. According to Table 1, most software analyzed did not meet 100% of the necessary requirements to be the object of study for analysis proposed in this study. For this reason, it was decided it would be better to develop a new prototype based on variables and previously defined requirements and in some features and functionalities of both 2D and 3D display technologies that solve the problems found in the literature review and were not found in tools analyzed competitors. 1.2. Framework for 3D information visualization The 3D information visualization framework was designed using a user-centered design process. The process of user-centered design is a technique that involves the user in all phases of the design cycle as shown in Fig. 1 (Mao, Vredenburg, Smith, & Carey, 2005). We used the User-Centered Design because it involves in a multidisciplinary approach to design, based on the active involvement of users to a clear understanding of the role of the user, the requirements of tasks and design iterations (such as project and process) and assessments. It is considered as a key element for utility and usability. Fig. 1 shows the user-centered design process briefly and aims to include the perspective and needs of the user in the design process of the artifact. The generation phase of the concept and idealization of the prototype was initialized with the analysis of competitors and finished with results of the data analysis of user profile and the identified requirements. After the conclusion of the first phase, the requirements document is revised to start new phase of design and development of the prototype. The techniques used in the design of the prototype and development of the system were the creation of characters and scenarios that helped in understanding the context to be developed. For preparation of scenarios and characters were used the results obtained during the first phase conducted in this study. The first step was to define the types of interactions with the user. The interactions with users depend on the tasks that will be performed. The choice of interactions styles was based on the fundamental premises of human visual perception (Card et al., 1999; Chen, 2006; Ware, 2012). The interactions mapped by Amar, Eagan, and Stasko (2005) and Shneiderman (1998) also inspired our design. We had chosen those that best fit the purposes of 3D interface design. The criteria were such that interaction allow user to: click, move, retrieve the value, rotate, zoom (in/out), filter,
Table 1 Comparative analysis of competitors. Software
Scatter plot
Freeware
Data base
Filter
Animation
Drag
Zoom
Rotation
Cluster
Origin Graphing Calculator 3D Grapher10 SimpleGraph3D 3D Calculus Graphs CoPlot 3DGraphExplorer Excel3Dscatterplot 3D XY Scatter Chart
Yes Yes Yes No No No No Yes Yes
No No No Yes Yes Yes Yes Yes Yes
xls xls/cvs xls/cvs web No xls Function xls xls
Yes No No No No No No No No
Yes Yes No Yes Yes No No Yes Yes
Yes No No No No No No No No
Yes Yes No Não Yes Yes Yes Yes Yes
Yes Yes No Yes Yes Yes Yes Yes Yes
Yes No No No No No No No No
A.S. Campos Filho et al. / Computers in Human Behavior 49 (2015) 623–634
select, view on demand, group, save and order. After that, we proposed an initial scenario for the service (Fig. 2). As we can see in Fig. 2, data are structured in an XML file before display. It can be obtained remotely from any social network via a web service or locally through a simple search from a database. It can also be uploaded to the system from a XML file. Once the data is retrieved, the system process data and generate a 3D visualization. Thus users can interact with its 3D interface when visualizing and to inspect data. This architecture can be adapted to many distinct domains (Campos Filho, Gomes, & Novaes, 2012). We developed the architecture of the framework based on a three-tier architecture (Fig. 3). The chosen architecture for prototype development was based on the three-layer structure for various reasons, including: (a) its development is performed quickly, simple, easy and very low cost; (b) data transfer is performed only through the eXtensible Markup Language (XML), facilitating and minimizing customer maintenance; (c) the data access layer can be updated in a single centralized location. You do not need to distribute customer components when there are changes in this layer; (d) greater reusability;
625
(e) ease of understanding of the code; (f) 3-tier architecture was validated by Bochicchio, Longo and Vaira (2011) to be used in applications with 3D techniques. The presentation layer contains the graphical user interface. The business layer encloses the functional modules of the system and the data layer provides access and communication with database or external systems. The presentation layer is the most important layer of a system for visualization the information. It provides direct manipulations facilities to users (Sommerville, 2011). According to Prates and Barbosa (2003), user sees the interface as the system. For these authors, the GUI determines the quality of the system, not its algorithms, architecture, and structured data models. Users also interact with the system in only the Graphical User Interface layer; that can be developed independently of the other layers. The XML file is stored in the data layer (Fig. 3). In order to convert and present data from the XML file to be viewed into the presentation layer, a transformation operation undergo in the business layer. The business layer analyzes and interprets data in the XML and then the data is sent to the GUI layer to be generated using multiple 3D visualization techniques. In this case the interface does not have to be concerned with the data structure or where they come from, but only how to represent them and which
Fig. 1. User-centered design process.
Fig. 2. Scenario of the 3D prototype.
626
A.S. Campos Filho et al. / Computers in Human Behavior 49 (2015) 623–634
Fig. 3. 3D framework architecture.
is the best technique to do it (Campos Filho, Freitas, Gomes, & Vitorino, 2012). The isolation between the user interface and the data layer allows the generation of several diverse types of visualization techniques to the same data structure. This can facilitate the interpretation and understanding of the data to resolve the question of the problem and hence making the correct decision. Zhang and Norman (1994) showed that people understand the same problem in different ways depending on how the information is presented and the rules were shown explicitly or implicitly.
1. To choose or to upload a XML file or load a view already saved in the system (Fig. 4). 2. Define which graphical element (X, Y, Z, size, color and shape) will represent each quantitative and qualitative variable and also define the environment settings such as background color, and color and font size of the text (Fig. 5). 3. After these steps, the user will view the data set (Fig. 6) and will be able to interact with the environment through the menu on the right side of the screen. The following types of interactions can be performed on the prototype:
1.3. Prototype: 3DataView The 3DataView prototype provides a visual representation of the monitoring indicators. In a first moment it was used in a Telehealth service to present quantitative and qualitative variables in a Cartesian plane based on the scatter plot technique in three dimensions. In the 3D graphic, quantitative variables are represented by X, Y, Z, and also by the size of the object axes. Qualitative variables can also be represented by color and geometric shape of the elements (Campos Filho, Gomes, & Novaes, 2013) (Fig. 6). We used the upload function to communicate with the database as defined in the architecture of the framework. Before viewing the data, users have to configure the 3D visualization environment through the following steps:
(a) Change the variables that are being visualized at any time by clicking on ‘‘Environment Setting’’ panel that is located on the menu. (b) Move the camera position (up or down, right or left) by clicking on the arrows located on the menu or by pressing the arrow keys on the keyboard. (c) Rotate the graph with the mouse to better visualize a particular object or to view an object that is being hidden by another. This kind of interaction can solve the problem of occlusion between objects. (d) Filter objects by any variable defining the limits of the respective variable filter.
Fig. 4. XML file uploading panel.
A.S. Campos Filho et al. / Computers in Human Behavior 49 (2015) 623–634
627
Fig. 5. Panel to set the Variables.
Fig. 6. 3D environment.
(e) Select an object by clicking on it. At this moment, the information about the object become visible, the object is highlighted and grid line for the values in the X, Y and Z axes becomes visible. (f) View the respective information concerned to each object as they need through on a panel that is visible only when the mouse is over the object. (g) Groups the objects very close in clusters and the user can click on that cluster to visualize in more detail the objects that are part of the cluster.
(h) Save the visualization with default configuration so that it can again display the same data set later. 2. Materials and methods The purpose of this study aimed to validate the framework and evaluate the usability of prototype for visualizing information in three dimensions. The approach was inductive method with experimental scope, with a mixed process of analysis containing an analytical part and another statistic. As the process is mixed,
628
A.S. Campos Filho et al. / Computers in Human Behavior 49 (2015) 623–634
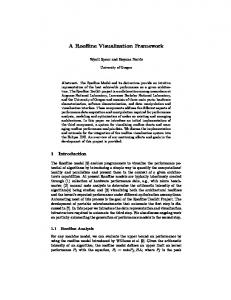
the nature of the variables was qualitatively and quantitatively. The qualitative variable was used for the study and analysis of the users interpretation of the object studied and understand how users perceive the object studied and what were your experiences about it, understand their actions, their environment and the context in which the object is inserted and give a description of the built social perception. The quantitative variable was used to analyze the opinions, reactions, attitudes and habits that were measured by users. The data was collected through a case study involving Telehealth professionals. The participants performed three tasks using the prototype. The evaluation of the results was divided into three stages: ergonomic usability evaluation, assessment of the importance of usability problems encountered in 3D technical and qualitative usability evaluation. The quantitative measures of the usability evaluation were collected using different questionnaires completed by the participants. Qualitative data were obtained using interviews and screen recordings. 2.1. Participants According to the parameters for calculating the sample size and significance, the sample size who answered the questionnaire was thirty (30) participants. We conducted the evaluation from September 2013 to November 2013 with a sample of Telehealth services professionals. The mean age was 27 years (d = 4.54) 56% men and 44% women. Regarding education level: professional graduates (67%) and 33% students. The area of expertise of the participants is diverse and can be seen in Fig. 7. Most professionals (78%) had some experience in the use of information visualization techniques. According to Nielsen (1993), one user can identify approximately 30% of usability problems an interface. Nielsen presented in his studies that from starting with five (5) users, the increasing number of faults identified does not represent a significant gain. The percentage of usability mistakes found by a group of five users is 85 %, which represents the best cost-benefit ratio (Nielsen, 1993). 2.2. Dataset We used a dataset collected from the Telehealth service of Network of Telehealth centers in Pernambuco called RedeNUTES.
This dataset contains data from 97 family’s health units with Telehealth points collected over October 2012. The dataset includes the following variable: total of Telehealth points, total of extra Telehealth points, National Register of Health Care Facilities (CNES) number, total of professionals in the family health team, total of Teleconsulting, total of formative second opinion, total of assistance exams, total of professionals that work in the family health team and participate in educational practices and total of others health professionals that participate in educational practices. 2.3. Evaluation Unfortunately there are no usability studies in the 3D Information Visualization area for analyzes of Indicators. We only found few usability studies (Bach & Scapin, 2003; Barzargan, Falquet, & Metral, 2010) in augmenting 3D virtual environments (3DVEs) with abstract information because it is recently a new research area and it requires a lot of effort, both to make the experience itself as to analyze the results correctly. Usability studies in Information Visualization have recently gained credibility in the 2D graphic visualization community as well as the recognition of their contribution to help with the focus of important issues in the area. On the other hand, the most of studies found in the literature (Forsell & Johansson, 2010; Freitas et al., 2002; Hoashi, Hamawaki, Ishizaki, Takishima, & Katto, 2009; Rester et al., 2005; Shamim, Balakrishnan, & Tahir, 2014) was about usability evaluation in relation to diverse area in 2D interfaces. Among these studies we selected the most common usability evaluation heuristics used for computer systems to be analyzed and adapted to our researcher scenario: the five quality components Nielsen (Nielsen, 1993), the eight rules of Shneiderman (Shneiderman, 1998), the seven ergonomic principles proposed by the standard ISO 9241:10 (ISO 9241: 10, 2013) and eight ergonomic criteria Bastien and Scapin (BASTIEN; SCAPIN, 1993). All of them contain their specific characteristics and, in general, need to be customized according to the type of interface that will be analyzed. Among them, we based the usability questionnaire on ergonomic diagnosis that participants rated the frequency that the ergonomic criteria occur in the 3D environment and chose the criteria for Bastien and Scapin (1993) because they have developed a set of criteria that is a way to improve the integrity and explanation of the diagnosis,
Fig. 7. Knowledge area of participants in Telehealth.
A.S. Campos Filho et al. / Computers in Human Behavior 49 (2015) 623–634
standardization of assessment format, and to improve the usability evaluation documentation based on ergonomic design and the design process and evaluation of Human Computer Interfaces (HCI). The techniques applied in the evaluation of the 3D environment prototype were: observation (Taylor-Powell & Steele, 1996), Cognitive Task Analysis – CTA (Chipman, Schraagen, & Shalin, 2000) and ergonomic diagnosis (Bastien & Scapin, 1993). The instruments used for data collect according to each technique were: Interview, computer screen record, and Usability Questionnaire based on ergonomic criteria of Bastien and Scapin (1993). The application of CTA has executed together with observation techniques. While the researcher observed the user accomplishing the tasks, he also recorded the behavior of the user regarding the cognitive processes in task performance. CTA aims to produce a description of the knowledge that users use to perform complex tasks (Clark, Feldon, Van Merrienboer, Yates, & Early, 2008). The behaviors data were recorded and lately analyzed.
629
2.5. Data analysis We used a spreadsheet to organize the data collected from the questionnaires during case study. We calculated the mean and standard deviation of each of the items of the questionnaire and for the number of responses for each of the options in the Likert scale used for the calibration questionnaire. Finally we analyzed and organized data from the socioeconomic questionnaire in tables and graphs. 2.6. Ethical and legal aspects The present study was approved by ethical committee in research of Health Science Center of Federal University of Pernambuco (UFPE), with Certificate of Appreciation for Ethics Presentation (CAAE) number 15142513.3.0000.5208. This research respected the aspects of voluntariness and confidentiality of participants. 3. Results
2.4. Debriefing After the completion of the study case, we applied a questionnaire where participants respond which their opinion regarding the performance of tasks with the prototype information visualization. Each question is related to one ergonomic criterion as shows in Table 2. For each question, participants rated frequency on a 5 point Likert-type scale (1 = never, 5 = frequently). As soon the participants finish the usability questionnaire, they described orally the problems occurred during the task and/or suggestions to the improvement of the 3D interface. For each problem and/or suggestion, the participants rated the severity on: 1 – Cosmetic; 2 – Simple; 3 – Severe; 4 – Urgent. Table 2 Usability questionnaire based on ergonomic criteria of Bastien and Scapin (1993). Nr.
Questions
Ergonomic criterion
01
The objects in the environment with similar variables are properly grouped with their visual features (color, shape, etc.)? The interactivity menu is properly highlighted and easily identified? The different elements in the interface (objects, buttons and informations) are easily distinguishable? Titles or important information are highlighted, either with another color, font or style resources?
Group
02 03
04
05 06 07
08
09 10 11
12 13 14 15
A help button is always present / available? After consulting the help, was able to continue performing the desired task successfully? The objects are positioned one on top of other?
The interface uses realism characteristics such as texture and transparency to facilitate the visualization? The information and objects are legible? The selected objects are highlighted? Are constantly provided to the user information about what is being processed, as well as where it is? All details about the object information available are displayed on the screen? The names of the options available in the environment briefly demonstrate its function? Is there any step unnecessary or redundant during the interactivity of the task? The environment presents only information relevant to the task?
Prompting Grouping/ Distinction by Format Grouping/ Distinction by Format Help Help Grouping/ Distinction by Location Legibility
Legibility Legibility Feedback immediate Concision Concision Minimal Actions Information Density
In this session we described and analyzed the survey results and presented considering the following order: population characteristics, usability evaluation and usability problems. 3.1. Usability evaluation After the participants answered the usability questionnaire, we linked each questions with the Bastien and Scapin (1993). The results of usability analyze is showed in the graph of the Table 3. According to Table 3, most of participants (77.78%) answered the criterion related to question 1 (grouping) as frequently, showing that the 3D environment groups frequently the objects with similar variables with their visual features (color, shape, others) in the environment. Only 48.15% participants pointed the criterion related to question 2 (prompting) as frequently, meaning that less than half of participants think that the interactivity menu is not properly highlighted and easily identified. Approximately 44.45% participants choose the third criterion related to questions 3, 4 and 7 (distinction by format or by location) as frequently. This percentage shows that less than half of participants do not distingue the object by location or format frequently in the 3D environment. 87.04% participants pointed the criterion related to question 5 and 6 (help) as frequently, meaning that the most of participants think that the help is frequently present/available or after consulting the help, it was able to continue performing the desired task successfully. The fifth criterion analyzed is related to legibility (questions 8, 9 and 10). About 64% participants answered this criterion as frequently, meaning that more than half of participants agree that objects in the 3D environment are legible and the interface uses realism characteristics such as texture and transparency to facilitate visualization. In relation to Feedback immediate criterion (question 11), 40.74% participants answered that the 3D environment are constantly providing the user information about what is being processed, as well as where it is. The seventh criterion analyzed is related to concision (questions 12 and 13). The result to this criterion was observed in 66.67% of participants. This means that 3D environment shows all information about the object clearly and concise on the interface. In relation to the minimal actions criterion (question 14), around 40% of the participants answered that 3D environment has not unnecessary or redundant during the interactivity of the task. The last criterion is related to information density (questions 15) and 70.37% of participants enrolled agree that the 3D environment presents only information relevant to the task.
630
A.S. Campos Filho et al. / Computers in Human Behavior 49 (2015) 623–634
Table 3 Results of usability based on ergonomic criteria of Bastien and Scapin (1993). Questions The objects in the environment with similar variables are properly grouped with their visual features (color, shape, etc.)? The interactivity menu is properly highlighted and easily identified? The different elements in the interface (objects, buttons and informations) are easily distinguishable? Titles or important information are highlighted, either with another color, font or style resources? A help button is always present/available? After consulting the help, was able to continue performing the desired task successfully? The objects are positioned one on top of other? The interface uses realism characteristics such as texture and transparency to facilitate the visualization? The information and objects are legible? The selected objects are highlighted? Are constantly provided to the user information about what is being processed, as well as where it is? All details about the object information available are displayed on the screen? The names of the options available in the environment briefly demonstrate its function? Is there any step unnecessary or redundant during the interactivity of the task? The environment presents only information relevant to the task?
3.2. Usability problems Although the prototype has several limitations concerning performance and bugs, we evaluated only the usability aspects of interface. The participants reported a total of 18 usability problems and proposed 35 suggestions to improve the interactivity of 3D environment. According to the instruments used to measure the degree of importance of usability problems, most of them has cosmetic severity (18.52%) and single (55.56%). Below we describe the usability problems with grave severity (3.70%) and urgent (22.22%) and their solutions for better usability of 3D interface. All the problems and recommendations described by the users in the usability evaluation can be viewed in Figs. 8 and 9 and listed below:
Never (%)
Rarely (%)
3.70
0.00
0.00 0.00
Sometimes (%)
Several times (%)
Frequently (%)
3.70
14.81
77.78
3.70 0.00
18.52 22.22
29.63 25.93
48.15 51.85
0.00 0.00 0.00 14.81 0.00
3.70 0.00 0.00 7.41 0.00
14.81 3.70 0.00 18.52 11.11
40.74 3.70 18.52 18.52 33.33
40.74 92.59 81.48 40.74 55.56
0.00 3.70 11.11
0.00 0.00 3.70
7.41 0.00 7.41
40.74 11.11 37.04
51.85 85.19 40.74
0.00 0.00 40.74 0.00
0.00 0.00 33.33 3.70
7.41 7.41 11.11 3.70
29.63 22.22 7.41 22.22
62.96 70.37 7.41 70.37
1. Problem: The axis names are not visible when the visualization was started. Recommendations: When the 3D environment initialize, the 3D graph can be positioned in the center of the interface. 2. Problem: The information panel describe only quantitative variable (x, y, z and size) and not describe the qualitative variable (form and color). Recommendations: To insert the qualitative variable (form and color) in the information panel. 3. Problem: In the interactivity menu, there are a lot of expanded panels increasing the density of information in the menu. Recommendations: When the 3D environment initialize, all panel can be retracted and available when the user select a specific one.
Fig. 8. Problems of 3D environment found in the usability test.
A.S. Campos Filho et al. / Computers in Human Behavior 49 (2015) 623–634
631
Fig. 9. Problems of 3D environment found in the usability test – control panel.
4. Problem: There are scroll bars in each expanded panel inside the menu confusing the user in manipulating the panel. Recommendations: Each panel could be independent from menu and the user could enable or disable the visualization specific panel. 5. Problem: For this 3D environment it is necessary that the users have previous graphical and mathematical knowledge. Recommendations: this problem is related to the lack of prior knowledge in geometry and graphs and has no suggestion to improve the usability. 6. Problem: When the users will choose the indicators in the configuration panel, the background color of the checkbox is similar with the background color of the configuration panel making difficult the choice of the indicator. Recommendations: To change the background color of the checkbox or to highlight it to differentiate from the background color of the configuration panel. 7. Problem: The font size of the text in the interactivity menu is too small. Recommendations: Insert a button that increase or decrease the font size of the text. 8. Problem: The menu button is small and is hidden making difficult its visualization. Recommendations: Change the layout (color, font and form) of menu button to be highlight. 9. Problem: The large amount of object name text in the 3D graphic when the environment initialize. Recommendations: When the user disable (hide) the name of the objects in the 3D graphic, we could change the label of object to its ordered number in each object and appear a panel with an ordered number list with its respective text of object name. Apart from the recommendations, participants proposed changes to improve the 3D environment:
1. The visualization of the 3D environment will be better when displayed on a bigger screen. 2. The option of showing names of objects in the interactive menu should no be default. 3. In the section ‘‘filter axis’’ inside the menu, could have the option to enter the filter number desired because sometimes the mouse is not so precise. 4. The section ‘‘visualization options’’ should display only the controls settings. The variable setting section could be static in another location on the screen. 5. In the panel ‘‘visualization options’’ could have an option to transform the 3D graph in 2D according to user needs. 6. It would be recommended to dispose a reset button to reset the actual state of parameters in the filter sections. 7. The filters should be accessible in the form of pop up triggered by a click on the axes. 8. In the choice panel to quantitative and qualitative variables, the variable in the checklist could be visualized in alphabetical order. 9. Put the axes name x, y and z in the 3D graphic. These suggestions demonstrate that participants have different knowledge and skills, different preferences about how to visualize the indicators for meaningful purpose and have different information needs.
4. Discussion This research reports the design of a new 3D technique of visualization information. The study aimed to develop a new 3D conceptual model and its usability evaluation. A hybrid method was used to facilitate quantitative and qualitative feedback about
632
A.S. Campos Filho et al. / Computers in Human Behavior 49 (2015) 623–634
users experience, their opinions and preferences regarding the use of the application manipulating Telehealth data. The study helped to identify important guidelines for the development of 3D information visualization applications. The insight acquired during the evaluation of the prototype helped us to develop a second version of the prototype that is more stable and easier to use. The evaluation results showed that there was a large impact on the analysis and interpretation of multivariate data. Different stakeholders can use this refined model to analyze and monitor service quality indicators. The recordings of the participants’ interactions with the 3D environment showed that they had limited experience to visualize data on 3D graphic but had more ability in using 2D interface like windows, icons, menus, pointer (WIMP). This fact was observed because when the 3D visualization initializes, most of the participants preferred to use the 2D menu to manipulate the data than directly using the 3D graphic. Another concern observed in the previous experiment was the experience time required for the participant to get acquainted to the visualization interface. In most of cases, participants took more time in completion the first task than others. When participants were realizing the last task, they were more acquainted to 3D environment and they reported that it is easier to interact with the 3D environment. 4.1. About the framework design process The objective of the framework is to abstract the differences between the visualization of multivariate data in multidimensional interfaces, and focus on common interface elements. Our framework encompasses principles of 3D visualization techniques, user-centered design approach and cognitive theory to guide the design of its conceptual model. It allows the management and monitoring of indicators on the web. The result contributes to the field of visualization, providing the basis for increasing the use of modular visualization techniques. Several attempts have been made to achieve this goal as reported by Santos (2004). The design of the framework required the knowledge about the work context in which the systems will be applied. It should involve user input at all stages, as is the practice in any effort of user-centered design. Users had important roles in the development of the framework. They had different needs and expressed distinct points of view, maybe because they are from different areas, including: medicine, nursing, computer science, education and statistics. An understanding of the needs of users is essential to ensure that the technology is appropriate, functional and will be useful to complete the tasks (Bowen & Reeves, 2007). We observed that the framework presented in this paper could also be adapted to the combination of 2D technical and WIMP elements with 3D techniques in the same interface in a simple and effective way. The framework allowed the development of a 3D visualization interface avoiding confusion through a clear concept of navigation, minimizing visual pollution by grouping the edges and allowing the user to manage many visions according to the need. The implementation of the framework and the 3D prototype on a web-based context improved the access and performance of the system. It has a positive effect, even for many types of visualization techniques and large data sets used. It was also observed that the current implementation of the framework allowed managing a small number of fixed visualization techniques. It is therefore necessary to develop a method that can handle a larger number of visualization techniques to problems of larger scale. The visualization of multiple relationships using various visualization techniques, as described in Collins and Carpendale (2007), requires additional methods to avoid visual pollution.
4.2. 3D interface guidelines The development of the framework with the use of 3D techniques to data visualization remains a challenge and demands further investigation. In the literature, there is little guidance for the design of visualization systems with 3D techniques such as what we proposed. In this direction, Bochicchio et al. (2011) validated the use of a 3-tier architecture used in applications with 3D techniques. Furthermore, it is important to use real data both to engage users as well as to help them learn about the nature of the 3D techniques. Currently, the design of the framework still contains some restrictions and faults that can be revised, restructured and improved along the continuation of this research. 4.3. Users Motivation in performing the prototype It was observed through the comments and reactions of the users during the performance of the tasks that, although users have no or minimal ability to manipulate the mouse in a 3D environment, there was a strong motivation and interest among them in both samples to use the prototype. The phenomenon of motivation through the emergence of a new feature has been proven in the literature by other authors (Adelman & Taylor, 2012; Hullman et al., 2011; Seipel & Carvalho, 2012). According to Seipel and Carvalho (2012), most of the participants of their experiment (83%) felt more confident in performing 3D technique that 2D (17%), though almost half of the population felt visual discomfort in 3D. These results confirm what appears to be a prevalent overestimated the actual benefits of three-dimensional visualization. Furthermore, results from the case study showed that one hundred percent of the participants agreed that the visualization of the indicators in a 3D environment would be extremely relevant, because they could simultaneously view and analyze six different indicators in the same interface through graphical properties as x, y, z, size, form and color. Participants said it was easier to identify the object or to gain insights about the data analyzed when the categories of information are grouped by form or color. 4.4. Usability of the 3D visualization prototype We noted that users expressed some difficulties interpreting the issues of tasks, had limitations in how they analyzed the data and lack of ability to properly analyze the data so that the most important data were not chosen on time to be done appropriate interventions. This phenomenon was due to the majority of users did not have the ability to analyze issues with multivariate data. These limitations can influence the quality of the analyzed results. Concerning the usability of the prototype, most of the problems encountered had simple or cosmetics severity, which demonstrated that the prototype despite being complex, it is very useful and easy to use. However, at some moments it was observed that some participants had difficulties with the use of the interface and needed the support of another person to continue to use it and to end the task. Through all the usability problems reported during the study, it became clear that the prototype still has a lot to improve. In addition, the usability evaluation of user provided feedback necessary modifications to make the system even easier to use. The set of ergonomic criteria used in the assessment showed various aspects of functionality and layout, which hindered the usability of the prototype that have not hitherto been detected. However, the prototype should be improved through the profound interpretation of the problems encountered and implementation of the suggestions reported by participants. After the redesign of the prototype, another research study on usability evaluation is
A.S. Campos Filho et al. / Computers in Human Behavior 49 (2015) 623–634
necessary because this study was part of the first interaction of the user centered design cycle. 4.5. Orientation difficulties with 3D information visualization technique Although the results showed an increased preference of the participants for the use of 3D technology, it was observed that the participants were spatially disoriented when using it. Maybe caused by the lack of navigations skills to deal with 3D techniques. They could, in most cases, prefer to interact only with the 2D menu other than in 3D graphics to view data. This phenomenon may have origin in the participants familiarity in using 2D systems and interfaces, and also maybe because participants do not have a previously suitable experience dealing with 3D information visualization technique. As described in the usability evaluation results, we noted that 50% of participants were spatially disoriented, maybe caused by the lack of prior knowledge in geometry and graphs. Another aspect observed was that participants had not the domain knowledge of how to interpret the content of the task and presented difficulties in identifying the indicators or in organizing the correct sequence of indicators to perform the task. These kinds of errors can occur with any type of visualization system thus it is related to the understanding of the task and its contents and not the resolution by itself. These facts above can influence the opinion of the system usability (Chen, 2005). 4.6. Aesthetics During the experiment, we noted that the aesthetics of the system have not specifically a good design layout. Participants reported problems related to poor interface design and layout such as: fonts of the texts were small, the buttons have not highlights or are hidden, and the menu with multiple panels increased the information density of the overall interface. When the prototype was developed, we are concern in developing a useful 3D environment that supports decision-making, which means that data representation should be understandable by end-users and help them to make decisions insight to the user and not only a pretty interface. However, according to Chen (2005), it’s important to understand how insights and aesthetics interact, and how these two aspects could sustain insightful and visually understandable information visualization. He said that the graph-drawing community has done the most advanced research in relation to the aesthetics problem. Furthermore, aesthetic is often seen as an add-on, implemented at the very end of the development process (Cawthon & Moere, 2007). 4.7. Occlusion problems Finally, we also realized that the presented technique effectively reduces the data occlusion problem provoked by various focus frames. Some of the participants reported difficulty to visualize large-scale data in traditional visualization techniques. Maybe, it is produced by the occlusions of objects representations. In this concern, they report that with 3D environment this problem was solved. It is possible to rotate the 3D graphic or to make invisible the object that is occluding another. 5. Conclusion In this paper, we presented a new approach to develop of 3D and interactive visualization techniques in a web-based system. The conceptual model was evaluated in the context of
633
decision-making in specific domains. The 3D environment is the first interactive tool to visualize and monitor indicators of service in social network. It presents high dimensional variables through a principled visualization design and provides well-integrated interaction techniques to facilitate effective data exploration, education and planning. Currently, the 3D visualization technique proposed is most effective when visualizing a small number of data. The interpretation of data visualization typically become more difficult as the dataset grows. There are several other interactive visualization solutions to aid in this situation or an appropriate dimensionality reduction technique could also be used to handle large dimensional data. We plan to adjust the right mechanism to support more complex dataset. Although this study has several limitations related to performance and software patches, the results described above provide a basis to believe that 3D environments contributes to improve the identification of patterns, visual perception and understanding in the search of specific information by reducing the search time and cognitive load of awareness. However, the analysis of usability also shows that many usability problems of the visualization interface. It should be fine tuned in order to become easier to use. The next phase of this research will be the evaluation of mental workload of the users in performing tasks through the 3D environment. As future contributions for the usability and improvement of the 3D environment, we suggest the implementation of optical sensors which allow the manipulation of 3D objects through Gesture Recognition. This new technology aims to achieve dynamic human–computer interactions without requiring physical contact based input device (Zaman, 2012) and can capture a natural and intuitive form of interaction between humans and machines has brought about the wide focus on gesture recognition that the mouse and keyboard usually cannot. The benefits of this new technology is especially from the increasing accuracy and robustness of 3D sensors (Khoshelham & Elberink, 2012; Weichert, Bachmann, Rudak, & Fisseler, 2013). Beyond the 3D environment will support the service manager to verify the quality of service toward the features provided by 3D environment, especially its capability to identify trends, clusters of interest, and perform indicators comparison. Funding The research of this paper was funded by the CNPq (Grant INCT nos. 15/2008, 310466/2012-1 and 475634/2013-6) and FAPESP. Acknowledgments This research would not have been possible without the support from the Informatics Center of Federal University of Pernambuco, Telehealth Center (NUTES), and The National Science and Technology Institute in Child and Adolescence Developmental Psychiatry (INPD). References Adelman, H. S., & Taylor, L. (2012). Student engagement and disengagement: An intrinsic motivation perspective and a mental health concern. In J. Waller (Ed.), Mental health promotion in schools. Sharjah, UAE: Benthem Science. Alfons, A., Templ, M. & Filzmoser, P. (2009). State-of-the-art and recent developments in visualisation of missing values and indicators. In Talk: 3rd AMELI meeting, Olten (invited). Amar, R., Eagan, J. & Stasko, J. (2005). Low-level components of analytic activity in information visualization. In Proceedings of the symposium on information visualization (InfoVis ’05) (pp. 111–117). Bach, C. & Scapin, D. L. (2003). Adaptation of ergonomic criteria to human-virtual environments interactions. In INTERACT 2003 (pp. 880–883). IOS Press.
634
A.S. Campos Filho et al. / Computers in Human Behavior 49 (2015) 623–634
Barzargan, K., Falquet, G. & Metral, C. (2010). Testing the usability of information visualization techniques in interactive 3D virtual environments: A toolkit. atherine Blashki. In Proceedings of IADIS international conference interfaces and human computer interaction (pp. 11–18). Freiburg, Germany, 28–30 juillet 2010. IADIS Press. Bastien, J. M. C. & Scapin, D. L. (1993). Human factors criteria, principles, and recommendations for HCI: Methodological and standardisation issues. (Internal Report). INRIA. Bochicchio, M. A., Longo, A. & Vaira, L. (2011). Extending web applications with 3D features. In Proceeding of 13th IEEE international symposium on web systems evolution (WSE) (pp. 93–96). Borchers, J. A. (2000). Pattern approach to interaction design. In Proceedings of the international conference on designing interactive systems (pp. 369–378). ACM Press. Bowen, J., & Reeves, S. (2007). Formal models for informal GUI designs. Electronic Notes in Theoretical Computer Science, 183, 57–72. Campos Filho, A. S., Freitas, F., Gomes, A. S. & Vitorino, J. (2012). Brandmap: An information visualization platform for brand association in blogosphere. In 16th international conference information visualisation, Montpellier. IV2012: SMA – Social Media Analytics. Campos Filho, A. S., Gomes, A. S. & Novaes, M. A. (2012). Technique for 3D information visualization for health information systems. In AMIA 2012 annual symposium, Chicago. AMIA 2012 annual symposium. Campos Filho, A. S., Gomes, A. S. & Novaes, M. A. (2013). 3D visualization environment for analysis of Telehealth indicators in public health. In 14th world congress on medical and health informatics – MedInfo, Copenhagen. Proceedings of the 14th world congress on medical and health informatics (Vol. 192, pp. 1152– 1152). Card, S., Mackinlay, J. & Shneiderman, B. (1999). Readings in information visualization: Using vision to think. Kauf-Mann-Elsevier. Cawthon, N. & Moere, A. V. (2007). The effect of aesthetic on the usability of data visualization. Information visualization. IV ‘07. 11th international conference (Vol., no., pp. 637–648, 4–6). Chakraborty, G. (2014). Analysis of unstructured data: Applications of text analytics and sentiment mining. In SAS global forum (pp. 1288–2014). Washington, DC. Chen, C. (2005). Top 10 unsolved information visualization problems. IEEE Computer Graphics and Applications, 25(4), 12–16. Retrieved 25.10.13. Chen, C. (2006). Information visualization: Beyond the horizon (2nd ed.). Springer. Chipman, S. F., Schraagen, J. M., & Shalin, V. L. (2000). Introduction to cognitive task analysis. In J. M. Schraagen, S. F. Chipman, & V. J. Shute (Eds.), Cognitive task analysis (pp. 3–23). Mahwah, NJ: Lawrence Erlbaum Associates. Clark, R. E., Feldon, D., Van Merrienboer, J. J. G., Yates, K., & Early, S. (2008). Cognitive task analysis. In J. M. Spector, M. D. Merrill, J. J. G. VanMerrienboer, & M. P. Driscoll (Eds.), Handbook of research of Educational Communications and Technology (3rd ed.. Mahwah, NJ: Lawrence Erlbaum Associates. Collins, C., & Carpendale, S. (2007). Vislink: Revealing relationships amongst visualizations. IEEE Transactions on Visualization and Computer Graphics, 13(6), 1192–1199. Cvek, U., Trutschl, M., Kilgore, P. C., Stone, R., & Clifford, J. L. (2011). Multidimensional visualization techniques for microarray data. In 15th international conference on information visualisation. Forsell, C. & Johansson, J. (2010). An heuristic set for evaluation in information visualization. In Giuseppe Santucci (Ed.), Proceedings of the international conference on advanced visual interfaces (AVI ‘10) (pp. 199–206). ACM, New York, NY, USA. http://dx.doi.org/10.1145/1842993.1843029. Freitas, C. M. D. S., Luzzardi, P. R. G., Cava, R. A., Winckler, M. A. A., Pimenta, M. S., & Nedel, L. P. (2002). Evaluating usability of information visualization techniques. In Proceedings of IHC 2002–5th workshop on human factors in computer system (pp. 40–51). Brazil. SBC/UFCe. Hoashi, K., Hamawaki, S., Ishizaki, H., Takishima, Y., & Katto, J. (2009). Usability evaluation of visualization interfaces for content-based music retrieval systems. In 10th international society for music information retrieval conference (pp. 207– 212). Hullman, J., Adar, E., & Shah, P. (2011). Benefitting InfoVis with visual difficulties. IEEE Transactions on Visualization and Computer Graphics, 213–2222.
Irani, P., & Ware, C. (2003). Diagramming information structures using 3d perceptual primitives. ACM Transactions on Computer-Human Interaction, 10(1), 1–19. Kantardzic, M. (2011). Data mining: Concepts, models, methods, and algorithms, the textbook. IEEE Press & John Wiley (First edition, November 2002; Second Edition, August. Keim, D. A. (2002). Information visualization and visual data mining. IEEE Transactions on Visualization and Computer Graphics, 8. Khoshelham, K., & Elberink, S. O. (2012). Accuracy and resolution of kinect depth data for indoor mapping applications. Sensors, 12, 1437–1454. Komlodi, A., Hercegfi, K., Jozsa, E. & Koles, M. (2012). Human-information interaction in 3d immersive virtual environments. In CogInfoCom 2012 – 3rd IEEE international conference on cognitive infocommunications, Kosice, Slovakia, 2012 Dec 2-5. Proc. (pp. 597–600). Disponível em: . Malczewski, J. A. (2006). GIS-based multicriteria decision analysis: A survey of the literature. International Journal of Geo-graphical Information Science, 20(7), 703–726. Mao, J. Y., Vredenburg, K., Smith, P. W., & Carey, T. (2005). The state of user-centered design practice. Communications of the ACM, 48(3), 105–109. Nielsen, J. (1993). Usability 101: Introduction to usability. Nielsen Norman Group 2012. http://www.nngroup.com/articles/usability-101-introduction-to-usability/ Access in: Fevereiro de 2014. Prates, R. O., & Barbosa, S. D. J. (2003). Avaliação de interfaces de usuário – Conceitos e métodos. Anais da Jornada de Atualização em Informática – XIX Congresso da Sociedade Brasileira de Computação. Rester, M., Pohl, M., Hinum, K., Miksch, S., Ohmann, S., Popow, C., et al. (2005). Assessing the usability of an interactive information visualization method as the first step of a sustainable evaluation. In Usability symposium: Empowering software quality: How can usability engineering reach these goals? 1st usability symposium, HCI&UE workgroup (Vol. 198). Austrian Computer Society (OCG), Vienna. ISBN: 3-85403-198-x; S. 31–43. Santos, S. R. (2004). A framework for the visualization of multidimensional and multivariate data. PhD thesis, University of Leeds, Reino Unido, Dinsponivel em: . Shneiderman, B. (1998). Designing the User Interface. Strategies for Effective HumanComputer Interaction. Addison-Wesley, Reading, Massachusetts, 523–524. Schwartzman, Y. & Borning, A. (2007). The indicator browser: A web-based interface for visualizing UrbanSim simulation results. In Proceedings of 40th IEEE Hawaii international, conference on system sciences. IEEE Computer Science Society. Seipel, S. & Carvalho, L. (2012). Solving combined geospatial tasks using 2D and 3D bar charts. In 16th international conference on information visualisation (pp. 157– 163). Shamim, A., Balakrishnan, V. & Tahir, M. (2014). Evaluation of opinion visualization techniques. In Information visualization, Access in: . Sharafi, Z. A. (2011). Systematic analysis of software architecture visualization techniques. In proceeding of: The 19th IEEE international conference on program comprehension, ICPC 2011. Kingston, ON, Canada, June 22–24. Sommerville, I. (2011). Software engineering (9th ed.). Pearson Addison Wesley. Taylor-Powell, E., & Steele, S. (1996). Collecting evaluation data: Direct observation. University of Wisconsin Cooperative Extension. . Tufte, E. (2001). The visual display of quantitative information (2nd ed.). Cheshire: Graphics Press. Ware, C. (2012). Information visualization: Perception for design (3rd ed.). Waltham: Morgan Kaufmann. Weichert, F., Bachmann, D., Rudak, B., & Fisseler, D. (2013). Analysis of the accuracy and robustness of the leap motion controller. Sensors (Basel). Zaman, K. R. (2012). Hand gesture recognition: A literature review. International Journal of Artificial Intelligence & Applications, 25, 161–174 [Print]. Zhang, J., & Norman, D. A. (1994). Representations in distributed cognitive tasks. Cognitive Science, 18, 87–122.