Proceedings of the Fourth International Partners in Flight Conference: Tundra to Tropics 617–632
OCCUPANCY MODELING AS A FRAMEWORK FOR DESIGNING AVIAN MONITORING PROGRAMS: A CASE STUDY ALONG APPALACHIAN STREAMS IN SOUTHERN WEST VIRGINIA BRADY J. MATTSSON1,3 AND MATTHEW R. MARSHALL2 1
Warnell School of Forestry and Natural Resources, University of Georgia, Athens, Georgia 30606, USA; and 2 National Park Service, 403 Forest Resources Building, University Park, Pennsylvania 16802, USA Abstract. Avian monitoring is a regular component of long-term programs that evaluate changes in ecological integrity following natural and anthropogenic disturbance. While bird species or guilds can serve as cost-effective indicators of such changes, accounting for imperfect detection of birds in avian monitoring programs remains a challenge. Indeed, few studies have accounted for detectability while estimating bird occupancy and abundance. We used an information-theoretic approach to model species- and guild-specific occupancy (ψ) and detection probabilities (p), based on bird surveys along streams in two national parks of southern West Virginia. A species-specific occupancy model was much more parsimonious than a guild-specific occupancy model, which was in turn much more parsimonious than one that assumed all species were distributed equally across the study areas. Detectability varied among guilds and species within guilds, visit occasions, observers, and stream noise levels. Even while accounting for low detectability (pˆ < 30%), predicted occupancy was low for some species (ψˆ < 35%). Other species, though, had high detectability (pˆ > 65%) and high occupancy (ψˆ ≥ 90%). Species with detection probabilities above 30% (to better ensure accurate occupancy estimates given our study design) represented all of the open-cup-nesting, forest-interior songbird guilds, and these are therefore good candidate indicators for a long-term monitoring program aimed at identifying annual changes in occupancy. The occupancy modeling approach provides a robust, extensible framework for long-term monitoring of individual bird species and entire communities, which can be linked to other measures of ecosystem integrity. Key Words: avian monitoring, detectability, forest songbirds, modeling, occupancy, species turnover.
MODELOS DE PRESENCIA COMO UNA ESTRUCTURA PARA DESENAR PROGRAMAS DE MONITOREO DE AVES: UN ESTUDIO EJEMPLAR DESDE LAS QUEBRADAS EN APPALACHIA EN EL SUR DE W. VIRGINIA
Resumen. El monitoreo de aves es un componente regular de programas al largo plazo que evalúan cambios en la integridad ecológica después de perturbación natural o antropogenica. Aunque especies o grupos de aves pueden servir como indicadores rentables de estos tipos de cambios, tomando en cuenta que la detección de aves es imperfecto todavía representa un reto para programas de monitoreo de aves. Es más, pocos estudios han tomado en cuenta la detección de un ave cuando estimando la presencia o abundancia de aves. Usamos una aplicación información-teórica para modelar una especie especifica y grupo especifica presencia (ψ) y índice de detección (p), basado en estudios de aves por dos quebradas adentro de dos diferentes parques nacionales en el sur de W. Virginia. El modelo de presencia especie-especifica fue mas parsimonious que el modelo de presencia grupoespecifica, lo cual fue mucho mas parsimonious sobre un modelo que asumió que todos los especies estaban distribuido igualmente sobre el área del estudio. La detección fue variable entre grupos y diferentes especies en grupos, entre visitas, entre los observadores, y entre niveles de ruido desde las quebradas. Con tomando en cuenta la detección muy baja de algunas especies (pˆ < 30%), la presencia pronosticada fue muy bajo por algunos especies (ψˆ < 35%). Otras especies, sin embargo, tuvieron altos índices de detección (pˆ > 65%) y alta presencia pronosticada (ψˆ ≥ 90%). Los especies con índices de detección sobre 30% (para garantizar mejor una presencia pronosticada precisa para nuestro estudio) representaron todos los grupos de aves que construyen nidos abiertos y prefieren la interior del bosque y ellos pueden ser buenos candidatos para ser especies indicadores de un programa de monitoreo al largo plazo con metas de identificar cambios anuales en presencia. La aplicación de
3
E-mail:
[email protected]
618
Proceedings of the Fourth International Partners in Flight Conference modelar presencia provee una estructura robusta para monitoreo al largo plazo de especies de aves y comunidades, lo cual puede ser conectado a otras medidas sobre la integridad de ecosistemas.
INTRODUCTION Extensive changes in climate and land use during the past century have spurred several programs that monitor changes over time in particular elements of ecosystem integrity (for review see Danielsen et al. 2005). Avian-monitoring efforts are a common part of such programs (e.g., Rosenberg et al. 1999; Greenwood 2003; Sauer et al. 2008), as birds serve as cost-effective indicators of ecosystem condition due to their relative conspicuousness and responsiveness to ecological gradients (Roberge and Angelstam 2006). In particular, measuring the variation in spatial distributions and changes over time of specific bird species or guilds (henceforth, birds) can serve as a cost-effective means of assessing influences of coarser-scale, landscape-level conditions, including the extent of forest (O’Connell et al. 2000) and intensity of acidic deposition (Hames et al. 2002). Furthermore, birds can serve as indicators of finer-scale, habitat-specific conditions, including forest structure and composition (O’Connell et al. 2000). Forest-dwelling bird species, for example, can be divided into three broad habitat guilds: generalist, forest-interior specialists, and synanthropic. Here, we focus on the latter two groups as indicators of forest conditions. The forest-interior guild can be further divided into patch-scale habitat-association and nestplacement guilds. In forests of eastern U.S. and Canada, ground-nesting species such as Ovenbird (Seiurus aurocapillus) are found most commonly in forest stands with a high proportion of hardwoods (Van Horn and Donovan. 1994). In contrast, canopy-nesting species such as Blue-headed Vireo (Vireo solitarius) are found more consistently in stands dominated by evergreen than those dominated by deciduous or hardwood tree species (James 1998; Ross et al. 2004). Finally, understory-nesting species such as Hooded Warbler (Wilsonia citrina) are found most often in older forests that include a dense woody understory (Heltzel and Leberg 2006; Greenberg et al. 2007), and as such can serve as cost-effective indicators of vertical structure. In contrast to forest-interior birds, synanthropic species such as Brown-headed Cowbirds (Molothrus ater) are found more often in stands that are near lawns or other fields (Evans and Gates 1997; Howell et al. 2007). Therefore, monitoring spatial and temporal patterns in the distribution (i.e., use, occupancy, and/or
abundance) of select forest bird species (i.e., indicator species) that are known to respond to landscape and patch-scale changes can serve as indicators of forest conditions. A great challenge to identifying such patterns in avian communities is that observers often fail to detect certain birds, even though they are present in a forest stand. Such detection failures can lead to underestimation of occupancy and/ or abundance, or at worst can lead to mistaken inferences about shifts in distribution that are simply driven by changes in detectability (Kery and Schmid 2004; MacKenzie 2005). Raw numbers of birds detected, therefore, are often poor representations of the actual bird community particularly when comparing species with variable detectability. Following Johnson (2008), the detection process during an avian survey can be divided into two pieces, including: 1) availability—whether birds are within the count radius and vocalizing or visible at least once during count period, and 2) perceptibility—whether an observer is capable of detecting birds available for detection given the observer skill level, proximate bird cues, and/or environmental conditions. Proximate bird cues that could affect perceptibility include singing rates, singing volume, perch height, and number and distribution of individuals surrounding the survey point. Environmental conditions that may interact with bird cues or affect perceptibility directly include topography, background noise, and vegetation structure. Passerines and other vocal landbirds are typically most available for detection during the breeding season while establishing territories and courtship (Ralph 1981; Selmi and Boulinier 2003). Vocalization frequency for many species declines upon the onset of incubation and may increase again during the care of young just before and after fledging (Gottlander 1987; Welling et al. 1995; Poole 2005). Surveys should be conducted when birds are expected to be most available for detection and in such a manner that differences in perceptibility are minimized or at least quantified. Acknowledging the differences between availability and perceptibility is important when drawing inferences from studies that report measures of distribution, such as occupancy or abundance. For example, abundance estimates that account for differences in detection probabilities among observers and among environmental conditions during single visits to survey locations may still underestimate true
Occupancy Modeling For Avian Monitoring—Mattsson and Marshall abundance by assuming that all birds were available for detection during the counts (Johnson 2008). Conducting repeat visits at survey locations, however, provides a means by which to account for birds that were unavailable during a particular visit (MacKenzie et al. 2002; Royle and Nichols 2003). In particular, data from survey locations where birds were detected at least once are used to estimate detection probability, which is the product of imperfect availability and imperfect perceptibility. These detection estimates are then used to correct the proportion of sites where birds were detected, yielding an estimate of actual abundance or occupancy. To our knowledge, only three studies have reported the distribution and abundance of multiple bird species simultaneously while accounting for species-specific detectability. These studies used software packages that are readily available and are well suited to addressing the estimation problem. First, Dorazio et al. (2006) used WinBUGS (Spiegelhalter et al. 2003) to estimate species richness and site occupancy of individual species detected along a Breeding Bird Survey route in Alabama. Second, Kery and Royle (2008) used WinBUGS to extend the aforementioned multi-species site-occupancy model to incorporate hierarchical structure in the data. Finally, Alldredge et al. (2007a) used programs SURVIV (White 1983), DISTANCE (Thomas et al. 2006), and MARK (White and Burnham 1999) to model relative densities of bird species detected during point count surveys in Great Smokey Mountains National Park. In addition to modeling density, Program MARK is also well suited to estimate occupancy probabilities for multiple species simultaneously while accounting for imperfect detection of these species (Mackenzie et al. 2005). We present an application of the ‘Occupancy’ data type in program MARK to estimate occupancy and detection probabilities for a suite of putative indicator species and guilds detected along streams in two national parks of southern West Virginia. Our objective is to model the relative distribution of species and guilds of the streamside bird community while taking into account sources of imperfect detectability to guide the development of an avian monitoring program. To model detection, we used information about observers, stream noise, bird species, guild membership, and visit occasion. METHODS STUDY AREAS Data were collected during spring of 2007 in two national parks of southern West Virginia
619
(New River Gorge National River and Gauley River National Recreation Area; henceforth, parks) (Fig. 1). These parks are situated in the Appalachian Mountains and are part of the Eastern Rivers and Mountains Network (ERMN), one of 32 ecoregional networks organized by the National Park Service where routine ecological monitoring takes place (Marshall and Piekielek 2007). The streamside bird monitoring program is one element of the larger ecological monitoring effort in the ERMN (Mattsson and Cooper unpubl. report; Marshall and Piekielek 2007). These parks surround segments of large rivers and their tributary stream network, which are characterized by closed-canopy forest dominated by deciduous hardwood trees (i.e., Quercus spp., Carya spp., Acer saccharum, Liriodendron tulipifera, Tilia americana, Aesculus flava, Betula lenta) and, along most streams, eastern hemlock (Tsuga canadensis; Vanderhorst et al. 2007). The understory includes saplings and seedlings of overstory trees, flowering dogwood (Cornus florida), other native deciduous shrubs, and patches of great laurel (Rhododendron maximum) and, along some streams, the introduced Japanese knotweed (Polygonum cuspidatum). Land cover within the watersheds of these streams is dominated by second-growth forest. Low densities of human habitation exist within park inholdings and just outside the federally authorized boundary. The forests have been logged and/or mined intensively during the past century, resulting in an evenaged forest structure. Modern, direct disturbance by humans along streams of these parks, aside from occasional hikers and anglers, are minimal to absent. Disturbances of ongoing concern in these watersheds include invasions by the hemlock wooly adelgid (Adelges tsugae) and stream pollution and erosion from failing septic tanks, scouring and sedimentation from upstream development, and acid and nutrient deposition. Suburban development in portions of park watersheds just outside federal boundaries continues to occur and is therefore another major impetus for monitoring potential changes in ecological integrity in these watersheds. From a total of 80 candidate tributary watersheds (2nd-3rd order; 1–99.9 km2), 29 were selected for streamside bird monitoring using a stratified randomized approach based on watershed size, topography, geology, and land ownership (B. J. Mattsson, unpubl. report). Some watersheds were excluded from monitoring due to access and safety limitations. Within each selected watershed a single 1-km pointtransect was established (i.e., 5 point count
620
Proceedings of the Fourth International Partners in Flight Conference
FIGURE 1. Point-transects for surveying streamside songbirds in two national parks of southern West Virginia [Gauley River National Recreation Area (GARI) and New River Gorge National River (NERI)].
stations separated by 250 m). Avian surveys occurred at point count stations (see “Pointtransect surveys” section below). Ambient stream noise was a significant impediment to conducting the surveys and was accounted for in two ways. First, point count stations were established 10–20 m upslope and away from the stream. Second, stream noise level was quantified by direct measure (see Pointtransect Surveys below) and included in the analyses. FOCAL SPECIES AND GUILDS Songbird species (henceforth species; orders Passeriformes and Piciformes) were selected for monitoring watershed conditions in the ERMN due to their conspicuousness and demonstrated usefulness as indicators of ecological integrity. These species remain putative indicators of watershed conditions due to the lack of evidence in the ERMN specifically. To our knowledge, there is only one published study (Ross et al. 2004) relating metrics of bird communities to measures of watershed condition in parks of the ERMN. There exists, however, a body of literature that aids in identifying a list of focal species and how they respond to changes in forest ecosystem integrity and for
ascribing each species to a particular habitat guild within the ERMN. In particular, the Birds of North America (Poole 2005) provides life history accounts for all species that occur in forests of the ERMN. O’Connell et al. (2000) provide a more up-to-date literature review about landscape-scale habitat associations for bird species in the Mid-Atlantic Highlands ecoregion, which includes the ERMN. Through this process, we selected 25 focal species for the parks, comprising nine indicator guilds that are expected to respond strongly to modifications within ERMN watersheds (Table 1). First, streambank-nesting riparian obligates are expected to best indicate modifications to the stream itself (O’Connell et al. 2003; Mattsson and Cooper 2006). Second, forest-interior specialists and synanthropic facultative species (henceforth, synanthropic species) are expected to best indicate modifications to landscape-level modifications of forests (O’Connell et al. 2000; Johnston 2001). Following O’Connell et al. (2000), forest-interior specialists are defined as species that 1) increase in density with increasing amount of forest in the landscape, and 2) either A) spend most of their foraging time on the ground, B) winter in the neotropics, or C) nest in tree cavities. Following Johnston (2001) and Poole
621
Occupancy Modeling For Avian Monitoring—Mattsson and Marshall
TABLE 1. FOCAL FOREST SONGBIRD SPECIES AND GUILDS FOR STREAMSIDE SURVEYS IN TWO NATIONAL PARKS IN SOUTHERN WEST VIRGINIA. EXCEPT FOR SYNANTHROPIC SPECIES (JOHNSTON 2001), ALL FOCAL SPECIES ARE ASSOCIATED WITH FOREST INTERIOR (O’CONNELL ET AL. 2000). FOREST-INTERIOR SPECIES ASSIGNED TO HABITAT-ASSOCIATION (I.E., HARDWOOD, HEMLOCK, OR DENSE UNDERSTORY) AND/OR NEST-PLACEMENT (I.E., STREAMBANK, FOREST FLOOR, UNDERSTORY, TREE CAVITY, OR CANOPY) GUILDS BASED ON A LITERATURE REVIEW (POOLE ET AL. 1995; ROSS ET AL. 2004). A DASH (-) INDICATES THAT THE SPECIES WAS NOT ASSIGNED TO A GUILD OR THAT THE SPECIES IS CLASSIFIED AS A FOREST-INTERIOR HABITAT-ASSOCIATION GENERALIST. Common name Synanthropic Red-bellied Woodpecker Common Raven American Crow Blue Jay Brown-headed Cowbird Forest-interior Hairy Woodpecker Pileated Woodpecker Acadian Flycatcher Blue-headed Vireo Red-eyed Vireo White-breasted Nuthatch Winter Wren Black-throated Blue Warbler Black-throated Green Warbler Cerulean Warbler Black-and-White Warbler American Redstart Worm-eating Warbler Swainson’s Warbler Ovenbird Louisiana Waterthrush Kentucky Warbler Hooded Warbler Scarlet Tanager Rose-breasted Grosbeak
Code
Scientific name
RBWO CORA AMCR BLJA BHCO
Melanerpes carolinus Corvus corax Corvus brachyrhynchos Cyanocitta cristata Molothrus ater
HAWO PIWO ACFL BHVI REVI WBNU WIWR BTBW BTNW CERW BAWW AMRE WEWA SWWA OVEN LOWA KEWA HOWA SCTA RBGR
Picoides villosus Dryocopus pileatus Empidonax virescens Vireo solitarius Vireo olivaceus Sitta carolinensis Troglodytes troglodytes Dendroica caerulescens Dendroica virens Dendroica cerulea Mniotilta varia Setophaga ruticilla Helmitheros vermivorus Limnothlypis swainsonii Seiurus aurocapillus Seiurus motacilla Oporornis formosus Wilsonia citrina Piranga olivacea Pheucticus ludovicianus
(1995), forest-associated synanthropic species will use forested landscapes in addition to human-dominated landscapes. Within the forest-interior specialist guild, we assigned species to nest-placement and/or stand-level habitat guilds that further reflect ecological conditions. Nest-placement guilds include streambank, forest floor, understory, tree cavity, and canopy. We defined stand-level habitat guilds based on published differences in occupancy or abundance among habitat types, including hemlock, hardwood, and dense understory. POINT-TRANSECT SURVEYS To ensure that surveys coincided with the end of spring migration and onset of breeding by the focal species, the first visit to each point-transect occurred between May 24 and June 9, 2007, and the second occurred between June 11 and 24, 2007 for a total of 2 29 = 58 transect visit days. We rotated visit days among three observers to account for variation in detectability among observers. During each visit day, an observer
Nestplacement
Habitat association
-
-
Tree cavity Tree cavity Canopy Hemlock Canopy Hemlock Canopy Tree cavity Hardwood Forest floor Understory Canopy Hemlock Canopy Hardwood Forest floor Canopy Hardwood Forest floor Understory Forest floor Hardwood Streambank Forest floor Dense understory Understory Canopy Hardwood Canopy Hardwood
traversed a transect twice (i.e., upstream and downstream) and conducted a 5-minute variableplot point count and measured stream noise at each of the 5 point count stations on both passes along the transect. Each transect therefore had two subsamples within each visit and two visit days, for a total of 4 visit occasions. All surveys were conducted between sunrise and 5 hr after sunrise, which corresponds to the peak period of activity for the focal species. Observers paused for 5 minutes before repeating the point count at the upstream or downstream end of each transect. To measure stream noise, observers used a Radioshack® Digital-Display Sound-Level Meter (Model 33-2055), which measures noise levels ≥ 50 dB. While standing at the point count station, observers aimed the sound meter horizontally in four directions, including upstream downhill, upstream uphill, downstream uphill, and downstream downhill. During point counts, observers recorded the following information for each individual detected: 1) species identity, 2) type of detection (i.e., singing, calling, drumming, or visual), and 3) whether it was first detected within 75 m.
622
Proceedings of the Fourth International Partners in Flight Conference
OCCUPANCY MODELING APPROACH We applied the occupancy model by MacKenzie et al. (2002) to estimate probabilities of transect-scale occupancy and transect-visit detection probabilities simultaneously for individual species of the streamside bird community. In particular, the model requires as input a series of detection histories for each “site”, and in our case a site is a species-transect combination. From the raw count data, we pooled detections across points within transects to generate a detection history for each of the 25 29 = 725 species-transect combinations. Each detection history included k = 4 visit occasions and was comprised of a series of 1’s and 0’s, where each 1 represented a detection of a given species during a given pass along a particular transect. Detections were defined as any visual or auditory signals emitted by focal species within 75 m of the point count station. A detection history where a species was never detected along a particular transect would be “0000,” whereas a detection history where a species was detected during the first and last visit occasions would be “1001”. Therefore, detections were pooled across individuals for each species and across point count stations for each transect pass. Based on these detection histories, a maximumlikelihood estimation procedure was used to estimate two parameters, occupancy (ψ) and detectability (p). By applying a logit-link function, site variables (i.e., species or guild membership) were used to model these parameters. Detectability was modeled for each visit occasion, by visit-occasion variables (e. g., stream noise), by observer, or as a constant across visit occasions. An important assumption of the model is that the system is closed (MacKenzie et al. 2002), in that occupancy remains constant or that there is no net immigration or emigration among visit occasions. In the context of our study, this assumption was likely met, as songbirds were expected to hold breeding territories throughout the survey period. Species-wide departures or arrivals were expected to occur rarely during the study, especially for the more common species. For rarer species with only one territory along a transect, a territory might become unoccupied if the male died. Alternatively, a male may establish a territory after the survey period begins if his former territory became unsuitable. Either of these cases could be considered rare, random events. Another important assumption of the model is that observers identify all species correctly upon detection (MacKenzie et al. 2002; Royle and Link 2006). Observers had experience conducting all-species point counts
for past studies, attended a 6-day training session during the week preceding the surveys for our study, and studied sound recordings of all focal species in the months leading up to the surveys and between surveys. Together, these factors likely ensured a high degree of speciesidentification success. A final caveat about the model is that, based on simulation results for certain combinations of N, k, and p, occupancy estimates may become biased (MacKenzie et al. 2002). Given our study design of k = 4 and N = 29, species-specific ψˆ and var(ψˆ ) may become biased high when species-specific detectability is low (i.e., p ≤ 0.3). CANDIDATE MODEL DEVELOPMENT Variation in the following factors can affect detectability of streamside forest songbirds (Farnsworth et al. 2002; Alldredge et al. 2007b; Simons et al. 2007): 1) species identity, 2) visit occasion, which encompasses time of season (i.e., first two weeks or second two weeks of sampling period) and time of day (i.e., first or second pass along point-transect), 3) ambient stream noise, and 4) observers (i.e., three independent observers). Justifications for including these factors were as follows: 1) Each guild and species within a guild has a unique set of life history traits, including breeding phenology, spatial distribution, and singing rate, frequency range, and amplitude; the former three can affect their availability for detection and the latter two can affect perceptibility by observers; 2) bird vocalization rates vary across the season and within the day, which can limit their availability for detection by an observer; 3) background noise can obscure bird vocalizations and therefore limit perception by observers; and 4) despite similar training, each observer has a unique set of abilities for perceiving bird vocalizations, including experience with the survey technique, knowledge of the focal bird community songs and calls, sensitivity to different frequencies, and attention span. We constructed 18 detection models with combinations of factors and a null detection model with no factors. While accounting for the most parsimonious combination of factors for detection probabilities, we constructed a null, species-specific, and guild-specific occupancy models. Establishing an accurate base-line for occupancy and detection probabilities across the streamside bird community is important for later examining occupancy dynamics across multiple years in response to climate change, forest succession, natural disturbance, and anthropogenic disturbance.
Occupancy Modeling For Avian Monitoring—Mattsson and Marshall MODEL COMPARISONS AND PARAMETER ESTIMATION We used an information-theoretic approach to compare models with all possible combinations of the four factors that potentially influence detection while assuming constant occupancy probabilities across species and transects (n = 15 models, including a null model). In particular, to compare models we used Akaike’s Information Criterion (AICc), which is a measure of parsimony that corrects for small sample size (Burnham and Anderson 2002). Models that are best at predicting the response (e.g., detection probability) with the fewest predictors will have the lowest AICc and are therefore the most parsimonious. We defined the confidence set of models as those with a ΔAICc ≤ 4, where ΔAICc equals the AICc of focal model minus that of the model with the lowest AICc value (henceforth, top model). From the confidence set of models that assumed constant occupancy probabilities, we selected the model with the most parameters for predicting detection probabilities. We then applied these detection factors while modeling occupancy probabilities among species or guilds. We constructed an additional, guild-specific detection model that included all parameters (other than species) in the confidence set of detection models to determine which guilds had sufficient detection probabilities to produce unbiased occupancy estimates (i.e., detection probability > 0.3). To estimate species- and guild-specific detection probabilities, we used model averaging to account for model-selection uncertainty among the 18 candidate models of detectability that assumed constant occupancy. Models upon which the model averaging was based were constructed with design matrices. The design matrices allowed for constraints on groups representing the 25 species or combinations of species (i.e., guilds). While assuming the confidence set of detection factors, we considered three occupancy models: 1) constant across species, 2) guild-specific, and 3) species specific. Inferences about differences in parameter estimates among levels within each factor were based on comparisons of model-averaged 95% confidence intervals surrounding detection estimates and on comparisons of 90% Bayesian credibility limits (i.e., 5th and 95th percentiles from MCMC output) surrounding occupancy estimates. We used a bootstrap goodness-of-fit procedure to evaluate the fit of the most parameterized model (i.e., global model), which was the species-specific occupancy model that included the two grouping factors (i.e., visit occasion and species) for modeling detection. This procedure enables estimation of ĉ, which is a measure of overdispersion and whose value equals 1 when
623
the model fits the data and is thus not overdispersed. Individual covariates (i.e., the visit-specific parameters for observer and stream noise) are disallowed from estimation of ĉ, and so we applied this procedure to the most general model for detection and occupancy with both of the grouping factors (i.e., time and species). We applied the occupancy module in Program MARK to run the goodness-of-fit procedure and to generate AICc values and model-averaged parameter estimates, including probabilities of detection and occupancy (White and Burnham 1999). In cases where parameter estimates did not converge by the default maximum-likelihood optimization routine, we applied the Markov Chain Monte Carlo (MCMC) option in program MARK (Cooch and White 2007). After applying the MCMC option, we assessed convergence by the methods of Raftery and Lewis (1992), using the default values implemented in CODA (Plummer et al. 2006). We compared such models using the Deviance Information Criterion (DIC), which is recommended over AIC for Bayesian approaches to parameter estimation from nonhierarchical models (Spiegelhalter et al. 2002). In addition to modeling occupancy probabilities, we also calculated naïve occupancy probabilities as the proportions of sites where species or groups of species were detected at least once during the four visits to transects. RESULTS DETECTABILITY While holding occupancy constant, a model with additive effects of visit occasion, species identity, observer, and a covariate for stream noise was the most parsimonious for predicting detection probability (henceforth, best model; AICc weight = 81.5%; Table 2). A similar model, but without the effect of visit occasion, was also included in the confidence set (henceforth, second best model; AICc weight = 18.5%), creating some uncertainty as to whether visit occasion should be considered as an important effect on detectability. Models outside the confidence set had very little support individually or cumulatively (sum AICc weights = 0.00%). Model-averaged predicted detection probabilities declined as stream noise increased from 49 to 69 dB (Fig. 2), and the confidence interval surrounding the slope parameter did not include zero in either the best model (βˆdB = –0.11 [–0.16, –0.07] ), or the second best model (βˆdB = –0.13 [–0.17, –0.08] ). Although the confidence intervals overlapped, model-averaged detection probability was greatest for observer 3 and was
624
Proceedings of the Fourth International Partners in Flight Conference
TABLE 2. MODEL COMPARISONS FOR DETECTION AND OCCUPANCY FOR FOREST SONGBIRD SPECIES AND GUILDS ALONG STREAMS IN TWO NATIONAL PARKS OF SOUTHERN WEST VIRGINIA DURING SPRING 2007. Modela
kb
p(sp+obs+db+t) y(sp) p(sp+obs+db+t) y(guild) p(sp+obs+db+t) y(.)
56 40 32
p(sp+obs+db+t) y(.) p(sp+obs+db) y(.) p(sp+obs) y(.) p(sp+obs+t) y(.) p(sp+db+t) y(.) p(sp+db) y(.) p(sp) y(.) p(sp+t) y(.) p(guild+obs+db+t) y(.) p(fdg+obs+db+t) y(.) p(obs+db+t) y(.) p(obs+db) y(.) p(obs) y(.) p(obs+t) y(.) p(db) y(.) p(.) y(.) p(db+t) y(.) p(t) y(.)
32 29 28 31 30 27 26 29 16 12 8 5 4 7 3 2 6 5
w id
Deviancee
Occupancy models 0.0 59.5 79.8
1.00 0.00 0.00
1989.4 2068.1 2095.7
Detection models 0.0 3.0 28.2 30.3 40.3 40.8 56.5 59.3 333.9 425.9 523.7 524.2 527.1 528.7 543.0 543.3 544.4 545.8
0.82 0.18 0.00 0.00 0.00 0.00 0.00 0.00 0.00 0.00 0.00 0.00 0.00 0.00 0.00 0.00 0.00 0.00
2082.1 2091.6 2119.0 2114.5 2126.7 2133.7 2151.6 2147.9 2450.3 2550.5 2656.6 2663.2 2668.1 2663.7 2686.1 2688.3 2681.4 2684.8
ΔAICc or ΔDICc
a
Predictors in models included species (sp), guild, observer (obs), stream noise level (db), and visit occasion (t). Number of parameters in model, including intercepts for detection and occupancy. Information criterion for focal model minus top model based on deviance; Akaike’s Information Criterion (AICc) used for detection models, and Deviance Information Criterion (DIC) used for occupancy models. d Weights of evidence based on AIC and DIC for detection models and occupancy models, respectively. e Deviance = –2 log(likelihood) based on default optimization method and Markov-Chain Monte-Carlo (MCMC) option in Program MARK for detection models and occupancy models, respectively. b c
greatest during the first visit occasion (Fig. 2). Based on a guild-, time-, and observer-specific detection model with a covariate for stream noise, two of the guilds had model-averaged detection probabilities whose confidence intervals overlapped or were below 0.3, which may lead to biased occupancy estimates (Fig. 3). Confidence intervals surrounding model-averaged detection probabilities for the 8 most detectable species (henceforth, high detectability group) were entirely greater than 0.3, below which occupancy estimates may be biased (Fig. 3). Four species had confidence intervals that overlapped this threshold, and 13 species had confidence intervals that were entirely below this threshold (henceforth, low-detectability group comprised of these 17 species; Fig. 3). OCCUPANCY While allowing detectability to vary with observer, species, visit occasion, and stream noise, a species-specific model was the top model and was much more parsimonious for predicting occupancy rates along streamside transects than a model with the same constraints for detection but that assumed only
guild-specific occupancy (ΔDIC = 59.5; Table 2). This guild-specific occupancy model was in turn much more parsimonious than a model with the same constraints for detection but that assumed occupancy was constant across species and guilds (null occupancy model; ΔDIC = 20.3; Table 2). An occupancy model that assumed additive effects of species and visit occasion on detectability (i.e., no individual covariates; observer and stream noise were excluded) fit the data well, as the bootstrapped ĉ value after 100 iterations equaled 1.03. Highly-detectable Species When considering the highly-detectable group, species-specific occupancy probabilities were consistently high and ranged from 62% for Ovenbird to 96% for Acadian Flycatcher, Redeyed Vireo (Vireo olivaceus), and Scarlet Tanager (Piranga olivacea; Fig. 3). Credibility intervals surrounding occupancy probabilities for this group overlapped except when comparing Ovenbird to the four most common species. The three most common species were detected along all 29 transects, but some uncertainty remains as to whether they would occupy every watershed
Occupancy Modeling For Avian Monitoring—Mattsson and Marshall
625
FIGURE 2. Factors important for estimating detection probabilities for focal species surveyed along streams in two national parks of southern West Virginia. Model-averaged estimates were based on an informationtheoretic approach and included stream noise (A), observer (B), and visit occasion (C). Whiskers in bar graphs and dashed lines in line graph represent 95% confidence intervals. Solid line in line graph represents the modelaveraged prediction. Confidence intervals in each graph account for variation within the remaining factors not shown in the graph, including species, observer, visit occasion, and/or stream noise.
in the parks. Naïve occupancy probabilities for the highly-detectable species were within 0.05 of the respective predicted occupancy probabilities and inside their credibility intervals. Less-detectable Species Predicted occupancy probabilities ranged more widely in the less-detectable group than they did in the high-detectability group, from 18% for Swainson’s Warbler (Limnothlypis swainsonii), Cerulean Warbler (Dendroica cerulea), and Brown-headed Cowbird (Molothrus ater) to 81% for Pileated Woodpecker (Dryocopus pileatus). Due to low detectability, predicted occupancy probabilities and their respective credibility intervals for this group are likely biased high. Therefore, many of the credibility intervals in this group were wider than those in the highly-detectable group. As such, credibility intervals for members of the less-detectable group overlapped one another except when comparing two of the least common species (i.e., Swainson’s Warbler and Brown-headed
Cowbird) to two of the more common species (i.e., Blue-headed Vireo and Blue Jay [Cyanocitta cristata]). In contrast with highly-detectable species, naïve occupancy estimates were below the credibility intervals for 7 of the 17 species in this group. This disparity may be explained by the upward bias in occupancy predictions for species with low detectability. Highly-detectable Guilds Guilds whose detection probabilities and their respective credibility intervals were high enough to permit accurate estimation of occupancy included those associated with forest interior or that nest on the ground (i.e., stream bank or forest floor) or that nest in the forest canopy (Fig. 4). Predicted occupancy probabilities varied from 51% for forest-interior species associated with a dense understory to 98% for hemlock associates. Credibility intervals surrounding predicted occupancy probabilities for hemlock associates exceeded that of shrub associates. Likewise, the credibility interval for
626
Proceedings of the Fourth International Partners in Flight Conference
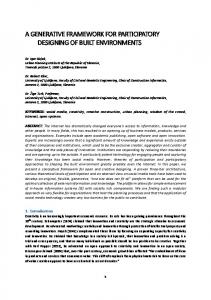
Figure 3. Transect-scale occupancy probabilities (A) and detection probabilities (B) for focal species surveyed along streams in two national parks of southern West Virginia. Gray bars represent model predictions, and thick dashes (-) in top graph (A) indicate naïve occupancy probabilities (i.e., or proportions of sites where species were detected at least once across visit occasions). Whiskers surrounding predicted occupancy probabilities represent 90% Bayesian credibility intervals, while those surrounding detection probabilities represent 95% confidence intervals based on maximum likelihood estimation. Predictions and levels of uncertainty are based on a parsimonious occupancy model that assumes detection varies by visit occasion, observer, stream noise, and species. Species to the right of vertical dashed line had detection probabilities with confidence intervals that overlapped or were below the threshold at which species-specific occupancy probabilities and their respective credibility intervals are biased high. See Table 1 for key to species codes.
Occupancy Modeling For Avian Monitoring—Mattsson and Marshall
627
FIGURE 4. Transect-scale occupancy probabilities (A) and detection probabilities (B) for focal forest songbird guilds surveyed along streams in two national parks of southern West Virginia. Bars represent model estimates, and thick dashes (-) in top graph (A) indicate naïve occupancy probabilities (i.e., proportions of sites where guilds were detected at least once across visit occasions). Unhatched bars represent eight forest-interior guilds, including five nest-placement guilds (unfilled bars), and three habitat guilds (solid filled bars). The hatched bar represents the synanthropic guild. Whiskers surrounding predicted occupancy probabilities represent 90% Bayesian credibility intervals, while those surrounding detection probabilities represent 95% confidence intervals based on maximum likelihood estimation. Occupancy bars with dashed borders represent guilds that had detection probabilities with confidence intervals that overlapped or were below 0.3, below which occupancy probabilities and their respective credibility intervals may be biased high.
canopy nesters exceeded that of the forest-floor nesters. Naïve occupancy estimates were within credibility intervals for only the two groundnesting guilds.
the upward bias in occupancy predictions for guilds with low detectability.
Less-detectable Guilds
Distribution patterns of streamside forest songbird communities in two national parks of southern West Virginia varied among avian indicator guilds during the spring of 2007. Based on our modeling effort, forest-floor nesters and dense-understory associates had a more limited distribution than did canopy nesters and hemlock associates, which may be explained by the historic even-aged management of forests in these parks. Several species had sufficiently high detection probabilities for accurate occupancy estimation, but many had quite low detection probabilities. The detection process was complex and subject to several
For less-detectable guilds, predicted occupancy probabilities ranged from 64% for understory nesters to 85% for cavity nesters. Credibility intervals for the predicted occupancy probabilities overlapped one another, but all naïve occupancy estimates were below and outside these intervals. In contrast with some of the highly-detectable species, all of the naïve occupancy estimates for this group were below the credibility intervals for predicted occupancy. As with the comparisons of species occupancy, this disparity may be explained by
DISCUSSION
628
Proceedings of the Fourth International Partners in Flight Conference
factors including guild or species, observer, visit occasion, and stream noise levels. As expected, detection probability declined with increasing stream noise levels, and detection probabilities were highest during the first visit occasion. The latter finding may relate to species becoming less vocal in response to human disturbance upon subsequent visits. Even after accounting for imperfect detection, we found that some species had restricted distributions, occurring in < 35% of watersheds. Other species, however, were more ubiquitous or found in all watersheds. These occupancy estimates provide a baseline level for which to evaluate community dynamics in these watersheds, including local colonization and extinction events, in future years. MULTI-SPECIES AVIAN MONITORING Traditional approaches to avian monitoring include estimation of species richness (e.g., Cam et al. 2000; Walther and Moore 2005) and species abundance (for review see Johnson 2008), both of which are important for quantifying the number of species and individuals in communities. These two metrics alone, however, carry important limitations for modeling species assemblages. In particular, species richness lacks any information about community composition, and therefore could miss important differences between contrasting species assemblages. Estimates of species abundance are subject to several assumptions that are often violated, depending on the selected modeling approach and focal species (for review see Johnson 2008). The occupancy approach (MacKenzie et al. 2002), in contrast, provides a means to compare community composition (i.e., species- or guildspecific frequencies of occurrence, species richness and evenness) while making a smaller set of assumptions that are more readily satisfied in studies of bird species assemblages, when compared to alternative approaches. An important first step in developing avian monitoring programs is to identify focal species that can be used as indicators of environmental conditions of concern. In our study, species in the highly-detectable group represent good candidates for indicator species, as they belong to several forest-interior nest-placement and habitat-association guilds. Shifts in the distribution in these guilds therefore may indicate changes in not only stand-scale forest structure and composition but also landscape-scale modifications. These guilds included the following: 1) ground nesters (i.e., forest-floor and streambank nesters) that are associated with hardwoods (i.e., Ovenbird) or that are forest-interior habitat-
type generalists (i.e., Louisiana Waterthrush [Seiurus motacilla], Black-and-White Warbler [Mniotilta varia]) ; 2) understory nesters that are associated with dense understory in either forest type (i.e., Hooded Warbler); and 3) canopy nesters that are associated with hemlock (i.e., Acadian Flycatcher, Black-throated Green Warbler [Dendroica virens]), hardwood forest (i.e., Scarlet Tanager), or that are forest-interior habitat-type generalists (i.e., Red-eyed Vireo). In the context of a monitoring program, these species could serve as sentinels for their respective guilds, as their occupancy probabilities can be estimated with relative confidence when compared with the less-detectable species. An alternative approach to species-specific occupancy estimation is to combine occupancy estimates for species in the high- and less-detectable groups into indicator guilds, effectively ignoring species identity while maximizing the usefulness of information across the less-detectable species in each guild. This approach yielded some success in our study, as most of the candidate focal guilds were retained in the highly-detectable group. Despite that one of its members was classified as a highlydetectable species (i.e., Hooded Warbler), the understory-nesting guild fell just below the highly-detectable threshold. The remaining guilds that fell below this threshold (i.e., cavity nesters and nest invaders), however, were comprised entirely of less-detectable species. Such guilds and species within the guilds, therefore, are probably poor candidates for focal indicators in an avian monitoring program. Side-by-side comparisons of species-specific occupancy probabilities and their respective guild-level occupancy probabilities can reveal important distinctions between the two approaches (Figs. 3 and 4). Based on our modeling effort, occupancy probabilities for most of the species in the highly-detectable group were within 20% of the mean and inside the 90% credibility interval surrounding the occupancy probability for their respective guild(s). Exceptions included Black-and-white Warbler, whose occupancy probability exceeded that of forest-floor nesters by 32%, although the credibility intervals overlapped. Likewise, Hooded Warbler occupancy probability was 49% greater than that of shrub-associates. Finally, the credibility interval for Black-throated Green Warbler occupancy was below that of the hemlockassociate and of the canopy-nesting guilds. The distribution of sentinel species therefore may reflect that of the guilds to which they belong in some, but not all, cases. Monitoring multiple sentinels in each guild would therefore be advantageous.
Occupancy Modeling For Avian Monitoring—Mattsson and Marshall Another important step in developing an occupancy-based avian monitoring program is determining the most efficient allocation of survey effort to achieve a target level of precision for annual species- or guild-specific occupancy estimates. Ultimately, these annual estimates will be used to quantify changes between years. According to MacKenzie and Royle (2005), the annual number of optimal replicate visits increases as detectability decreases and/or occupancy increases. Species that are cryptic (i.e., difficult to detect) and/or common require more visits to confirm absence than do species that are easier to detect and/or less common. The optimal number of sites (i.e., transects), then is a function of the desired level of precision, the number of visits, and probabilities of occupancy and detection for the focal species. Following the MacKenzie and Royle (2005) formulas for optimal replication, conducting four visits appears to be optimal for the more cryptic (i.e., more difficult to detect) and/or common species or guilds in our study (i.e., pˆ = 0.4 and ψˆ = 0.5 for shrub associates; pˆ = 0.5 and ψˆ = 0.7, respectively for Black-throated Green Warbler; If, however, the predicted occupancy probability for shrub associates exceeds 50% and their detectability remains