Octopus: A Dashboard for Sensor Networks Visual Control A.G. Ruzzelli∗, R. Jurdak, M. Dragone, A. Barbirato, G.M.P. O’Hare CLARITY: Centre for Sensor Web Technologies, School of Computer Science and Informatics, University College Dublin, Ireland.
1.
INTRODUCTION
In this demonstration, we present Octopus, an interactive dashboard and visualization tool for Wireless Sensor Networks. Octopus helps developers with network debugging, network assessment, and gaining an understanding of network topology and routing patterns. For the final users, it provides a user-friendly tool to localize nodes, formulate application queries and tune parameters according to application requirements. Octopus enables interacting with the network by monitoring and reconfiguring a number of parameters of application and radio, such as frequency channel, nodes’ duty-cycle and energy consumption. A Network Chart plots live data for network analysis while a 2D Floor Plan allows node localization support. Octopus is open-source software developed specifically for TinyOS version 2 that provides a modular architecture independent from the lower layers. Therefore, Octopus can also be utilized as an effective debugging and assessment tool for new underlying algorithms and modules.
2.
RELATED WORK
Until now, the related literature addresses network state monitoring and network control separately. Mviz [3] is the only visualization tool in TinyOS v.2 that provides a basic visualization with no features for remote network control. The closest related work to Octopus is probably Surge [2] which was developed for TinyOS v.1 and is unsupported for TinyOS v.2. Surge enables the user to visualize the nodes, put them into sleep and to set node sampling period individually through the Focused Mode. However, Surge merely represents early work towards the sensor network interaction and it depends on a set of specific protocols defined by TinyOS v.1. Surge has no support for sensing thresholds, network queries and alerts, no node localization and no energy consumption estimation. Furthermore, Surge lacks important setting requests such as duty-cycle, sampling period, and energy consumption estimation. The Octopus dashboard addresses all these drawbacks providing both developers and user with an instrument that combines an accurate insight of the network state and online node reconfiguration. Further related works address dynamic network control but no visualization service through over the air reprogramming ∗
corresponding author:
[email protected]
Copyright is held by the author/owner(s). Mobicom’08, September 14–19, 2008 San Francisco, CA, USA ACM X-XXXXX-XX-X/XX/XX.
S. Boivineau, V. Roy Systeme Electronique and Informatique Industriel, Ecole Polytechnique de L’Universite de Nantes, France.
such as Deluge [1] and Mate [4]. These tools are useful for injecting a new code images or new modules into the networks involving a significant data overhead and network restart. This is only required for less frequent reload of large code components or an entire application but is unsuitable for frequent tuning of application and network parameters.
3.
THE OCTOPUS DASHBOARD
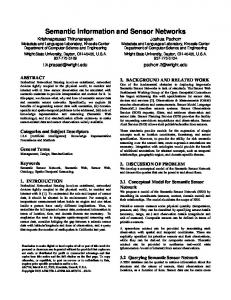
Octopus consists of a front-end Graphical User Interface (GUI) developed in Java and an embedded nesC-based application uploaded onto the motes. The GUI is organized in 4 main components: (1) The SCOUT component listens to the serial port for incoming packets from the network; (2) The MOTE DATABASE and (3) The LOGGER are collectively responsible for storing the sensed data for future analysis; (4) The BOARD includes the visualization options and panels for interfacing with the network. The standard configuration of the Octopus embedded application utilizes the interfaces of CC2420 radio, LowPowerListening access control and Collection Tree Protocol (CTP) routing provided in TinyOS 2. However, the dashboard is independent from underlying protocols that can be defined in the Octopus configuration file for example to debug and evaluate new algorithms. Facilitating future extensions and code reuse conforming to certain standards is an important objective of the dashboard. Octopus presents a JavaBeans component-based architecture that distinguishes between a component-based infrastructure framework and a set of functional components. In particular, the architecture is based on the features associated to the BeanContext class. The framework eases much of the component composition while the abstract API enables different possible implementations of these features. The Octopus architecture enables new or existing components to be plugged-in without altering the remainder of the system. This permits a high degree of configurability and also the creation of different versions of Octopus in order to satisfy specific deployment scenarios and application requirements. The dashboard provides 3 main views namely: (1) Network Map NP for visualizing the topology of the network; (2) Network Chart NC for plotting live nodes sensed data; (3) Floor Plan FP for displaying a map of the physical location where the network is placed. NM, NC and FP are selected by the tabs a, b, and c in Figure 1 and can either be displayed separately or in overlapping modalities. Figure 1 shows the NM/FP view. Initially nodes are located randomly on the board, however, the combined view permits
Figure 1: A Screenshot of Octopus showing connection and locations of nodes.
the execution of an interactive localisation algorithm as explained in Section 4.2. Finally, a Legend panel allows the setting and the visualisation of further network parameters. On the right-hand side of the dashboard, a side menu contains panels for the user to formulate application requests, tune radio parameters, set email alerts, and support interactive node localization. The dashboard visualizes incoming packets live by the Consol panel at the bottom of the board that provides also some checkboxes to filter the messages displayed, as shown in Figure 1 tab i. A Legend panel allows selecting more visualization options on the main board and logging the data into a file.
4.
DEMONSTRATION HIGHLIGHTS
The demonstration setup consists of a laptop connected to a TELOSB mote gateway through USB and about 40 battery-operated TELOSB motes distributed in one or more rooms of the venue. The demo is subdivided into two parts. Firstly, we show the basic architecture and logical organization of Octopus, highlighting the basic functionalities of the Radio Request (RR) and the Application Request (AR) panels. Then, we show some of the advanced functionalities including how to compose application queries by the Alert Panel (AP ), send alerts via SMS, email or screen alerts, and how Octopus supports interactive node localization. A full description of the Octopus, dashboard, downloads, and a video of the dashboard in action can be found at: http://www.csi.ucd.ie/octopus
4.1
The Basic Functionalities
The basic functionalities are provided by the RR, AR and Legend panels accessible by the tabs d,e and h in Figure 1, respectively. At the beginning of the demonstration, the NM is populated with nodes showing the topology of the network and routing connections from nodes to the gateway. Figure 2a shows the RR panel in more detail. The panel provides a ”sleep duty cycle (in %)” slider by which a node duty cycle activity may be changed. Dragging the slider to the desired value and releasing the mouse generates a request packet from the gateway to the network. By selecting
the ”Broadcast” button, the request packet can be broadcast to the entire network. Alternatively the user can select individual nodes on the NM and unicast to them. An important feature provided in the RR panel is a live estimation of the energy spent by each node since start-up. The estimation is calculated by a software-based assessment module that timestamps the radio, CPU and sensor activities. It calculates the energy according to provided data-sheet parameters before transmitting the value to the gateway at a very low frequency interval. The panel also lists the available radio channels where the user can switch to a new frequency channel of operation. Selecting a new frequency of operation generates a request packet containing the channel number and the time of change, which is broadcast by the gateway and acknowledged by all nodes. The time of change ensures that in case of missing acknowledgments, the gateway has time to re-transmit the request to the interested nodes. Time of change is in the order of seconds and should be configured according to network size. From the AR panel shown in Figure 2c, the user can choose nodes and sensor readings to be displayed live in the NC. The user can select either time-driven or event-driven data collection from nodes. Selecting the Request Mode ”Auto” activates transmission at a fixed interval while selecting the ”Query” and the ”Threshold ” sliders regulates a basic event-driven data reports. Setting a threshold to 0 is equivalent to activating nodes in ”auto” mode. The sliders ”Awake Duty Cycle (in %)” and ”Period Sampling” regulates the sensor reading activity and the packet generation frequency at the application layer respectively. The ”AR” panel provides also sleep modes for the application layer: in ”Wake up” mode the node operates normally while in ”To sleep” mode the node switches off all sensing devices, application layer timers, suppress packet generation and waits for a wake-up request from the gateway.
4.2
The Advanced Functionalities
The second part of the demonstration highlights some of the more advanced features offered by Octopus: (1) the Alert Panel for injecting composite queries into the network and
Figure 2: A Screenshot of the Radio Requests, Alerts, and Application Requests panels in Octopus
for sending alerts to the users; (2) the Localise Panel provides support for the nodes localization. The Alert Panel, in Figure 2b, provides a user-friendly system to compose sentence-like queries such as such as ”if a node is within certain xy coordinate and temperature is greater than z then report by SMS ”. The panel consists of 3 blocks: the ”Condition” to formulate a clause-like query, the ”Logic” and the ”Type message” to set alerts. Each condition consists of a Type, a Verb, a Value, and an Epoch. Type allows the selection of packet fields such as nodeID, sensor reading or link quality. The Message Interface Generator (MIG) of TinyOS generates a list of packet fields automatically. The Verb represents the verifying condition while the epoch denotes the duration of the event before the clause is validated. Pressing the Logic button allows generating clause such as ”If temperature is greater than x for y seconds” that is translated into a 40-bit data. It also attaches a logic statement at the end of the clause. Further clauses can be appended through the same process to generate composite queries. Prior to setting an alert, the correctness of a sentence is evaluated on the screen through the ”Translator ” toolbox. The composite query is injected into the network when the ”Message Ok ” button is pressed. The GUI sets a countdown timer and waits for notification from the nodes before alerting the user by SMS, email or a screen message. Nodes are provided with a NesC interpreter module to decode the sentence and activate the enquired mode. Queries also have an expiration time set on the node-side. At present, Octopus supports the composition of a maximum of 10-sentence query according to the maximum packet size allowed. During the demo, the accuracy of the alerts transmission will be verified by plotting the live sensed data on the Network Chart shown in Figure 3. The final part of the demo shows how the dashboard provides interactive node localization support (ILS ). By the Localise Panel, in Figure 1 tab g, the user can first upload an XML-based map onto the board containing coordinates, shape and size of the area network. Following, the user can drag and drop nodes of known location (anchors) in the correct position on the FP. Releasing the mouse generates a packet transmitted
Figure 3: A Screenshot of the Network Chart with live sensed data in Octopus
to the anchors or broadcasted to the network. This allows nodes to run their localization algorithm. After completion, nodes transmit their estimated location to the GUI that enables localizing them on the FP. If the accuracy obtained is not sufficient, the user may decide to repeat the process by dragging a further anchor to the correct position on the FP. Nodes’ placements can also be saved to avoid running the algorithm every time the network is rebooted. Although the ILS has been developed without a specific localization algorithm, the demonstration shows a live example of the ILS for a link quality-based triangularization algorithm.
5.
REFERENCES
[1] Deluge: TinyOS Network Programming. UC Berkeley. http://www.cs.berkeley.edu/ jwhui/deluge/ [2] Surge Demo for the Multihop Sensor Network. http://firebug.sourceforge.net/surgepics.html [3] Mviz http://www.tinyos.net/tinyos-2.x/apps/MViz/ [4] P. Levis and D. Culler. Mate: A Tiny Virtual Machine for Sensor Networks. In proceedings of ACM SIGOPS Operating Systems Review.