In this frame, building performance simulation (BPS) tools could be useful, when ... analyses the user-friendliness of six common BPS tools from an architect's.
A comparative study of the ‘architect-friendliness’ of six building performance simulation tools 1,2
3
1
Lieve Weytjens , Shady Attia , Griet Verbeeck , and André De Herde
3
1
University College Limburg (PHL), Dpt. Arts & Architecture, Diepenbeek, Belgium 2 Hasselt University, Belgium 3 Architecture et Climat, Université Catholique de Louvain, Louvain-La-Neuve, Belgium
Concerning net zero energy buildings, providing early design support for architects has never been more important. In this context, building performance simulation tools could be a strong supportive technique, when integrated early in the architectural design process. However, despite the available range of tools, most of them do not meet the architects‘ requirements. To identify this gap, this study compared the ‗architect-friendliness‘ of six state-of-the-art simulation tools, to highlight the architects‘ requirements for these tools and to develop guidelines for researchers and tool developers. The examined tools included ECOTECT, IES/VE – Sketch-Up, Energy10, eQuest, HEED, and Design Builder. The analysis was based on an extensive list of criteria defining the user-friendliness of tools from an architect‘s point of view. The results show that no single tool is entirely adequate to assist the architect‘s decision-making process. One of the major limitations is the poor communication and visualization of the output results.
1.
Introduction
Due to climate change, architects are increasingly challenged to design Net Zero Energy Buildings (NZEB). The architectural design process (DP), and more specifically early design phases (EDP), embrace major opportunities in achieving NZEB. In these EDP important parameters affecting the building performance are addressed. In the context of NZEB architects can no longer only depend on experience. Consequently, early design support has never been more important, especially for small projects lacking engineering support due to limited budgets. In this frame, building performance simulation (BPS) tools could be useful, when integrated early in the DP. However, most existing BPS tools are not in tune with the architects‘ approach and are not suitable for EDP. To identify this gap, this paper analyses the user-friendliness of six common BPS tools from an architect‘s viewpoint, i.e. the ‗architect-friendliness‘ [1-3]. In the past, several tool analyses have been performed [4-6], but mostly focus on tool functionalities without considering the architect‘s point of view. The main objectives of this study were to identify existing gaps and the architects‘ needs for BPS tools and to develop guidelines for researchers and BPS tool developers. A selection of tools usually referred to in literature as user-friendly were examined, including ECOTECT, IES/VE-Sketch-Up, Energy10, eQuest, HEED, and DesignBuilder. This paper briefly documents the research methodology followed by the most important results for each BPS tool separately. In the discussion, the tool specific results are compared and current gaps are highlighted.
2.
Methodology
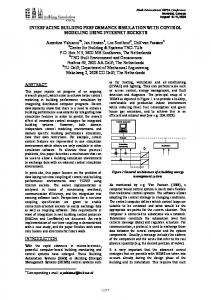
The research consisted of two major steps. First, a screening of existing BPS tools was conducted to identify the most architect-friendly tools. Then each tool was studied by simulating a simple construction model (as shown in Figure 1) in it. This allowed an in-depth analysis of tool capabilities and of the tools usability in the DP. The analysis primarily focused on energy use and thermal comfort and was based on a previously developed framework defining the architect-friendliness of BPS tools, which is discussed in detail in [2]. This framework comprises five major themes, each including several tool criteria, which are used to test the applications. The first theme, ‗data-input‘ focuses on important aspects to adjust the input to an architect user, such as limited and quick data-input. The second theme, namely ‗output‘, incorporates important criteria related to easy interpretable and visual output results. The graphical user interface consists of criteria concerning ease of navigation and interface structure. The fourth theme aims to check the tools on their usability in the DP. Finally, the fifth theme includes general criteria. In the next section, these five themes are used to structure the analysis results for each tool separately. To examine the strengths and weaknesses of the tools, the different criteria have been evaluated on a rating scale from --, -, 0, +, to ++, in which ‗++‘ stands for ‗highly elaborated‘, ‗0‘ refers to ‗neutral‘, and ‗—‗ corresponds to ‗not supported‘. The framework and the tool ratings are illustrated in Appendix-1.
Figure 1. Simple construction model
3.
Results
3.1.
ECOTECT
ECOTECT [7] is primarily intended as a conceptual design tool and incorporates various simulation functions. The target audience are architects. ECOTECT-2009 was used for the analysis.
Figure 2. Ecotect‘s interface and material library
Figure 3. Output graphic for thermal analysis
Data-input A built-in 3D-modeller facilitates the construction of the building geometry, but the geometry has to be remodelled from scratch. Default materials and properties are automatically assigned to building elements, strongly reducing inputs. Component properties can easily be modified and new materials can be created in the material library, but not all required properties are in the architect‘s language. Output Despite ECOTECT‘s strength of visualizing output in the 3D-building model, the results of the thermal analyses (mainly charts), are often difficult to interpret. Also, an overwhelming amount of information is generated. Interface The interface is clearly structured around five tabbed views, but navigation and intuitive usage are restrained by a multitude of options. Usability in DP ECOTECT primarily focuses on EDP. The tool is not adequate for detailed design, as it does not sufficiently support input from general to detail and lacks accuracy. Further, it does not allow straight comparisons between design alternatives. General The tool‘s major strengths are its visual appearance and suitability for EDP. However, there is a lack of accuracy and reliability for thermal analysis [8]. Also, too many options and too much information are incorporated.
Further, this instrument does not sufficiently embrace the NZEB-approach, as it does not assist architects in implementing renewable energy strategies.
3.2.
IES/VE Sketch-Up plug-in
The IES Sketch-Up plug-in [9] allows architects not only to model buildings, but also to predict their performance using Sketch-Up. IES/VE-6.0 and Sketch-up7 were used for the analysis. Due to the research focus on architect-friendliness, only VE-Ware and VE-Toolkits were examined.
Figure 4. IES/Sketch-up plug-in: interface/input
Figure 5. output VE-Toolkits
Data-input The process of data-input is easy, quick and adapted to EDP. The building geometry is modelled in Sketchup, a familiar modelling environment to architects. Building components and systems can easily be defined using simple drop-down menus with preset defaults. However, there is no possibility to go beyond the built-in choices, as no customised options are offered. Output The output results are not very suitable to support the decision-making process. This is mainly due to lack of visual presentation and too much textual and tabular information. Also, feedback into the design software (Sketch-Up) is not possible. Interface The IES-toolbar in Sketch-Up is simple with a restrained set of options, facilitating data-input and navigation. However, the building model has to be imported to IES, interrupting the fluidity of the tool and enforcing the user to switch to another environment. Usability in DP The simplicity of the interface and the process of data-input correspond to the architects‘ working method and fit EDP, in contrast to the output results. General Based on few inputs, this instrument allows architects to simulate the impact of architectural design choices on the building performance, without the need to consult a manual. However, to be truly architect-friendly the output should be improved. Regarding NZEB, VE-Toolkits offers several analysis features, including LEED compliance and renewable energy strategies.
3.3.
Energy-10
Energy-10 [10] is targeted at both architects and engineers for usage in EDP and is developed for smaller buildings with one or two thermal zones.
Figure 6. Energy-10: input screen
Figure 7. Comparison of simulated cases
Data-input The building geometry is represented as a shoebox and defined by only few inputs, resulting in a reference case and a low-energy case. However, the input is mainly numerical and it is difficult to customize existing or create new components. Output Although the output provides an interesting comparison between the two simulated cases, several output graphics are not intuitively interpretable for architects nor convincing to clients. Also, too many output options are considered. Interface The interface is not visual, impeding flexible navigation. Also, there is no 3D-representation of the building geometry. Usability in DP The required inputs are minimal and solutions are obtained quickly. However, the shoebox abstraction of building geometry disconnects the simulation from the architectural design, restricting its usability in the DP. General A major strength concerning architect-friendliness includes the comparison of simulated cases. The tool further incorporates unique features in the context of NZEB, such as ranking energy efficient strategies and implementing renewable energy systems.
3.4.
eQUEST
eQUEST [11] is targeted at all design team members and all design phases. Version 3.6 was used for this study. The tool comprises two wizards. This research only examined the schematic design wizard.
Figure 8. eQuest input screen
Figure 9. eQuest output
Data-input The process of data-input follows a wizard approach. This facilitates the input process, but lacks flexibility. The data-input is primarily textual, too detailed and not architect-orientated.
Output Although the output supports easy comparisons of alternatives, it is often difficult to use in relation to design decision-making. Interface The interface is mainly textual and has limited visual appearances. The wizard approach impedes flexible use and navigation. Usability in DP Data-input is mainly text-based and requires specialist knowledge. Moreover, most required input parameters are beyond the focus of early architectural design choices. Hence, the tool‘s usage is primarily orientated to detailed design phases. General eQuest provides reliable results, but requires detailed and technical orientated data-input. From an architect‘s viewpoint, the possibility to compare design alternatives is one of its major strengths. Considering NZEB, the tool supports the possibility to evaluate various energy efficiency measures including what if scenarios.
3.5.
HEED
HEED [12] is an energy design tool for dwellings, aimed at California legislation. HEED3.0 was used for the analysis.
Figure 10. HEED: building geometry
Figure 11. HEED output
Data-input Based on few input parameters, the program automatically creates two reference cases, one meeting the California energy code and another more energy efficient. Subsequently, the design can be specified editing other parameters such as orientation. The building geometry is simplified. Component properties are selected from predefined lists, but customised choices are more difficult to define. Output The output clearly supports benchmarking. Particularly, the building‘s performance is compared with a code complying and a more energy-efficient design. This improves the interpretability of the results by architects and facilitates the decision-making process. However, the results lack visual qualities. Interface The input process also follows the wizard approach, which is simple, but lacks flexibility and is primarily based on text. The interface is kept simple with a restrained set of options, which improves navigation. Usability in DP HEED is easy to use and requires minimal time to perform design evaluations. However, due to the nature of data-input and the low level of detail, the tool is mainly suitable for EDP. The easy comparison of design alternatives facilitates design decision-making. General This application is easy and intuitive to use, but is mainly applicable for very basic analyses.
Concerning NZEB, the benchmarking feature assists architects in the design of energy efficient buildings. Besides the total energy consumption, the tool considers CO2production and achieved cost savings. Also, various passive solar and energy efficient design strategies can be assessed.
3.6.
DesignBuilder
DesignBuilder [13] provides a graphical user interface to the EnergyPlus simulation engine. It is developed to be used in all design stages. Version-2.0.4.002 was used for this analysis.
Figure 12. DesignBuilder interface
Figure 13. DesignBuilder output
Data-input DesignBuilder offers several distinctive input options, each requiring different levels of detail. For instance, the building geometry can be constructed using the 3D-modeller or it can be imported from 3D-CAD software. Extensive templates and default values further allow a reduction of data-input, but custom datainput is difficult. Output Despite the interesting feature to perform parametric analyses, most output graphics are too detailed to architects and are not intuitively interpretable. Also, an overwhelming amount of information is generated. Consequently, the output results do not sufficiently support the architect‘s decision-making process. Interface DesignBuilder‘s interface is well organized around several tabbed views. However, behind this structure the designer is often confronted with too much information and too many options, impeding ease of use and navigation. Usability in DP DesignBuilder supports different levels of data-input, ranging from general to detail. As such, this tool is largely adapted to the different phases of the DP. However, due to extensive amounts of information and difficult result interpretation its usability in the DP is limited. General Although DesignBuilder is based on a complex simulation program, it attempts to address the architect‘s specific language by a visual orientated interface and inputs in different levels of detail. Nevertheless, the output constitutes one of the major limitations concerning architect-friendliness. The parametric analyses on the other hand, could provide useful information to support architects in the design of NZEB.
4.
Discussion
The results of this comparative analysis indicate that none of the examined tools entirely meets the previously defined architect-friendly criteria, or fully corresponds to the architectural DP. Similar findings were observed in an analysis of four simulation tools by Riether et al.[14], showing that there are still large problems that hinder the integration of BPS tools in the DP. The results of the current study in particular revealed an important gap concerning architect-friendly output. The results are often too complex and detailed for architects, providing an excessive amount of information. In some cases, the output is rather limited. Summarized, most of the output results are difficult to interpret in relation to design decisions. The output representation often lacks visual qualities and does not enhance communication with clients. Nevertheless, several tools showed some interesting output features with
respect to the architect‘s decision-making process, including benchmarking and the possibility to compare alternatives. Considering data-input, most tools focus on quick and easy data-input minimally interrupting the DP and on inputs in the architect‘s language. The data-input is often reduced using default values. Especially IES Sketch-Up accomplishes satisfying results regarding architect-friendly data-input that fits EDP. The building geometry is modelled in an environment familiar to architects. Remaining inputs are greatly reduced and can easily be assigned using simple dropdown menus with defaults. The interface is very simple, facilitating clear navigation. The possibility to directly construct the building model into the design software considerably enhances the architect-friendliness of simulation tools and minimizes the interruption to the DP. In this respect, previous research shows architects have preference for Sketch-Up, because of its simplicity in use and suitability for EDP [2]. Nevertheless, this feature could significantly be enhanced by also integrating the simulation results and feedback into the design software. The usability of tools in the DP was sometimes limited by poorly addressing design parameters that are of fundamental importance to architects, such as orientation, building layout, window sizing, and shading devices. Further, none of the tools studied appeared to be entirely adequate for use in all design phases. Additionally, most tools do not perform well on all five themes and are mostly directed on certain specific themes, as shown in figure14. This implies that none of the tools examined is entirely architect-friendly or can fully support architects in the design of small-scale NZEB that lack engineering support. In future, tools should be developed in close cooperation with and exhaustively tested by architects. It can be concluded that tools must thoroughly be integrated in the DP to successfully contribute design support. This does not only require efforts regarding data-input and data modification, but also regarding other aspects, including the visualization of the results.
Figure 14. Tool results, summary
5.
Conclusion
This study examined the architect-friendliness of six BPS tools, using a previously developed framework. The results showed that no tool is entirely adequate for architect‘s use, despite recent developments. One of the major limitations of current tools can be attributed to the poor communication and visualization of the output results, which do not assist the architect‘s decision-making process. In this frame, major opportunities reside in bringing simulation results into the design software. Furthermore, a clear necessity appears for developing or improving BPS tools that fully correspond to the architect‘s needs and fit the architectural DP of NZEB.
6.
References
[1]
Attia, S., Beltrán,L., De Herde,A., & Hensen,J.(2009). ―Architect friendly‖: a comparison of ten different building performance simulation tools. Proceedings of the 11th International IBPSA Conference. Glasgow, Scotland Weytjens, L., & Verbeeck, G.. (2010). Towards ‗architect-friendly‘ energy evaluation tools. Proceedings of the Symposium on Simulation for Architecture and Urban Design (SimAud2010) at the Spring Simulation Multiconference 2010. Orlando, U.S.A. van Dijk, E.J., & Luscuere,P. (2002). An architect friendly interface for a dynamic building simulation program. Sustainable Building 2002 Conference. Oslo, Norway Crawley, D.B., Hand,J., Kummert,M., & Griffith, B.T.(2008). Contrasting the capabilities of building energy performance simulation programs. Building and Environment. 43 (4): p. 661-673 Hopfe, C.J., Struck, C., Harputlugil, G.U., Hensen, J., & De Wilde, P.(2005). Exploration of the use of building performance simulation for conceptual design. IBPSA- NVL Conference 2005, T.U.Delft. Delft, The Netherlands
[2]
[3] [4] [5]
[6]
[7] [8]
[9] [10] [11] [12] [13] [14]
7.
Lam, K.P., Huang, Y.C., & Zhai, C.(2004). Energy modelling tools assessment for early design phase. Report. Center for building performance and diagnostics. School of Architecture. Carnegie Mellon University, Pittsburgh Autodesk Ecotect Analysis (2009). http://usa.autodesk.com Hensen, J.L.M., & Radosevic, M. (2004). Teaching building performance simulation - some quality st assurance issues and experiences. Proceedings of PLEA 2004. The 21 Conference on Passive and Low Energy Architecture. T.U.Eindhoven, The Netherlands. IES Virtual Environment. http://www.iesve.com/software/Model-building/SketchUp-plug-in Energy-10. http://www.nrel.gov/buildings/energy10.html eQuest. Version 3.6 http://www.doe2.com/eQuest/ HEED.Version 3.0. Retrieved from: http://www.energy-design-tools.aud.ucla.edu/ DesignBuilder. Version-2.0.4.002 Retrieved from: http://www.designbuilder.co.uk th Riether, G., & Butler,T.(2008). Simulation space. A new design environment for architects. In 26 eCAADe Conference Proceedings . Muylle M., ed., Antwerp, Belgium
Appendix
Appendix-1. Framework architect-friendliness: tool ratings