On Comparing and Complementing Two MBT Approaches Maximiliano Cristi´a
Valdivino Santiago
N. L. Vijaykumar
Flowgate and CIFASIS Rosario, Argentina
[email protected]
INPE S˜ao Jos´e dos Campos, Brazil
[email protected]
INPE S˜ao Jos´e dos Campos, Brazil
[email protected]
Abstract—At INPE1 researchers and software engineers have been using Statecharts-based testing for some time to test on-board satellite software. On the other hand, a group of researchers at CIFASIS2 and Flowgate Consulting have been applying Z-based testing for unit testing. Both groups started to compare their approaches and tools a year ago. What started as a comparison to share ideas and results, is now turning into the realization that actually both techniques complement and benefit from each other, yielding a more effective and wider modelbased testing (MBT) approach. In this paper we present the results obtained so far in comparing and complementing these two MBT techniques.
suspicions: nobody has reported yet on how to combine MBT techniques. In Sections II and III we briefly introduce the method used by each group. Section IV shows the results of comparing our methods through their application to a toy example and to two real-world case studies. Perhaps the main contribution of this paper lays in Section V where we suggest a proposal for combining Statecharts-based and Z-based testing. Sections VI and VII compare our work with similar approaches and present our conclusions, respectively.
I. I NTRODUCTION
II. S TATECHARTS AND F INITE S TATE M ACHINES FOR TESTING AT INPE
According to [1] there are 8 papers on unit MBT, 46 on system MBT, just one addressing both unit and system testing [2] and none combining Statecharts [3] and the Z formal notation [4]. Offut and Liu’s work is based on the Structured Object-Oriented Formal Language (SOFL) [5] notation. In this paper we address how to use MBT to calculate both unit and system test cases, but we use two industrial-strength, widelyused formal notations: Statecharts and Z. Furthermore, we have applied our approach to two real-world problems from the aerospace sector, while [2] only shows the application of their method to a toy example. In this way, we believe this is a contribution to the experience/industrial reports category proposed by Dias Neto et. al. As we indicate in the paper’s title, these results are the outcome of what started as a comparison between two MBT approaches and later became a combination of both techniques. We started our joint project with the intention to see how we could help INPE’s test designers to better and efficiently test satellites’ on-board software. At the beginning only one thing was clear: both groups were working on MBT but with different notations and tools. Then, we decided to demonstrate our methods to each other using the same real-world case study proposed by INPE’s people. The first conclusion was that both methods were functionally testing the same system but in different ways. Latter we tried to find similar works comparing or complementing MBT methods but we found none and eventually we arrived at [1] which confirmed our 1 INPE
– National Institute for Space Research. – French Argentine International Center for Information Systems and Sciences. 2 CIFASIS
INPE has been using MBT within research projects for system and acceptance testing. Statecharts [6], [7] and Finite State Machines (FSMs) [8] are the main techniques used for modeling the behavior of the Implementation Under Test (IUT) for testing purposes. The application domain is software embedded into on-board computers of scientific satellites and balloons developed at INPE. These MBT approaches have shown efficiency in detecting defects not only in the source code but also in other deliverables, like requirements specifications and user manuals. One of the main advantages of FSMs is simplicity. Reactive systems, protocol implementations, classes of Object-Oriented applications are some examples commonly address-ed by FSM modeling. Several test criteria (methods) may be used for model-based test case generation regarding the FSM technique. A few of such methods are the Transition Tour (TT), Distinguishing Sequence (DS), Unique Input/Output (UIO), W [9], switch cover (1-switch) [10] and state counting [11]. Despite their adoption by many researchers, FSMs are not too adequate for representing features such as parallelism and hierarchy. On the other hand, Statecharts provide a simple way to represent these characteristics. There are several approaches proposed to generate test cases from Statecharts models. Particularly, we quote the work of Binder who adapted the W method to an UML context and named it round-trip path testing [12], and Santiago et al. [6] who proposed a methodology to transform hierarchical and concurrent Statecharts into FSMs. System and acceptance testing are applied considering the entire software product. If a professional wants to develop
model-based test case generation relying on, for example, FSMs or Statecharts, he/she must develop the state-transition diagrams. Due to the state explosion problem, a test designer at INPE usually breaks down the entire system based on usage scenarios. Models are then derived to address each scenario and, provided they are small enough, test cases are generated from them. INPE has been developing an environment named Gerac¸a˜ o Autom´atica de Casos de Teste Baseada em Statecharts (GTSC – Automated Test Case Generation based on Statecharts) that allows test designers to model software behavior using Statecharts and/or FSMs in order to automatically generate test cases based on some test criteria for FSM and some for Statecharts [7]. At present, GTSC implements switch cover, UIO and DS test criteria for FSM models and two test criteria from the Statechart Coverage Criteria Family (SCCF) [13] for Statecharts models: all-transitions and all-simple-paths. GTSC transforms a Statecharts model into a flat FSM, i.e. a model where all hierarchical and orthogonal features of the Statecharts were removed. Each state of the resulting flat FSM is actually a configuration of active BASIC states of the input model at a certain instant of time. This flat FSM is indeed the basis for test case generation. Hence, a test designer may follow two approaches: 1) If a SCCF test criterion will derive test cases, GTSC must adapt the flat FSM to resemble a reachability tree [14]. Thus, based on the selected test criterion of SCCF and on this tree, test cases are created. 2) If an FSM test criterion is the option, it is only necessary for the user to choose among the available criteria for FSM and instruct the environment to generate test cases, based on the flat FSM. A final observation is that a Statecharts model without hierarchy, parallelism, synchronization is nothing more than an FSM (or Extended FSM if guard conditions are used). Hence, it is perfectly possible to provide as input to GTSC an FSM and use the same FSM test criteria to derive test cases. GTSC was able to generate flat FSMs with as many as 40 states (configurations) and more than 300 transitions, and test suites with up to 265 optimized test cases, showing its potential scalability for handling complex systems [7]. INPE has also been developing a Web tool that allows model-based test case generation named WEB-Perform Charts [33]. WEBPerformCharts works similar to GTSC, by transforming a Statecharts model into a flat FSM, and it has implemented the TT, switch cover and UIO test criteria for FSM models. Such a tool addresses collaborative work where different teams cooperate with an objective of reaching a specific goal, and it has generated flat FSMs as complex as the ones created by GTSC.
test templates and cases3 . They also proposed new testing tactics4 particularly well suited to the Z notation. Testing tactics are the mechanisms used to partition the input space into test templates and, in turn, test templates into more test templates, thus building a so called testing tree. Test cases are elements selected from the leaves of the testing tree. Fastest [18] is a flexible, efficient and automatic implementation of the TTF developed conjointly by CIFASIS and Flowgate Consulting. Currently, Fastest automates test suite definition and test case derivation for unit testing. Fastest receives a Z specification in LATEX format using the CZT package [19], [20]. The Z specification must verify the ISO standard [21]. The specification is transformed into an internal representation more amenable to parsing and static analysis. Then, the user has to enter a list of the operations to test, as well as the tactics to apply to each of them. In a third step Fastest automatically generates the testing tree of each operation. After the trees are generated, the user can browse them and their test classes, and he/she can prune any node. Currently, pruning is only manual but CIFASIS is implementing automatic techniques to be included in the next version. Once the user is done with pruning, he/she can instruct Fastest to find one abstract test case for each leaf in all the test trees. Although the method to find abstract test cases has proved to be quite automatic, it is worth to say that it does not guarantee to find abstract test cases for all test objectives. In those cases, the engineer can help Fastest to find a test case by issuing a rather straightforward command. The user can export all the results –testing trees, test classes and abstract test cases– in LATEX format. Fastest was envisioned as a client-server application [22]. The main reason for thinking in a distributed system came from the realization that calculating abstract test cases from test objectives in large projects could be a hard computing problem, but highly parallelizable as well. Then, an scalable application using the idle computer power present in a corporate network, became an appealing option. On the other side, since testing a large application is usually carried out by a group of testers, a client-server architecture allows the team to work concurrently from different workstations by running a client process per tester. However, in such a large project there is shared information –such as the definition or parametrization of some testing tactics, test cases already calculated, theorems that help to prune testing trees, etc.– that all the clients and servers should be able to access. Hence, a typical Fastest installation has a data server that is known to all other processes, some client processes and a number of testing servers. IV. C OMPARISON : CASE STUDIES
III. Z- BASED TESTING WITH FASTEST
As we pointed out earlier, this paper is the result of a joint effort between two R+D institutions from Argentina
Phil Stocks and David Carrington introduced in [15], [16], [17] the Test Template Framework (TTF) to conduct modelbased testing of Z specifications [4]. TTF includes a rigorous and disciplined technique for defining and structuring abstract
3 Test templates can also be called test suites, test classes or test objectives; we will use all of them as synonymous. 4 Here we preferred testing tactic instead of the original term, testing strategy, because we believe the former has a narrow scope than the latter.
and Brazil. The cooperation started by comparing the MBT techniques used at each institution. The second step was to define a common problem to work with so both groups had a common workbench. The first problem was proposed by INPE’s group. CIFASIS researchers then developed a Z model and applied Fastest in order to generate test cases. INPE researchers had already a Statecharts model and the test cases generated by the GTSC environment. The comparison was then extended to two more examples: one proposed by INPE and the other proposed by CIFASIS. We followed the same methodology for all the problems. First, the party proposing the problem delivers an informal natural language requirements specification. Second, the other party starts to write a formal model. Third, if the party writing the model finds some problem (incompleteness, inconsistency) or misunderstands the requirements, the other party will send corrections/explanations. Fourth, when the model has been finished the party who wrote it will apply its MBT methodology and tool. In the next subsections we briefly describe the three problems. A. EXP – OBDH Communication Protocol The first problem proposed by INPE was the software embedded into an astrophysical experiment computer, hereafter called EXP, of a Brazilian scientific satellite. A proprietary protocol was specified for the communication between EXP and the On-Board Data Handling (OBDH) computer. OBDH is the satellite platform computer to process platform and payload information and to generate and format data that has to be transmitted to Ground Stations. OBDH sends one out of nine commands at a time to EXP, which returns an answer to OBDH. Each command must arrive within certain time constraints. Commands ask EXP to perform some operations or to return some data about its state. There are simple commands to reset the microcontroller, to ask for the current time, to initiate data acquisition, etc. Besides, there are more complex commands to transmit scientific data acquired by the payload, to dump EXP’s memory, to load data sent by OBDH, etc. B. A Simple Scheduler This problem was proposed by CIFASIS borrowing it from [23]. The problem is about the basic operations of a simple scheduler. The environment can buffer processes for latter execution and can withdraw a process from the waiting list. On the other hand, the scheduler can swap between the active process and one other process ready for execution. The idea behind this problem was twofold: (a) to propose a simpler problem, and (b) to apply our techniques to a somewhat less reactive system. C. SWPDC The third problem was a software product specified and developed in the scope of the Qualidade do Software Embarcado em Aplicaes Espaciais (QSEE - Quality of Space
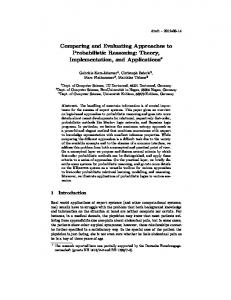
Application Embedded Software) research project at INPE [34]. SWPDC is the software embedded into the Payload Data Handling Computer (PDC) and it is the hardest problem of all we have analyzed. Although similar in conception to the case study described in Section IV-A, SWPDC is much more complex because it handles not only scientific and dump data (e.g. housekeeping data), but also accomplishes data memory management, implements flow control mechanisms, etc. Data transmission is more complex since SWPDC has to keep record of the last transmitted frame because OBDH can ask it again if some problem during transmission was detected. These are just a few of the SWPDC requirements. D. Summary After applying each technique to the preceding problems, the first and quite obvious conclusion was that all looked very different: models, test cases and methods or tactics were, initially, hard to compare. Hence, we needed some framework inside which we can compare our techniques and tools. We, then, searched for articles comparing MBT techniques and tools [24], [1], [25]. Eventually, we followed [24] and extended the set of dimensions defined by the author to base the comparison. We divided these dimensions into two groups summarized in Tables 1 and 2. Table 1 includes those dimensions that are, at least to some extent, independent of the cases studies, while Table 2 reunites those dimensions whose values depend on each case study. The dimensions named Notation concepts and MBT concepts include the new concepts a software engineer with a basic knowledge of formal modelling has to learn in order to apply each technique. The dimensions whose values are marked with X indicate which technique is more suitable for each dimension –this does not necessarily mean that the other technique cannot be applied at all. In column Number of test cases of Table 2, we show for GTSC the number of test cases and (/) the number of test steps since “test step” is a meaningful concept regarding FSM-based MBT techniques. On the other hand, for Fastest we just give the number of test cases since each test case has always only one test step. The dimension called Ratio is the ratio between the two upper rows. By indicating the Model size we tried to give a broad idea of the model complexity. For the Z models we give the number of Z-LATEXlines of code, while for the Statecharts models we give the number of states and (/) the number of transitions of the flat FSM. Although these measures are incomparable to each other, they give an idea of the relative complexity: (a) between the case studies, and (b) with respect to other models that can be found in the literature. Table 1 shows that both techniques are rather similar, although GTSC can be applied to more phases of the testing process. However, it should be noted that, as is reported in [1], there are just a handful of MBT techniques that apply to unit testing, while there are dozens that apply to the latter phases. Despite the greater number of MBT techniques related to integration, system and acceptance testing, there are still serious issues to be solved as state explosion and
Dimension Notation concepts
MBT concepts
Computability issues Computability solutions Test objectives Test cases
GTSC – INPE Statecharts: XOR and AND states, internal and external events, actions, conditions, hierarchy, parallelism and machine synchronization, broadcasting, shallow and deep history, PcML language reachability tree, state configuration, Statecharts flattening, determinism, test criteria for FSM (switch cover, UIO and DS) and for Statecharts (all-transitions and all-simplepaths) state explosion duplicate nodes (Statecharts test case generation) usage scenarios and models to represent them sequences of events producing state transitions
Unit testing Integration testing System testing Acceptance testing Reactive systems Information systems
EXP Scheduler SWPDC
huge finite models parallelization, user assistance written as Z schema boxes bindings between state or input variables, and constant values X
X X X X X Fig. 1.
Case study
Fastest – CIFASIS & Flowgate Z (subset): first order logic, state and operation schema, schema language, typed logic, typed set theory, before and after state convention, input and output variables convention, logic and mathematics for modelling testing tactics (standard partitions, disjunctive normal form, free types), testing tree, domain partition, valid input space
Comparison criteria. Case-study-independent dimensions.
Computing time GTSC Fastest 0:51 124:00 3:20 3:00 11:42 158:00 Fig. 2.
Dimensions Number of test cases Ratio GTSC Fastest GTSC Fastest 78/436 112 0:0.6 1:06 5/43 29 0:40 0:06 30/663 117 0:23 1:21
Model size GTSC Fastest 17/63 608 7/16 240 512/522 1,238
Comparison criteria. Case-study-dependent dimensions. Times are in minutes.
test case redundancies which justify the development of new methodologies and supporting environments for these phases such as GTSC. As the reader can easily note, Table 2 shows that GTSC outperforms Fastest when reactive systems are considered (EXP and SWPDC), but Fastest wins when our tools are applied to a (more) information oriented system (Scheduler). Although this comparison was useful for us, we moved one step forward because we saw a possibility for complementing our techniques, as shown in the next section. V. A COMPLEMENTARY APPROACH As we said in Table 1 test cases generated by GTSC are sequences of state transitions, while test cases generated by Fastest are bindings or assignments between state variables and constant values. The following sequences are two test cases generated by GTSC for the EXP case study. They correspond to OBDH sending a memory load command to EXP –i.e. OBDH sends a program to EXP that it must load into its
own memory. Both sequences describe the operations that EXP executes while receiving data from OBDH. 0xEB → 0x92 → T1B → Size38 E → Data0x100 E → TimerTimeout 0xEB → 0x92 → T1B → Size38 E → Data0x100 E → TypeOkSizeOkDataOk E → Cks Ok 0xEB and 0x92 identify the beginning of a new order coming from OBDH. T1B means that the sequences correspond to a memory load command. Size38 E and Data0x100 E are the size in Bytes of a piece of program, and the address in memory where this piece of code will be loaded followed by the code, respectively. The event TypeOkSizeOkDataOK E means the data (code) sent by OBDH was received correctly by EXP. Note that the first test sequence ends in a timeout event. This means that OBDH has taken too long in sending all the data, and so actually no memory load is performed. The second test sequence describes a successful command, i.e. EXP loads the code into its memory.
The following Z schema boxes are two test cases generated by Fastest for the same memory load command. Observe that each test case is a set of assignments5 . Each assignment sets a constant value for one of the state and input variables. Regarding this command, the most important variables are data?, which is the input variable representing the new program; addr?, representing the initial address where the program must be loaded; and memd, which is the state variable representing EXP’s memory. Then, roughly speaking, the first test case says that OBDH has sent a two byte long program to be loaded starting at the first memory location while EXP’s memory holds a one byte long program; and, on the other hand, the second test case says that OBDH has sent an empty program –that should be loaded after the program currently being held by EXP– while EXP’s memory is occupied by a single byte program. MemoryLoad SP 15 TCASE MemoryLoad SP 15 dumping = no ∧ mep = 0 ∧ ccmd = ML low? = no ∧ ped = 45 ∧ ctime = 45 mdp = 45 ∧ data? = hmdata0, mdata1i memp = ∅ ∧ acquiring = no ∧ waiting = no memd = hmdata0i ∧ waitsignal = no addr? = 1 ∧ sending = no ∧ mode = COF
MemoryLoad SP 43 TCASE MemoryLoad SP 43 dumping = no ∧ mep = 2 ∧ ccmd = RM low? = no ∧ ped = 2 ∧ ctime = 2 ∧ mdp = 2 data? = ∅ ∧ memp = ∅ ∧ acquiring = no waiting = no ∧ memd = hmdata0i waitsignal = no ∧ addr? = 2 sending = no ∧ mode = COF
of a complex operation can be named with the identifier used in the Z model for that operation. Coming back to the EXP-OBDH case study, there are two data intensive operations: memory load and transmit data. Fastest yielded 28 and 20 test cases, respectively, for these operations. On the other hand, GTSC generates two test sequences ending in the execution of these operations. Then, the original 78 test cases generated by GTSC become 126, improving the original testing in about the 60%. Furthermore, there is not only an improvement in the number of test cases but also (a) in the chances to uncover errors in complex operations that would not be thoroughly tested by any method alone; and (b) in the fact that the test cases provided by Fastest give the exact input constants that must be provided to the IUT, thus augmenting the proportion of automatic steps of the testing process. The research methodology that we set before getting these results made the Z models unnecessarily complex because they describe not only those operations underspecified in the Statecharts model but also all the simpler and reactive ones. Now, we know that the Z model must describe only data intensive operations. In this way we can reduce both the effort and the size (complexity) of the Z model. For instance, the EXP-OBDH Z model is 608 ZLOC (Table 2) but only less than 241 are involved in the data intensive, underspecified operations. In other words, by writing a rather simple Z model we can notably increase the number of test cases and, more importantly, the functions, algorithms or functional alternatives that are not fully covered by the GTSC approach alone. It is worth to be mentioned that Statecharts can be used to model data-intensive systems, and, on the other hand, Z can be used to model reactive systems. Hence it would be possible to use only one approach, but we think it would be easier and more intuitive to combine both approaches as we have described in this section. VI. R ELATED WORK
After arriving at this point, an approach that combines both techniques emerged quite easily. We consider all the test sequences generated by GTSC that end in the execution of a data intensive, underspecified operation –with respect to the Statecharts model– and at that point we execute all the test cases generated by Fastest for that operation. For example, since the first GTSC test sequence written above does not terminate in the execution of a data intensive operation, then we do not execute any Z test case for it; however, we do execute 28 Z test cases for the second test sequence since it represents EXP loading its memory with a new program. In this way, the software is tested as a whole and every time it gets to a point where a complex data-intensive operation has to be executed, then this operation is fully tested too. Moreover, this method can be made automatic by simply using a convenient naming convention; for instance, in the Statecharts model, those states that correspond to the execution 5 Actually
they are not assignments but propositional equalities.
Our method has an advantage over [2] because it is based on two industrial-strength formal notations, one of them being part of the UML specification [26], and for which exist commercial and public-domain tools. On the other hand, Offut and Liu’s method is better than ours since they use only one notation to work on the same problem. An interesting discussion in [1] shows that the authors were not successful in comparing MBT with conventional testing techniques as they expected some strong studies while investigating MBT. However, the authors discuss some interesting aspects. For instance, reviews in the area of MBT showed that UML models stand out for object-oriented paradigm while for paradigm based on formal specification nonUML models stand out. They also pointed out that target domains were not mentioned and in such cases UML models were used. They warn that although this seems that UML models might be useful for any domain, a more detailed study should be conducted. Their study also hints that nonUML approaches were applied on safety-critical or embedded
systems. They point out that in spite of MBT appeal, training and corresponding costs are to be taken into consideration. Grieskamp et al. demonstrated the use of the agenda approach to support the systematic development of requirement specifications for a particular class of embedded safetycritical systems [27]. An agenda is a list of steps to be accomplished when carrying out some task in the context of software engineering. To this end, they used the µSZ notation which provides a combination of the Statemate languages [28] (Activity Charts and Statecharts), Z, and an extension of Z by temporal interval logic [29]. Basically, they used Statemate’s Activity Charts to represent process structure, Z to specify the data space of the process, and Statecharts to specify the dynamic behavior of the process. However, it is not clear whether agendas with their derived Z schemata and Statecharts models were developed to support Model-Based Testing. However, Hierons and others in [30] define a MBT technique for the µSZ notation. The main difference with our work is that we needed to develop a combined MBT methodology suitable for the tools each team already had. For instance, we had to combine a unit-testing oriented tool such as Fastest, with a system-testing oriented tool such as GTSC to get the best of them both. Also, by the nature of Hierons’ work they do not compare two MBT tools as we did. In his MSc. thesis [31] M¨akinen studied on how an organization can make use of model based approach for software testing by showing the financial benefits in adopting such approach. It compares the traditional testing with the MBT approach and concludes that there are, in fact, financial benefits to organizations by adopting MBT. Moreover, the MBT approach saves time in test execution. The case study was a user interface. However, the author suggests investigating other complex model representation if this approach is to be used to other software engineering levels. In [32] the authors briefly present the following models used in software testing: Finite State Machines, Statecharts, UML and Markov chains. They provide a detailed definition of FSM and discuss some aspects of MBT such as the importance of understanding the system to be tested and how to build a model besides generating tests and analyzing the results. They also point out some concerns to be considered on state explosion, coverage, oracle and automation. The paper suggests that MBT must not be considered as a “silver bullet” as several parameters (investment, skills, resources) in adopting such approach must be weighed before. VII. C ONCLUSIONS AND FUTURE WORK First, we have compared two MBT techniques and tools, and then we have shown how to combine those techniques to improve the testing of systems including both reactive and data intensive functions. The main conclusions of this article are: (a) it is rather easy and cost-effective to combine the approaches, and (b) that the combined approach could potentially uncover many errors that each technique alone cannot.
There is a lot of work to do in the future. First, we need to assess the amount of faults uncovered by the combined approach by applying, for instance, mutation analysis. In doing so, we can compare the combined methodology with respect to applying the individual methodologies developed so far. Second, we want to work on new case studies so we can apply what we have learned so far –for example, writing shorter Z models that efficiently complement the Statecharts model. Third, we want to integrate our tools so the whole process will be more automatic. R EFERENCES [1] A. D. Neto, R. Subramanyan, M. Vieira, G. H. Travassos, and F. Shull, “Improving evidence about software technologies: A look at modelbased testing,” IEEE Softw., vol. 25, no. 3, pp. 10–13, 2008. [2] A. J. Offut and S. Liu, “Generating test data from sofl specifications,” J. Syst. Softw., vol. 49, no. 1, pp. 49–62, 1999. [3] D. Harel, “Statecharts: A visual formalism for complex systems,” Science of Computer Programming, vol. 8, pp. 231–274, 1987. [4] J. M. Spivey, The Z Notation: A Reference Manual. Upper Saddle River, NJ, USA: Prentice-Hall, Inc., 1989. [5] S. Liu, A. J. Offutt, C. Ho-Stuart, M. Ohba, and Y. Sun, “Sofl: A formal engineering methodology for industrial applications,” IEEE Trans. Softw. Eng., vol. 24, no. 1, pp. 24–45, 1998. [6] V. Santiago, A. S. M. do Amaral, N. L. Vijaykumar, M. d. F. MattielloFrancisco, E. Martins, and O. C. Lopes, “A practical approach for automated test case generation using statecharts,” in COMPSAC ’06: Proceedings of the 30th Annual International Computer Software and Applications Conference. Washington, DC, USA: IEEE Computer Society, 2006, pp. 183–188. [7] V. Santiago, N. L. Vijaykumar, D. Guimar aes, A. S. Amaral, and E. Ferreira, “An environment for automated test case generation from statechart-based and finite state machine-based behavioral models,” in ICSTW ’08: Proceedings of the 2008 IEEE International Conference on Software Testing Verification and Validation Workshop. Washington, DC, USA: IEEE Computer Society, 2008, pp. 63–72. [8] A. M. Ambrosio, M. de F´atima Mattiello-Francisco, V. A. Santiago, W. P. da Silva, and E. Martins, “Designing fault injection experiments using state-based model to test a space software,” in LADC, 2007, pp. 170–178. [9] D. P. Sidhu and T.-k. Leung, “Formal methods for protocol testing: A detailed study,” IEEE Trans. Softw. Eng., vol. 15, no. 4, pp. 413–426, 1989. [10] S. Pimont and J.-C. Rault, “A software reliability assessment based on a structural and behavioral analysis of programs,” in ICSE ’76: Proceedings of the 2nd international conference on Software engineering. Los Alamitos, CA, USA: IEEE Computer Society Press, 1976, pp. 486–491. [11] A. Petrenko and N. Yevtushenko, “Testing from partial deterministic fsm specifications,” IEEE Trans. Comput., vol. 54, no. 9, pp. 1154–1165, 2005. [12] R. V. Binder, Testing object-oriented systems: models, patterns, and tools. Boston, MA, USA: Addison-Wesley Longman Publishing Co., Inc., 1999. [13] S. R. S. Souza, “Validao de especificaes de sistemas reativos: Definio e anlise de critrios de teste,” Ph.D. dissertation, Instituto de F´ısica de S˜ao Carlos, Universidade de S˜ao Paulo, 2000. [14] P. C. Masiero, J. C. Maldonado, and I. G. Boaventura, “A reachability tree for statecharts and analysis of some properties,” Information and Software Technology, vol. 36, no. 10, pp. 615–624, October 1994. [Online]. Available: http://dx.doi.org/10.1016/0950-5849(94)90021-3 [15] P. Stocks and D. Carrington, “A Framework for Specification-Based Testing,” IEEE Transactions on Software Engineering, vol. 22, no. 11, pp. 777–793, Nov. 1996. [16] P. Stocks, “Applying formal methods to software testing,” Ph.D. dissertation, Department of Computer Science, University of Queensland, 1993. [17] I. Maccoll and D. Carrington, “Extending the Test Template Framework,” in Proceedings of the Third Northern Formal Methods Workshop, 1998. [18] Fastest, “http://www.flowgate.net/?lang=en&seccion=herramientas.”
[19] Community Z Tools, http://czt.sourceforge.net. [20] P. Malik and M. Utting, “CZT: A Framework for Z Tools,” in ZB. Lecture. Springer, 2005, pp. 65–84. [21] ISO, “Information Tchnology – Z Formal Specification Notation – Syntax, Type System and Semantics,” International Organization for Standardization, Tech. Rep. ISO/IEC 13568, 2002. [Online]. Available: http://standards.iso.org/ittf/PubliclyAvailableStandards/c021573 ISO IE C 13568 2002(E).zip [22] P. Clements, D. Garlan, L. Bass, J. Stafford, R. Nord, J. Ivers, and R. Little, Documenting Software Architectures: Views and Beyond. Pearson Education, 2002. [23] M. Utting and B. Legeard, Practical Model-Based Testing: A Tools Approach. San Francisco, CA, USA: Morgan Kaufmann Publishers Inc., 2006. [24] A. Paradkar, “Case studies on fault detection effectiveness of model based test generation techniques,” in A-MOST ’05: Proceedings of the 1st international workshop on Advances in model-based testing. New York, NY, USA: ACM, 2005, pp. 1–7. [25] A. Sinha, C. E. Williams, and P. Santhanam, “A measurement framework for evaluating model-based test generation tools,” IBM Systems Journal, vol. 45, no. 3, pp. 501–514, 2006. [26] Object Mangement Group, “Unified modeling language – resource page,” http://www.uml.org. [27] W. Grieskamp, M. Heisel, and H. Drr, “Specifying embedded systems with statecharts and z: an agenda for cyclic software components,” Science of Computer Programming, vol. 40, no. 1, pp. 31 – 57, 2001. [28] D. Harel, H. Lachover, A. Naamad, A. Pnueli, M. Politi, R. Sherman, A. Shtull-Trauring, and M. Trakhtenbrot, “Statemate: A working environment for the development of complex reactive systems,” IEEE Transactions on Software Engineering, vol. 16, no. 4, pp. 403–414, 1990. [29] R. B¨ussow and W. Grieskamp, “Combining z and temporal interval logics for the formalization of properties and behaviors of embedded systems,” in LNCS, Advances in Computing Science - ASIAN’97, vol. 1345, 1997, pp. 46–56. [30] R. M. Hierons, S. Sadeghipour, and H. Singh, “Testing a system specified using statecharts and z,” Information and Software Technology, vol. 43, no. 2, pp. 137–149, February 2001. [Online]. Available: http://dx.doi.org/10.1016/S0950-5849(00)00145-2 [31] M. A. M ”akinen, “Model based approach to software testing,” Master’s thesis, Department of Electrical and Communications Engineering Networking Laboratory, Helsinki University of Technology, 2007. [32] I. El-Far and J. Whittaker, Encyclopedia of Software Engineering. John Wiley & Sons, 2001, ch. Model-Based Software Testing, pp. 825–837. [33] A. O. Arantes, N. L. Vijaykumar, V. Santiago and D. Guimar˜aes. WEB-PerformCharts: A Collaborative Web-based tool for Test Case Generation from Statecharts. In Proc. of the 10th International Conf. on Information Integration and Web-based Applications & Services (iiWAS), 2008, Linz, Austria, pages 374–381. [34] V. Santiago, M. F. Mattiello-Francisco, R. Costa, W. P. Silva, and A. M. Ambrosio. QSEE Project: An Experience in Outsourcing Software Development for Space Applications. In SEKE ’07: Proc. of the 19th Intl. Conf. on Softw. Engineering & Knowledge Engineering, pages 51–56, Skokie, IL, USA, 2007. Knowledge Systems Institute Graduate School.