Feb 21, 2011 - help desk calls from end users. It is estimated that .... architecture (replicated copies of web, application, and data base servers), and different ...
On Computing Enterprise IT Risk Metrics Sandeep Bhatt, William Horne, Prasad Rao HP Laboratories HPL-2011-26
Abstract: Assessing the vulnerability of large heterogeneous systems is crucial to IT operational decisions such as prioritizing the deployment of security patches and enhanced monitoring. These assessments are based on various criteria, including (i) the NIST National Vulnerability Database which reports tens of thousands of vulnerabilities on individual components, with several thousand added every year, and (ii) the specifics of the enterprise IT infrastructure which includes many components. Defining and computing appropriate vulnerability metrics to support decision making remains a challenge. Currently, several IT organizations make use of the CVSS metrics that score vulnerabilities on individual components. CVSS does allow for environmental metrics, which are meant to capture the connectivity among the components; unfortunately, within Section 2.3 of [1] there are no guidelines for how these should be defined and, consequently, environmental metrics are rarely defined and used. We present a systematic approach to quantify and automatically compute the risk profile of an enterprise from information about individual vulnerabilities contained in CVSS scores. The metric we propose can be used as the CVSS environmental score. Our metric can be applied to the problem of prioritizing patches, customized to the connectivity of an enterprise. It can also be used to prioritize vulnerable components for purposes of enhanced monitoring.
External Posting Date: February 21, 2011 [Fulltext]
Approved for External Publication
Internal Posting Date: February 21, 2011 [Fulltext]
To be published and presented at IFIP SEC 2011: Future challenges in security and privacy for academia and industry, June 2011
Copyright IFIP SEC 2011: Future challenges in security and privacy for academia and industry, 2011
On Computing Enterprise IT Risk Metrics Sandeep Bhatt and William Horne and Prasad Rao Cloud and Security Lab HP Laboratories 5 Vaughn Drive, Princeton NJ 08540, USA {sandeep.bhatt,william.horne,prasad.rao}@hp.com
Abstract. Assessing the vulnerability of large heterogeneous systems is crucial to IT operational decisions such as prioritizing the deployment of security patches and enhanced monitoring. These assessments are based on various criteria, including (i) the NIST National Vulnerability Database which reports tens of thousands of vulnerabilities on individual components, with several thousand added every year, and (ii) the specifics of the enterprise IT infrastructure which includes many components. Defining and computing appropriate vulnerability metrics to support decision making remains a challenge. Currently, several IT organizations make use of the CVSS metrics that score vulnerabilities on individual components. CVSS does allow for environmental metrics, which are meant to capture the connectivity among the components; unfortunately, within Section 2.3 of [1] there are no guidelines for how these should be defined and, consequently, environmental metrics are rarely defined and used. We present a systematic approach to quantify and automatically compute the risk profile of an enterprise from information about individual vulnerabilities contained in CVSS scores. The metric we propose can be used as the CVSS environmental score. Our metric can be applied to the problem of prioritizing patches, customized to the connectivity of an enterprise. It can also be used to prioritize vulnerable components for purposes of enhanced monitoring.
1
Introduction
Deciding which subsystems within a large enterprise system should be prioritized for patching or should be monitored more closely is an art. Patching involves more than the deployment of a patch, which is itself a non-trivial task. It also involves assessing the risks of a vulnerability; planning, scheduling, testing and qualifying the patches in a staging environment; and finally assembling the resources needed for deployment, and for handling patch distribution failures and help desk calls from end users. It is estimated that every patching event costs anywhere between 0.0025 and 0.5513 person hours per system [3]. For large organizations with many tens of thousands of systems to be managed, the cost of security patch management can be excessive.
As a result, organizations cannot address every known vulnerability, but rather must prioritize them, based on the risk they pose to the enterprise. How should an IT organization assess the risk posed by component vulnerabilities? The key concern is to design a rational risk assessment scheme that can be automated. Several IT organizations, prioritize security patches using the Common Vulnerabilities and Exposure (CVE) system. CVE is a system for disseminating vulnerability information against various types of IT assets. CVE reports are coupled with a set of metrics defined by the Common Vulnerability Scoring System (CVSS). CVSS includes a base score, which rates the vulnerability in isolation. CVSS also specifies environmental metrics intended to allow organizations to account for the relevance of the vulnerability in their environment. Unfortunately within Section 2.3 of [1], there are no guidelines to develop environmental metrics and so they are rarely, if ever, used. The risk presented by a component vulnerability depends on the context in which the component is used, as well as the location of the component within the enterprise topology. A component with a severe vulnerability in an isolated part of a network that has little relevance to business operations may not pose as much risk as a component with a mild vulnerability, but which plays a critical role in an important business service. A second deficiency of the CVSS metrics is that it does not account for multi-stage attacks which exploit vulnerable components to launch attacks on components deeper within the network that are not directly accessible to the attack source. Our goal is to utilize the CVSS base scores to define and compute environmental metrics for components within an enterprise. The requirement is that the metric be intuitive and efficiently computable. The metric we define in this paper meets both requirements and captures both the difficulty of launching an attack on a component, and the impact that a successful attack can have by opening up exploits on components downstream from the component. We demonstrate scalable algorithms to compute our metrics, and give examples on enterprise-scale networks with several thousand components. Our metrics can be used to prioritize vulnerabilities, so that system administrators need focus only on those vulnerabilities that have the most significant impact on their business. Additionally, our methods can also be used for “what-if” analyses to track changes in security levels as changes are made to applications and networks.
2
Related Work
A number of recent papers address the problem of evaluating network vulnerability. The closest work in spirit to ours is the NetSpa system [4, 5]. Similar to our approach, NetSpa also computes the reachability matrix of a network, albeit using somewhat different techniques. The main difference is our definition of the impact metric based on least-effort attack paths which captures multi-stage attacks in an intuitive manner.
Singhal and Ou [10] suggest treating exploit metrics, such as CVSS scores, as probabilities, but does not define an associated probability space, nor does it justify assumptions in treating these metrics as probabilities. We interpret the CVSS exploitability score from Section 3.2.1 of [1](not Section 2.2.1) as a measure of effort rather than as probabilities, the latter being hard to justify for various reasons. While we remain agnostic about the validity of the CVSS scoring scheme itself, we take the operational view that since many IT organizations are comfortable with the CVSS scores, it makes sense to build on them. Less closely related is the work on efficient generation of attack graphs [6–10]. These do not, however, explicitly model network router and firewall configurations to calculate the end-to-end reachability matrix, and do not focus on the problem of defining an aggregate impact metric. A number of vendors, such as Qualys Guard, Red Seal Systems, and Skybox offer vulnerability assessment products. Some of the publicly available literature on these products claim to use “attack paths” in their assessment calculations, but beyond that it is unclear exactly how their methods work.
3
Defining environmental metrics
We build on the CVSS metrics; our innovation is that our metrics also account for the topological interconnections between components within the enterprise network. This builds on previous work [2]. Another innovation of our work is that we account for the possibility of multistage attacks. An attacker can launch an attack on any component if it has end-to-end connectivity to the component. Once a component vulnerability has been exploited and root access gained on the underlying machine, the attacker can launch further attacks inside the enterprise. Such multi-stage attacks can have devastating impact because exploited machines deep within the network generally have greater network connectivity to internal machines than available directly to the attacker. Each application component can have multiple vulnerabilities. For each vulnerability, CVSS assigns an exploitability metric that captures the level of difficulty of exploiting the vulnerability. For this paper, we scale the CVSS exploitability metric to a number in the range [0,1]; smaller exploitability scores indicate a less easily exploited vulnerability while a higher value indicates a more easily exploited vulnerability. In addition, we require that every component application be assigned a criticality metric by an IT administrator; this metric can, for example, be based on the relative criticality of business services that depend on this component. For example, a service, such as corporate email service, a corporate portal, or a general ledger system is made up of multiple applications. Our assumption is that an IT organization can assign a criticality metric to each of the services it provides that reflects the business priorities of the business functions supported by each service. For example, we may determine that the accounts receivable
service is more important than the employee portal. Identifying services and their associated priorities must be done manually by IT and business units. We assume that the criticality metric is a number 0 or greater; larger criticality scores indicate components that are more critical to the enterprise. 3.1
Exposure and Impact
For any component within an enterprise, there are two fundamental metrics that we wish to capture: – Exposure: how easy is it for the adversary to exploit the component vulnerability? – Impact: what is the aggregate criticality of all the vulnerabilities that can be exploited by the adversary? To measure the exposure of a component, we consider all possible attack paths from the adversary to the component. In order to do this, we first compute the reachability graph of the enterprise. Our abstract graph-theoretic model of an enterprise includes a node < a, m > for every application component a deployed on a machine m. We include a directed edge from node < a, m > to every node < a0 , m > corresponding to applications that share the same underlying machine. We also include directed edges from < a, m > to < a0 , m0 > if the port corresponding to application a0 on machine m0 is reachable from machine m within the network. This calculation is enabled by previous work, for example [2] which demonstrated how all end-toend connectivities can be computed efficiently from the configurations of network routers and firewalls. Reachability calculations along similar lines, with some minor differences, also appear in [4, 5]. Each component a can have multiple vulnerabilities. Let Ei,a,m denote the CVSS exploitability score for vulnerability i that is associated with component a and deployed on machine m. We define the quantity Wi,a,m = 1/(Ei,a,m + �), where � > 0 is chosen to be extremely small (essentially to rule out the possibility of division by 0). The quantity Wi,a,m can be interpreted as the work required of an adversary to exploit the vulnerability, assuming that the adversary has direct access to the vulnerable application. When the adversary does not have direct access to a component, it may still have indirect access. The attacker can launch an attack on any component if it has end-to-end connectivity to the component. Moreover, once a component vulnerability has been exploited and root access gained on the underlying machine, the attacker can launch further attacks inside the enterprise. Such multi-stage attacks can have devastating impact because exploited machines deep within the network generally have greater network connectivity to internal machines than available directly to the attacker. We capture multi-stage attacks as paths in our graph from the adversary to the component. In this paper we restrict attention to vulnerabilities whose successful exploit results in privilege escalation, i.e., root access. Thus, an adversary
can launch an indirect, multi-stage attack by attacking components one-by-one along the path. Of course, launching multi-stage attacks requires additional work, and our goal is to capture the extra work in an intuitive way. Consider a path p = v0 , ...vk from the adversary v0 to a component vk . Let Wi be the work required of the adversary to successfully exploit component vi when he has direct access to vi . We define Wp the work required along path p as: Wp = W1 + cW2 + c2 W3 + · · · + ck−1 Wk , where c > 1 is a constant amplification factor. The amplification factor captures the additional step in a multi-stage attack amplifies the work of an adversary to attack downstream nodes. The intuition behind path weight is that the likelihood of a multi-stage attack depends not only on the exploitability of the intermediate nodes, but also on the length of the path; multi-stage exploits need to be much more sophisticated, and therefore require more work, to succeed. Next, we define the exposure of a component vk as exp(vk ) = min1p Wp , the minimum work path, over all paths from the adversary to the component. This captures the intuition that any component is as exposed as the weakest attack path to it from the adversary. Note that the exposure metric can be efficiently computed for large networks using well-known shortest path algorithms. Finally, the impact of an adversary on a network is defined as X I(A, N ) = exp(v) ∗ C(v), v:nodes∈N
where C(v) is the criticality of node v. Using this measure as opposed to Collateral Damage Potential in Section 2.3.1 of CVSS [1] has the advantage of accounting for multistage attacks. 3.2
An application: Prioritizing patches
Suppose that we have computed the exposure of all nodes in a network, and the impact of an adversary. How do we use these metrics to prioritize vulnerable components for patching? A simple method is to compute, for each patch, the reduction in adversarial impact if the patch were applied. This requires recalculating all the shortest paths and adversarial impact for each patch, and choosing the one which reduces the impact by the largest amount. This process can be iterated in a greedy manner to prioritize all patches. Besides prioritizing patches, the metrics can also be used to evaluate alternative designs to update the network and applications.
4
Experimental Results
We have implemented our techniques above; specifically, in addition to algorithms for computing the metrics outlined, we automatically scrape CVSS feeds
to gather exploitability metrics used in our calculations. On networks with several thousand nodes, the algorithm to compute the metrics take under one minute. This supports our view that our techniques can be useful for performing what-if analyses as part of change management planning, and for re-evaluating risks in response to new CVE reports in real time. We have also run tests, described below, to validate that the scoring functions are consistent with intuition. In an initial test on a simplified scenario, the metrics indicated that a component with lower CVSS vulnerability was given higher patching priority than another component with a higher CVSS score. This was indeed correct, as the component with lower CVSS score was easier to exploit and, unlike the other component, was upstream of critical components. 4.1
Network Description
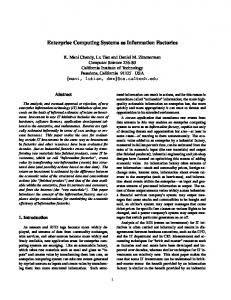
The networks we tested our ideas on were synthetically generated from a template; the topology and applications were designed to be representative of large enterprise networks. The network template has components consisting of one adversary, and endusers connected to a mirrored infrastructure. Each mirror consists of a 3-tier architecture (replicated copies of web, application, and data base servers), and different categories of administrator machines connected via a separate administrator network. The number of end-users, mirrors, and administrators and servers within each mirror are parameterized so we can easily scale the sizes of the networks for our purposes. For example, for the experiments reported here, each mirror site consisted of fifty data base servers, twenty five application servers (ASA, ASB), and twenty five web servers(WSA, WSB). These mirrors were administered by three categories of administrators with ten(admS), twenty(admDb) and five machines(admAll) respectively. The number of end-users was one thousand. A schematic diagram of the network is depicted in Figure 1. The network has three compartments: (a) the end-users network, (b) the infrastructure network and (c) the administrative network. The connectivity (number of reachable pairs) between nodes varied by experiment; a typical set of numbers is shown in Table 1. In this table each cell (other than in the first row or first column) contains the number of edges that connect the source component(the first cell of its row) with the destination component (first cell of its column). For a fixed choice of the connectivity matrix, we generated 25 test networks, with randomly chosen edges according to the connectivity requirements. Thus, each data point in our result corresponds to 25 runs.
This network schema is meant to represent the network structure of a medium size enterprise. It captures the kind of compartmentalization and connectivity encountered in in-house networks. The connectivity numbers can be adjusted as desired. The adversary is a single node with connectivity to the internal parts of the enterprises – all of them, and varied by experiment.
Fig. 1. Schema for synthetic experimental networks.
4.2
Experimental Approach
Our goal is to validate our metric by showing that the formalism yields plausible results for a variety of networks that resemble enterprise networks under our assumptions about how malware propagates and how critical administration deem their resources such as server and end user machines to be. In particular we want to show that the downstream impact of the adversary varies with respect to input parameters in a manner consistent with our intuition. The specific question we address is: how many end-user machines must an adversary be able to directly exploit in order to have the same impact that he can achieve by exploiting one web server directly? The experiment was to measure the downstream impact of varying the number of edges from the adversary to (a)end user machines versus (b) web servers. This experiment was carried out for various average values of exploitability of end user machines and various average values of exploitability of web server machines. In generating our networks we specified the average criticality of different component types. For example, while the average criticality of an end user node was 0.202, individual end user node criticialities deviated from the mean randomly. For completeness, the criticalities of all the component types were set
End WSA WSB ASA ASB DBA DBB admS admDb admAll Users Adversary 1 - 10 1-10 1-10 1 EndUsers 100k 40k 40k 1k 1k WSA 500 50 50 50 50 50 WSB 500 50 50 50 50 50 ASA 250 50 250 50 200 25 ASB 50 250 50 250 200 25 DBA 250 50 250 50 200 25 DBB 50 250 50 250 200 25 admS 2000 500 500 50 50 5 admDb 1000 500 500 10 50 5 admAll 5000 125 125 125 125 250 250 100 50 25 Table 1. Typical connectivities for the synthetic test networks.
as follows – endUsers:0.20239, WSA:85.68, WSB:85.44, ASB:83.56, ASA:86.0, DBA:843.6, DBB:848.8, adminDB:677.0, adminS:724.0, adminAll: 743.0. ) Thus, for example, the average web server was 425 times more critical than an end user node. Choosing different numbers affected the magnitude, but not the nature of the results. We carried out two series of experiments – one in which the number of edges from the adversary to the end user was varied in steps of 100 and another in which the number of edges between the adversary to the web servers was added in steps of 2. In Figure 2(a) the average user exploitability takes values from the set {0.01, 0.21, 0.29, 0.42. 0.63, 0.76}. In Figure 2(b) the average web-server exploitability takes the values from the set {0.002, 0.133, 0.26, 0.47, 0.67, 1.0}. As noted earlier, for each choice of parameters and connectivity, we computed the metrics over 25 networks generated at random according to the connectivities chosen. For running the experiments we chose c = 1.25. Changing the value of c between 1.1 and 1.75 did not significantly alter the nature of the results. 4.3
Results and their interpretation
The graphs in Figure 2 show how increasing the exposure of web servers has much greater impact than increasing the exposure of end user nodes. Each experiment was run 25 times with the edges between the adversary and web-servers or enduser machines generated at random. Each dot in the figure is actually a composite of twenty five values, one from each run. In the first graph the impact saturates. This can be explained by the fact that end user nodes are not particularly highly connected. The advantage gained by the adversary by connecting to more end users quickly tapers off. On the other hand web servers are well connected and hence the impact scales linearly. The graphs can also answer the question: How much should the average vulnerability of a web-server be decreased in order to bound adversarial impact
in case of a web server compromise to a desired level? From these figures it can be seen that to have the same downstream impact as increasing the connectivity between the web server and the adversary by about ten connections, it takes roughly two orders of magnitude of increased connectivity between the adversary and the end users. This is in line with our intuitive expectations. Firstly, the web servers are more critical. Secondly, they are well connected to other critical components such as application servers and database servers. Thus our metric quantifies the advantage the adversary gains by connecting to web servers as opposed to end users.
(a)
(b)
Fig. 2. Changes in downstream impact of adversary as a result of changing the number of edges from the adversary to (a)End user machines and (b) Web servers. The implicit family of curves in (a) and (b) represent the effect of changing average exploitability – in (a) the average user machine exploitability takes values from the set {0.01, 0.21, 0.29, 0.42. 0.63, 0.76}, and in (b) the average web server exploitability takes values from the set the set {0.002, 0.133, 0.26, 0.47, 0.67, 1.0}.
Conclusions In this paper we proposed a new way to define the CVSS environmental metric. The definition we propose can be efficiently computed, and the experiments show that the metric behaves in an intuitive way as network parameters are varied. Further evaluation on large-scale production networks is needed to see if these ideas can be fruitful in practice. In the future, we anticipate that such metrics could be computed by integrating the analysis algorithms (reachability and metric evaluation) with an asset management system such as a Universal CMDB (Common Management Data Base), to get access to each of the components and their configurations,and with CVE feeds, for example from the National Vulnerability Database.
References 1. Common Vulnerability Scoring System. http://www.first.org/cvss/ cvss-guide.html. 2. Sruthi Bandhakavi, Sandeep Bhatt, Cat Okita, and Prasad Rao. End-to-end network access analysis. In HP Laboratories Technical Report HPL-2008-28R1. HP Labs, 2008. 3. T. Forbath, P. Kalaher, and T. O’Grady. The total cost of security patch management. Technical report, Wipro Technologies, 2005. Available at http: //wipro.com/webpages/insights/security_patch_mgmt.htm. 4. Kyle Ingols, Matthew Chu, Richard Lippmann, Seth Webster, and Stephen Boyer. Modeling modern network attacks and countermeasures using attack graphs. In ACSAC ’09: Proceedings of the 22nd Annual Computer Security Applications Conference, Washington, DC, USA, 2009. IEEE Computer Society. 5. Kyle Ingols, Richard Lippmann, and Keith Piwowarski. Practical attack graph generation for network defense. In ACSAC ’06: Proceedings of the 22nd Annual Computer Security Applications Conference, pages 121–130, Washington, DC, USA, 2006. IEEE Computer Society. 6. S. Noel and S. Jajodia. Optimal ids sensor placement and alert prioritization using attack graphs. In Journal of Network and Systems Management, vol. 16, 2008. 7. Xinming Ou, Wayne F. Boyer, and Miles A. McQueen. A scalable approach to attack graph generation. In CCS ’06: Proceedings of the 13th ACM Conference on Computer and Communications Security, pages 336–345, New York, NY, USA, 2006. ACM. 8. J. Pamula, S. Jajodia, P. Ammann, and V. Swarup. A weakest-adversary security metric for network configuration security analysis. In 2nd ACM Workshop on Quality of Protection. ACM Press, 2006. 9. R.E. Sawilla and X. Ou. Identifying critical attack assets in dependency attack graphs. In 13th European Symposium on Research in Computer Security (ESORICS). Springer, 2008. 10. Anoop Singhal and Xinming Ou. Techniques for enterprise network security metrics. In Cyber Security and Information Intelligence Research Workshop, New York, NY, USA, 2009. ACM.