University of Kent at Canterbury,. England, UK, CT2 7NF. Abstract. Visualization enables 'seeing the unseen', and provides new insight into the underlying data.
On Encouraging Multiple Views for Visualization Jonathan C. Roberts Computing Laboratory, University of Kent at Canterbury, England, UK, CT2 7NF Abstract Visualization enables ‘seeing the unseen’, and provides new insight into the underlying data. However, users far too easily believe or rely on a single representation of the data; this view may be a favourite method, the simplest to perform, or a method that has always been used! But, a single representation may generate a misinterpretation of the information or provide a situation where the user is missing the ‘richness’ of the data content! By displaying the data in multiple ways a user may understand the information through different perspectives, overcome possible misinterpretations and perform interactive investigative visualization through correlating the information between views. Thus, the use of multiple views of the same information should be encouraged. We believe the visualization system itself should actively encourage the generation of multiple views by providing appropriate tools to aid in this operation. We present and categorise issues for encouraging multiple views and provide a framework for the generation, management and manipulation of such views.
1 Introduction and Motivation Multiple views, or Multiform visualization [7], represent different ways of looking at the same information. The various representations enable the user to interpret the information from different perspectives, thus gaining a better understanding of the underlying information. It is possible and useful to overlay the different visual representations in one viewport. This hybrid rendering style is widely used: merging (say) volume rendered images with isosurfaces [8], or overlaying translucent spaces [9]. This layering of information, as mentioned by Tufte [17], may enhance and clarify the visualization. But conversely, information may be obscured or additional information assumed. Some problems occur when too much information is presented in one view: increasing irrelevant detail and confusing the final realization; other problems occur through how the user interprets and perceives the information. Thus, there is much to gain from splitting the information into multiple views.
Separate views of the same or similar information are useful to both individual users and multiple participants. The focus in this paper is the generation of multiple views for a single user. However, similar issues arise in collaborative visualization, with many participants, and multiple views being displayed and controlled across disparate clients, see for example, Wood et al [21]. It is also true that many visualization systems [1, 4, 19, 18, 23] display the data in multiple forms. However, although they do allow multiple views, we believe the systems do not actively encourage their use. For example, to add another view of the same data, multiple modules and connections are required. Thus, ‘to encourage’ multiple views the system should provide mechanisms enabling them to be easily generated, manipulated and managed. We use a cooking metaphor to discuss how to encourage the user to generate multiple views, that forms the basis of our framework. We then flesh out the framework to provide a working model, and describe some results using an implementation of this model.
2 How to encourage Consider this, if I were to encourage you to bake some cakes, then you would need to find a recipe that matched the given ingredients, you would then follow the instructions to generate the finished cake. If I now request you to make another, and yet another cake, you may turn round and say that you’re satisfied with the first cake, and eat it! However, if I had already weighed out the ingredients, for all the cakes, you may be more easily convinced to bake additional cakes. This metaphor may be used to describe the visualization process: the ingredients as the scientific data, with the recipe-book, cooking utensils and oven as the visualization system and the chef as the visualizer. We use this metaphor to aid in the development of an appropriate framework that encourages multiple views for visualization.
2.1 Information grouping A first observation from this metaphor is that it is easier to generate multiples by grouping the operations together. Within the cooking metaphor we both batched the ingredients together and batched the cooking together.
Likewise within visualization, this ‘batching’ may occur: 1. at the display stage: grouping the rendering operations together, such as described by Yagel et al [22] who, within the area of fluid dynamics, group four volume renderers to generate low quality to high quality images of the same data; or 2. at the mapping stage by applying the same colourmap to multiple views, for example; or 3. at the filter stage by grouping like data elements together into subsets. For example, Silver [16] segments the data into groups named objects to simplify and enable the data to be tracked as it evolves and moves throughout time.
2.2
Automatic generation
Our baking metaphor suggests that if the ingredients are pre-weighed then the cook is more likely to bake more cakes. Similarly, if some of the effort is taken away from replicating the visualization processes then the user would generate more coincident views. For example, to generate a new view of some selected information, the display method could be abbreviated to just ‘choosing the required visualization method’; for example, default (or pre-calculated) values could be used to generate an appropriate colourmap, or to generate a surface around some objects in a scene. Taking this automation to the extreme, a visualization may be automatically generated by the system, from a list of ordered and user preferenced variables, such as used within Vista [15] and Graphical presentations [10], for example.
2.3
Consistency
Another observation from our baking metaphor, is that we would require that the cakes were baked in the same conditions: that they were all cooked to the same standards. Likewise, there needs to be consistency among the views: that each view is kept up-to-date and the information content, relating objects between views, is kept consistent; for example the size and colour of the objects in each view need to appropriately match with corresponding views. Moreover, the batching or grouping operation aids consistency, by allowing one copy of the dataset, segmentation, mapping to be used for any number of views. When for example, this grouped data is altered corresponding views of this information would need to be updated.
2.4
Correlation
When the cakes, in the metaphor, are evaluated (tasted) it would be useful to compare similarities between cakes or slice the cakes into similar sized portions. Thus, correlating information between views is useful.
Within visualization the information may be correlated by matching data-elements [20] or landmarks [16] between views or manipulating the objects or viewing parameters, using direct manipulation. This enables objects and information, in one view, to be selected or brushed [2, 11] with the highlight action being mimicked in corresponding views.
2.5 Viewpoint management The cook, in the metaphor, may be directed by the recipe book to organise the menu and prepare the cakes. Likewise, within visualization it is the role of the visualization system to aid, manage or direct the visualizer to generate results.
Map
Filter Data
Feature set
Display Abstract Visualization Object (AVO)
Image
Figure 1: Traditional Data flow Model Many visualization systems follow the dataflow model, Figure 1 (Upson et al [18] and Haber and McNabb [5]). Here the visualization process is treated as a pipeline of commands: the data is filtered, to create a subset of the data, which is then mapped into a representation which can be displayed. The user connects together modules, representing different stages in the paradigm, to generate the desired visualization. New views of the data may be easily generated by altering parameter settings on the modules, thus replacing the current realization with one generated by the new parameter settings. This is the approach used in may popular visualization systems [1, 19, 18]. An alternative method is to display the visualization, when the parameter values are altered, in a new viewport. Now, from observation we can see that the parameter values may be altered at any of the three stages of the pipeline. Different visualizations may be formed through changing the data being filtered and selected; by changing the applied geometry or colourmap, at the mapping stage; or by adapting the display projection itself. Therefore, by taking this idea to its extreme, we may draw a graph representing possible multiple views, Figure 2, where a particular route through the graph represents a specific visualization. This multiplicity situation is similar to the experiment timeline used in the GRASPARC system [3], and for encouraging multiple views it is suitable to adopt this style of process, as the views may represent the history of experimentation. However, users would get frustrated if many visualizations were generated at the slight alteration of a parameter, so in practice a mixture of visualization replacement and replication is required. In fact, to do the ‘replica-
A
3.1 Fleshing out information grouping
Sam Dat e ase t
B
Sam Filte e ring
Sam map e ping
First, from Figure 2 we group the bounded region ‘B’ into one module to provide a container for a feature-set, see Figure 4. Now, every display that is generated from this module would be of the same feature-set, we name this module a render group. This module must also include controls to adapt how the information is mapped. Second, the feature-set data may be further segmented to generate a new subset that may be additionally filtered. Therefore, we can generate a data-hierarchy and explore the data by filtering the information into subsets. To do this, a subset of the data is chosen that is used to make a subdataset (a new feature-set). Thus the render-group module includes controls to input, select a subset and output the chosen information as a new feature-set, Figure 4. Data
Figure 2: Schematic showing how different views may be depicted as paths through a graph. The bounded regions on the graph represent ‘groups’ of like information.
Filter operation Feature set
Filter
Map
Display
Data
Image 1
Map, Display
Image 2
1
2
3 ... n
Render Group
Figure 3: Multiple views of the same data, generated through different filter and selection operations.
Select a subset Subset
tion’ method within a dataflow module-based system, modules need to be duplicated and connected appropriately. For example, a different filtering would require additional map and display modules, Figure 3. Thus to encourage more views of the same information, some of the overheads, such as, replicating and connecting modules need to be reduced. Incidentally, when the visualizations are overlayed it is easy to see how one view relates to another rendering: there is an implicit correlation. However, by displaying the data in separate views this implicit correlation is reduced, and more explicit correlation should be used. Thus, the use of multiple views is much more than just providing tools to display the data in multiple ways – it is more about managing the creation of views and correlating how information is related between views and between the user interface.
Figure 4: The render-group module: realizations generated from this module represent visualizations of the same feature set. Moreover, we may depict this data-hierarchy as a graph, Figure 5, this is similar to our previous graph in Figure 2, but now we explicitly describe that the multiple views reside horizontally and the data-subsets may be depicted vertically. Therefore, to explore the data, first, the user filters the data into objects of interest generating a feature-set. Second, the information may be displayed in multiple visualizations. Third, portions of the data may be selected and output to generate a new sub feature-set, that may be further group-visualized and filtered.
3.2 Fleshing out automatic generation
3 Fleshing out the framework We use and extend the above framework into a visualization exploration model, subdividing this section into the above same categories.
By using the render-groups, the user may simply select the desired visualization method and the requested realization is displayed. To do this, the data must be organised to allow different visualization methods to be used. We use
3.5 Fleshing out management Multiple views
Data subset
Figure 5: The exploration process as a hierarchy of data filterings and multiple views a data-abstraction method similar to Silver [16], where the data is filtered into objects, and each data element within an object is a neighbour to another element contained within that object [13]. Thus, the rendering methods may operate on the group information or the individual data elements. The system may be organised to generate a display of any feature-set by simply requesting the type of visualization [14].
3.3
The equivalent tree structure A
Fleshing out consistency
B
Right most node
A B
G
Align
nt
re
C
E
D
F
C
H
I
G
Pa
Consistency, as stated by Zhuge et al [24], may occur at the data, view and multiple view stages. The data and view consistency parts may be managed by the rendergroup module, where appropriate changes are relayed to a render-group manager to update related views. The management of the multiple views in relation to the visualization exploration is handled by the canvas-manager, see section 3.5 below.
3.4
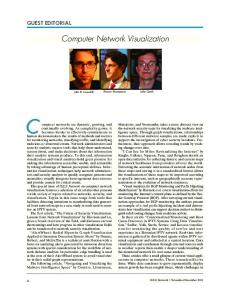
The user-management is the final part of the model. We name this operation the canvas manager. This manager controls the data-exploration hierarchy and the relation of the multiple displays to the exploration-canvas. Each new view is displayed within a new window. But, displaying many windows simultaneously could easily clutter the screen-space and confuse the user as to ‘which image relates to which data-instance’. Therefore, each window is labelled, relating the window to its respective module on the canvas. Windows may be iconised and deiconised using buttons on the canvas. Understanding the relationship of the data hierarchy is important to controlling the data subsets. Thus, we propose that the parent-child hierarchy is itself visualized through the layout of the modules on the canvas. The system enforces the module layout, taking responsibility from the user. Our layout algorithm displays the hierarchy as an aligned tree of nodes, see Figure 6. For example, the root node ‘A’ has child nodes ‘B’ and ‘G’, parent ‘B’ has children ‘C’ and ‘E’, and so on. The child/parent relationship is represented by the continuous arrows in the schematic.
E
H
Align D
F
Right most node
Fleshing out correlation
The render-groups provide a convenient container for the correlation information. Thus, the correlation information, like that of the consistency information, is sent to the render-group manager and farmed out to related views. This allows objects to be selected, transformed and manipulated with similar operations being mimicked in related views. Moreover, by using the render-groups, the correlation information may be automatically applied when new displays are added to the render-group. Therefore, each of the views in a render-group are said to be closely coupled; it is the visualization exploration process itself (i.e. to which render group the displays are added) that governs what is correlated. This is different to Linkwinds [6] or SciAn [12], where the user has to enact the coupling. Incidentally, specific displays may be de-coupled to be individually manipulated.
Figure 6: Right Side Rule: (left) showing the equivalent tree structure and (right) depicting the layout of the modules on the canvas The algorithm provides a Right Side Rule, where each first child-node lines up with the left side of the parentnode, e.g. child ‘C’ aligns with the left of parent ‘B’. The left alignments are indicated by straight dotted lines in Figure 6 and represent the ‘left portion’ of the tree. Each second and consequent child is positioned to the right of the ‘most right node’ of the left portion of the tree, depicted by the curved dotted lines in Figure 6. For example, node ‘E’ aligns with the right side of node ‘B’, and node ‘G’ aligns with the right side of node ‘F’. The layout consists of multiple levels and columns. Another data set would be displayed on the right of the ‘right most node’ of the previous data set, position ‘I’ on the schematic.
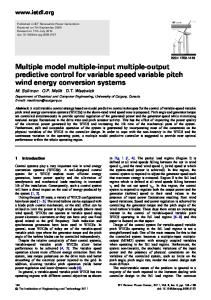
4 An Example The methods discussed in this paper form a framework for ‘multiple viewing visualization’ and are being implemented in the Waltz visualization system [14]. We describe a typical session, visualizing the data from a space dust impact simulation, as shown in Figure 7. The simulation is formed from a stationary block of material which is bombarded with a smaller piece of material. The data set describes the pressure (expansion and compression) of the impact on the object. From this data, we wish to display the main surface of the block and to investigate the internal pressures. This can be achieved by first extracting the data elements representing the block and second investigating the pressure internal to the block. A feature set containing two groups of data is generated – the block and the ‘air’ – and displayed using a slicerenderer, Figure 7 A. The set representing the block is then directly selected, highlighted by the system, and subset containing just this data is stored in a subsequent child render-group module. In fact we generate three child modules of the same feature set. Child 1, Figure 7 B, is used to display the surface image of the block. Child 2, Figure 7 C, is processed to generate various feature-sets of different pressures in the block, and visualized using surface and network-renderers. The networkrender view is used to move and investigate the internal pressures of the block. Additionally, the mapping information of one display is de-coupled from the other rendergroup displays and its transparency value is altered, depicting the internal groups. Child 3, Figure 7 D, is processed to generate different pressure feature-sets. The groups are displayed in a slicerender, some groups are selected and subset into another child module. A surface display is used to depict the data within this next module, Figure 7 E.
5 Summary We have presented a framework that encourages the use of multiple views for scientific exploration. We have discussed the need for: grouping the displays, generating views automatically, governing consistency and correlation among views. The render-groups provide a convenient container for the multiple views. Here, consistency between views and the close coupling of views may be easily maintained, additional views of the same information may be easily requested and added to the render-group and automatically coupled to existing displays. Individual correlation methods may be de-coupled from the render-group and separately manipulated.
We have shown how the use of render-groups may be incorporated into the visualization exploration process, thus encouraging multiple views within the visualization process. We have noted that, to effectively user the multiple views we require consistency, management, and coupling of the multiple views and correlation of windows to the exploration canvas. The Waltz system itself shows that it is possible to implement the framework into a visualization system. We have described a right-side-rule module-management strategy, and have observed, through our user-study, that the strategy stops the user ‘wasting time’ rearranging and placing the modules on the canvas.
Acknowledgements I acknowledge Dr. Tim Hopkins and Dr. Duncan Langford for their help, Dr. Eerke Boiten for ‘our conversations’ and the University of Kent Physics Laboratory, U.K. for the Impact data.
References [1] Greg Abram and Lloyd Treinish. An extended dataflow architecture for data analysis and visualization. In Proceedings Visualization ’95 – sponsored by the IEEE Computer Society, pages 263–270, 1995. [2] Richard A. Becker, William S. Cleveland, and Allan R. Wilks. Dynamic graphics for data analysis. Statistical Science, 2(4):355–395, 1987. [3] Ken Brodlie, Andrew Poon, Helen Wright, Lesley Brankin, Greg Banecki, and Alan Gay. GRASPARC – a problem solving environment integrating computation and visualization. In Proceedings Visualization ’93 – sponsored by the IEEE Computer Society, pages 102–109, 1993. [4] D. S. Dyer. A dataflow toolkit for visualization. IEEE Computer Graphics and Applications, 10(4):60–69, 1990. [5] R. B. Haber and D. A. McNabb. Visualization idioms: A conceptual model for scientific visualization systems. In B. Shriver, G. M. Nielson, and L. J. Rosenblum, editors, Visualization in Scientific Computing, pages 74–93. IEEE Computer Society Press, 1990. [6] Allan S. Jacobson, Andrew L. Berkin, and Martin N. Orton. LinkWinds: Interactive scientific data analysis and visualization. Communications of the ACM, 37(4):43–52, April 1994. [7] Peter R. Keller and Mary M. Keller. Visual Cues – Practical Data and Visualization. IEEE Computer Society Press, 1993.
A D
B
D E
C
Figure 7: Waltz Canvas – Space Impact Simulation; a snapshot of a typical session, showing the right-side-rule layout, the control panels and investigations. A depicts the slice viewer; B a surface representation; C coupled investigations, one object translated in each of the views and the transparency of a specific object altered in a single view; D a further segmentation of the feature set in ‘A’; E represents a selection and subset of the investigation in ‘D’.
[8] M. Levoy. Volume rendering – a hybrid ray tracer for rendering polygon and volume data. IEEE Computer Graphics and Applications, 10(3):33–40, March 1990. [9] Henry Lieberman. A Multi-Scale, Multi-Layer, Translucent Virtual Space. In IEEE International Conference on Information Visualization, pages 124– 131, August 1997. [10] Jock Mackinlay. Automating the design of graphical presentations of relational information. ACM transactions on Graphics, 5(2):110–141, 1986. [11] Allen R. Martin and Matthew O. Ward. High dimensional brushing for interactive exploration of multivariate data. In Proceedings Visualization ’95 – sponsored by the IEEE Computer Society, pages 271–278, 1995.
[17] Edward R. Tufte. Envisioning Information. Graphics Press, 1990. [18] C. Upson, T. Faulhaber, D. Kamins, D. Schlegel, D. Laidlaw, F. Vroom, R. Gurwitz, and A. van Dam. The application visualization system: A computational environment for scientific visualization. IEEE Computer Graphics and Applications, 9(4):30–42, 1989. [19] Jeremy Walton. Data Visualisation with IRIS Explorer - What’s New? Technical Report TR10/96 (NP3070), Numerical Algorithms Group Ltd., 1996. (http://www.nag.co.uk/doc/TechRep/NP1513.html). [20] Matthew O. Ward. XmdvTool: Integrating multiple methods for visualizing multivariate data. In Proceedings Visualization ’94 – sponsored by the IEEE Computer Society, pages 326–333, 1994.
[12] Eric Pepke and Jim Lyons. SciAn: User’s Manual. Supercomputer Computations Research Institute, Florida State University, Tallahassee, Florida, 1993. (http://www.scri.fsu.edu/�lyons/scian).
[21] Jason D. Wood, Helen Wright, and Ken W. Brodlie. Collaborative visualization. In Roni Yagel and Hans Hagen, editors, IEEE Visualization ’97, pages 253– 260. IEEE, November 1997.
[13] Jonathan C. Roberts. Aspects of Abstraction in Scientific Visualization. Ph.D thesis, University of Kent at Canterbury, Computing Laboratory, Canterbury, Kent, England, UK, CT2 7NF, October 1995.
[22] Roni Yagel, David S. Ebert, James N. Scott, and Yair Kurzion. Grouping volume renderers for enhanced visualization in computational fluid dynamics. IEEE Transactions on Visualization and Computer Graphics, 1(2):117–132, June 1995.
[14] Jonathan C. Roberts. Waltz: an exploratory visualization tool for volume data using multiform abstract displays. Visual Data Exploration and Analysis V – Proceedings of SPIE Vol. 3298, January 1998. [15] Hikmet Senay and Eve Ignatius. A knowledge-based system for visualization design. IEEE Computer Graphics and Applications, 14(6):36–47, November 1994. [16] Deborah Silver. Object-oriented visualization. IEEE Computer Graphics and Applications, 15(3):54–62, May 1995.
[23] Mark Young, Danielle Argiro, and Steven Kubica. Cantata: Visual programming environment for the Khoros system. Computer Graphics, 29(2):22–24, May 1995. [24] Y. Zhuge, H. Garcia-Molina, and J. Wiener. Multiple view consistency for data warehousing. In Proceedings of the 13th International Conference on Data Engineering (ICDE’97), pages 289–300, Washington Brussels - Tokyo, April 1997. IEEE.