Spatial Data Visualization on Mobile Interface â A. Usability Study. Luca Paolino, Marco Romano, Genoveffa Tortora, Giuliana Vitiello. Dipartimento di Studi e ...
Spatial Data Visualization on Mobile Interface – A Usability Study Luca Paolino, Marco Romano, Genoveffa Tortora, Giuliana Vitiello Dipartimento di Studi e Ricerche Aziendali (Management & Information Technology) University of Salerno Fisciano (SA) Italy{lpaolino, marrom, tortora, gvitiello}@unisa.it If above two features are not supported then comparisons as well as evaluations of spatial relationships may become very difficult because users may be presented with insufficient or excessive amount of information on the screen. This is especially the case for maps visualized on mobile devices, where viewing a wide portion of the map conflicts with showing features in a well-defined and separate fashion, due to the small dimensions of screens. As an example, if we perform a search for the closest hotel from our current location, the result may fall either inside or outside the screen. In the first case, we do not have problems to reach the hotel because we can distinguish it on the map. Vice versa, in the second case, we do not know which direction we have to follow to arrive at the target and we have to gropingly advance. Visualizing the entire map is not the right solution. This can result in objects from a query task appearing improperly overlapped. As an example, if we are visualizing a layer showing the locations of farmhouses located in a given region and we want to see all of them together, we might want to represent the entire region on the screen, hence using a reduce scale for the map. In that case, there is a high probability that, below a certain proximity threshold, farmhouses will be overlapped and will then be hard to distinguish.
Abstract—The widespread use of mobile devices in basic map navigation tasks has recently attracted researchers on usability problems arising from the reduced visualization area and the limited interaction modes allowed by small screens. In this paper we analyze the most common approaches suggested in the literature and present the results of a usability study carried out on one of them, an interactive technique, named FRAMY, which was conceived to cover a wider range of spatial data visualization tasks, possibly involving different geographic layers. A comparative usability study has been carried out on Framy and a traditional map application in order to evaluate the inoact of the novel approach on usability, in terms of efficiency and efficacy. Keywords: Framy, Visual Analytics, mobile application, empirical experiment
I.
INTRODUCTION
Today map based mobile applications are widespread and many business activities use them to get the best visibility. Advantages deriving from maps are countless, they provide people with the ability to show and analyze the world as they perceive it, namely by verifying topological, directional and metrical relationships. People use maps in a number of tasks, including finding the nearest relevant location, such as a gas station, or for hand-optimizing a route. The present paper deals with the issue of spatial data visualization on limited sized screens. Spatial data are characterized by a spatial structure that cannot be modified without compromising their meaning. Therefore when these data are very large and pass infinite, their representation on small screens will become very challenging. Often they are represented as a single image but the image is so large for the screen that just a portion per time can be visualized and users must perform several actions, such as zooming and panning, in order to explore the whole image.
An approach which is able to overcome these problems is Framy [1] which is a visual technique able to handle large amounts of spatial data in small-screen devices. This technique will be recalled in the following sections. Based on this technique, the focus of this paper is to demonstrate that the Framy visualization technique gives a significant advantage both in terms of efficiency and effectiveness with respect to a classic map visualization application. The paper is organized as follows. In Section II we present the previous work we did on Framy and its evolution together with some popular alternative approaches . In Section III and Section IV, we present the idea underlying Framy and illustrate three typical scenarios where the technique can be employed. In Section V, we show the experiment and present the results of a usability evaluation study. Finally, in Section VI, a summary is given.
Basically, to have a complete and exhaustive evaluation of a region it should be possible for users to: 1) have a global or wide enough view of the map portion they are taking into account and 2) have a vision of the map where details can be well distinguished .
978-1-4673-2480-9/13/$31.00 ©2013 IEEE
959
II.
The new interface exploits sounds and vibrations to better involve users into the application and to support them in situations in which the sight is not at best, as for example when sun reflections on the screen make visualizing colors a hard task. In [9] a pilot study, performed with a group of visually impaired users, led the redesign that made the interface able to support even visual disabilities by a wise usage of colors combinations, vibrations and sounds.
PREVIOUS AND RELATED WORK
In this section we describe the previous work on Framy; a visual technique useful to handle with large amounts of spatial data and the work related to it. In [1] and [2], the spatial data visualization technique named Framy has been presented for the first time. It has been designed to handle with geographic data on mobile devices. The technique exploits a visual metaphor based on nested frames in order to give information clues about POIs located outside the screen. This technique has been applied to handle with spatial data in several contexts.
In [13], the visual technique was applied to the interface of the web based spreadsheet mediated collaboration system presented in [10]. The shared spreadsheet is provided with a window, which lists the users currently connected. Each element of the list is associated to a given color. Whenever a participant is editing a cell, those cells are colored with the user’s identifying color so as to appear ‘locked’ to the others. After the user changes the content of a cell and unlocks it, the system draws a line along the border of the cell with the color identifying the user. When users visualize the spreadsheet on a large screen they do not have problems to perceive the changes of the majority of cells. On the contrary, on a mobile interface they can just visualize a small portion of the sheet, which may strongly limit the perception of off-screen changes of cells contents. A framy interface gives information about the off-screen distribution of the modified cells. The color intensity of each frame portion is proportional to the number of modified cells located in the corresponding outside sector.
In [6], for example, it has been applied to the decision making discipline. This was to provide expert operators with tools based on a visual analytics approach. A software artifact based on Framy was designed to integrate spatial and temporal information through a notation which visually summarizes it on mobile device screens. In [7] and [8] the visual interface has been redesigned to fit problems related to the augmented reality and mobile devices. The new interface mainly merges the concepts introduced with the Framy technique into an augmented reality environment to improve the perception of the objects or objects properties on a mobile application characterized by a strong geographic component. In [12] and [9] a significant redesign process of the visual interface have been started. The interface has moved from a solely visual interface to a complete multimodal interface [12].
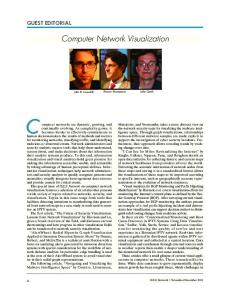
Figure 1 – (a) Halo interface, (b) the CityLights interface
As for the related work, in the literature, several techniques have been proposed to display large information spaces on desktop screens. An interesting paper by Chittaro classifies the different approaches adopted to visualize maps and images on small screens [5]. The author argues that the techniques traditionally adopted to combine panning and zooming with either compression (the so-called overview-detail approach) or distortion operations (known as focus-detail approach) may still present severe limitations when applied to mobile devices, due to the very small screen dimensions. An approach, specifically conceived for visualizing distance and direction of
off-screen locations, consists in providing visual references to off-screen areas, by augmenting the detail view with interactive visual references to the context. Such an approach has been successfully adopted in systems like Halo to enable users to complete map-based route planning tasks [3]. The Halo methodology allows users to discover POIs located outside the visualized region. Each POI is the centre of a circle whose ray increases or decreases as the user gets closer or farther. A variation of this approach is CityLights [4]. Here, compact graphical representations such as points, lines or arcs are placed along the borders of a window to provide awareness
960
about off-screen objects located in their direction. Finally, [14] presents a set of visual analytics for preserving petroglyphs.
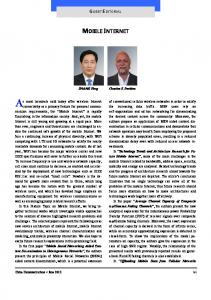
the screen a fictive circle is drawn and the map is divided into n sectors of equal width (360°/n ). Figure 2 gives an idea of
Tables I summarizes the strengths and the weaknesses of the two solutions, as they influenced some basic design choices with Framy .
this subdivision using n = 8. We use the notation Ui – invisible- to represent the regions within a sector which lies outside the screen whereas Vi – visible- represents the screen part).
TABLE I - STRENGHTS AND WEAKNESSES OF H ALO AND CITYLIGHTS TECHNIQUES
Strength
The idea behind this approach is to draw a semitransparent frame along the border of the screen whose subparts, C1, …, Cn, identified by the intersection between the frame and Vi parts, are colored by taking into account the data grouped in Ui. Formally, we state that the color intensity is:
Weakness
Halo Users may verify anytime the The technique is not very direction and the proximity of the off- precise. The precision depends on the screen POIs through the dimensions of POI position: a POI located on the the circle sector depicted inside the corner direction of the screen screen. produces a circle whose sector could not be fully represented on the screen. Many POIs produce several circles. The representation of many circles can cause a visual crash so that users cannot well distinguish different sectors of circles and cannot evaluate the distance and the direction.
Color(Ci ) = f(Ui ) for each i belonging to {1, …, n}
(1)
where f is any function which extracts a numeric value from a set of spatial data. where f is any function which extracts a numeric value from a set of spatial data. IV.
TYPICAL SPATIAL QUERY SCENARIOS
In this section three scenarios will be shown in order to exemplify three different ways to adopt Framy as a visualization technique. In particular, in the first example Framy indicates the quantity of objects belonging to the layer of interest. In the second one, nested frames are used to combine information coming from different layers.
CityLights The technique is developed to work CityLights cannot give in desktop environments but can be qualitative or quantitative easily adapted to work on mobile information about off-screen devices. elements but just indicate their position. In other words it can tell users that something exists in a certain direction but users do not know how many objects can be found and how far they are positioned.
A.
Example 1: Framy as a visual synthesizing technique
The first scenario shows the use of Framy to make the user aware of the distribution of the whole set of data over a map, disregarding of the presently visible map extension. Figure 3 depicts the layers of the banks and of the streets in Sydney. The screen of a mobile phone is overlapped with them and the blue dotted lines indicate the chosen subdivision of each frame, namely 8 portions. It is possible to note that the color intensity of each sectors proportional to the number of banks located in the corresponding off-screen sector. As an example, the sectors corresponding to the bottom side of the map are associated with a zone with few banks, then they result either transparent or colored with a very light red color. On the other hand, the red color associated with the sectors on the right get the more intense the higher the quantity of offscreen banks.
Figure 2. The off-screen map sectors resulting from a frame subdivision in Framy.
III. FRAMY TECHINQUE In Framy, users may choose to divide the map into any number n which is a power of 2. Starting from the center of
Figure 3. Overlapping layers of interest with the screen of a mobile phone
961
B.
Example 2: Framy as technique for visually comparing distributed information.
number of unexplored POIs. It is important to note that due to the dependency of the results of the experiments from the starting position and to the necessity to make the experiments as independent as possible, we used a set of ten random positions which have been used both by the experimental group and by the control group.
In this scenario, the Framy technique is applied in order to compare values resulting from spatial aggregations. In this example two layers showing banks and train stations have been added to the map. Besides taking a look at the map, the request is to understand in which direction we should go in order to find a zone where it is easier to find simultaneously both a bank and particular train stations.
The first task, from now on Task1, consists of searching all the hotels located within two kilometers far from a given position. Users must record the street name of each POI. After completing the task each subject indicated the number of hotels with corresponding street names discovered during the exploration of the map. The reason why users were asked to record the street name for each POI is that in this way users are forced to analyze the region in detail that is what they are expected to do during a typical map consultation activity. Because of the dimensional limits of the device screen POIs are only partially depicted in the same screen view so that users have to navigate the map in order to visualize them. The second task, from now on Task2, consists of searching restaurants located one kilometer far from the current position. Differently from the Task1 users do not know the number of restaurants. After completing the task each subject indicates the number of restaurants with corresponding street names discovered during the exploration of the map. B.
The independent variable in the experiment is the application which the subjects uses to perform the tasks, namely Framy (F) or the iPhone application Maps (M). The dependent variable in Task1 is Time that is the time users spend to accomplish the task and in Task2 Errors that is the number of POIs that have not been identified by users. As for the efficiency, it is computed by taking into account the time required to find out the surrounding hotels. We calculated the effectiveness by counting the number of omitted hotels.
Figure 4. A visual comparison by using Framy
In order to derive this information, two nested frames have been configured – red for banks and green for train stations, respectively.
C.
Given the data distribution, few Ci have been colored. In particular, colors are more intense on the right and up sides where the map shows numerous POIs. As a result, the top part better satisfies the initial requirement because the red and green colors are simultaneously more intense with respect to other parts (see Figure 4).
Subjects and Groups.
Forty subjects, which were randomly distributed over four groups of ten subjects, have been involved: G1, C1, G2, and C2. G1 and C1 are the experimental and the control groups which performed the task Task1 by using F and M, respectively. On the other hand, G2 and C2 are the experimental and the control groups which performed the task Task2 by using F and M, respectively.
V. EVALUATING THE PROTOTYPE In this section, we describe the comparative usability study we have carried out on Framy and a traditional map application that allows people to visualize maps and POIs (Google maps™) . Using Framy users get visual information cues about the surrounding POIs so they know the off-screen portion of map they should pan towards. The goal of this study was to evaluate if this knowledge gives a significant advantage in terms of efficiency and effectiveness. A.
Independent and Dependent Variables.
TABLE II. GROUP DIVISION FOR TASK AND USED APPLICATION
The Tasks.
D.
The first task was designed to evaluate the time spent by users to explore POIs on a map by using, alternatively, a map application enhanced with Framy and a traditional map application. The second task is used to understand if Framy helps to explore POIs depicted on a map decreasing the
F
M
Task1
G1
C1
Task2
G2
C2
Data and Discussion.
The data collected during the experiment will be briefly discussed in this subsection. As for efficiency, data show that there could exist significant improvements. In the first task, the experimental group required 36% less time than the
962
control group. Specifically, the experimental group required 19,6 minutes on the average whereas the control group required 28 minutes. In the second task, the experimental group G2 explored 95% of the POIs while the control group C2 73%. E.
minutes on the average whereas the control group required 28 minutes. In the second task, the experimental group G2 explored 95% of the POIs while the control group C2 73%. These results have been evaluated also in statistical terms for understanding whether they are due to the particular sample by the well-known t-test. Also in this case results are encouraging. Indeed, the p-values are both under the 0.005 threshold which confirms that results are not due to the chance.
Tests and Hypotheses.
In order to prove that the improvements were not casually derived we have applied a one-tail t-test with a p-value < 0.05 on the collected results for each pair of groups we want to compare. Thus, we have formulated two pairs of hypotheses, each including the null hypothesis and the alternative one. •
REFERENCES [1]
H0-1(null hypothesis): The time to complete Task1 by subjects in G1 and C1 groups is the same: µTime (C1,
[2]
Task1) = µTime (G1, Task1) vs µTime (C1, Task1) < •
µTime(G1, Task1)
[3]
H0-2(null hypothesis): In Task2 the number of errors made by subjects in G2 and in C2 is the same: µError(C2, Task2)
[4]
= µError(G2, Task2) vs µError(C2, Task2) < µError(G2, Task2) F.
[5]
Test Results.
Essentially, the hypotheses where we claim that the averages are equal must be rejected in favor of the alternative hypotheses (see Table III). Indeed, for H0-1 the t value is 5.4172 with p value 0.0004 and for H0-2 the t value is 11.0 with p value 0.0001. The signs provide further information about the hypotheses. In fact, the t-value is positive if the control group mean is greater than the experimental group mean and negative if it is smaller.
[6]
[7]
[8]
TABLE III. RESULTS OF THE T-TEST ABOVE THE TWO HYPOTHESIS. Hypothesis
t
p
H0-1
5.4172
0.0004
H0-2
11
0.0001
[9]
[10]
[11]
As for, H0-1 and H0-2, the t-test values are both positive. These values indicate that the control group means are larger than the experimental group mean. Thus, we can claim that statistically users employ less time to perform the Task1 using Framy than using the traditional map application and in Task2 users make less errors using Framy. I.
[12]
[13]
CONCLUSION
[14]
In this paper, we presented an experiment aimed at evaluating the ability in terms of efficacy and efficiency of the Framy methodology. In particular, we evaluated efficiency and efficacy on two scenarios comparing it with a popular map navigation application. We demonstrated that performances improve in both cases, namely: in the first task, the experimental group required 36% less time than the control group. Specifically, the experimental group required 19,6
963
Luca Paolino, Monica Sebillo, Genoveffa Tortora, Giuliana Vitiello: Framy- Visualizing Spatial Query Results on Mobile Interfaces. Lecture Notes in Computer Science, 4857 LNCS , pp. 175-186, 2007 Luca Paolino, Monica Sebillo, Genoveffa Tortora, Giuliana Vitiello: Framy - visualising geographic data on mobile interfaces. J. Location Based Services 2(3): 236-252 (2008) Baudisch, P., Rosenholtz, R.H., A Technique for Visualizing Off-Screen Locations. In: CHI 2003. ACM CHI Conference on Human Factors in Computing Systems, pp. 481–488. ACM Press, New York, 2003 Mackinlay, J., Good, L., Zellweger, P., Stefik, M., Baudisch, P., City Lights: Contextual Views in Minimal Space. In: CHI 2003. Proc. ACM CHI Conference on Human Factors in Computing Systems, pp. 838– 839. ACM Press, New York, 2003 Chittaro, L., Visualizing information on mobile devices. IEEE Computer 39(3), 40–45, 2006 Paolino, L., Romano, M., Sebillo, M., Vitiello, G., Supporting the onsite emergency management through a visualisation technique for mobile devices. Journal of Location Based Services 4 (3) , pp. 222-239 De Chiara, D., Paolino, L. , Romano, M., Sebillo, M., Tortora, G., Vitiello, G., Augmented Map navigation through Customizable Mobile Interfaces. Proceedings of The 16th International Conference on Distributed Multimedia Systems (Chicago), Knowledge Systems Institute 2010 De Chiara, D., Paolino, L., Romano, M., Sebillo, M., Vitiello, G., Link2U: Connecting social network users through mobile intefaces. Proceedings of IEEE Pacific-Rim Conference on Multimedia (Shanghai) , Springer Verlag 2010 Di Chiara, G., Ginige, A., Paolino, L., Romano, M., Sebillo, M., Tortora, G., Vitiello, G., The Framy User Interface for Visually-Impaired Users. Proceedings of Sixth International Conference on Digital Information Management, IEEE press, pp 36-41, Melbourne (Australia), 2011. Ginige, A., Paolino, L., Sebillo, M., Tortora, G., Romano, M., Vitiello, G., A Collaborative Environment for Spreadsheet-Based Activities. Proceedings of IEEE Symposium on Visual Languages and HumanCentric Computing 2010 Paolino, L., Romano, M., Sebillo, M., Vitiello, G., Phenomena - A visual environment for querying heterogenous spatial data. Journal of Visual Languages and Computing, 20 (6) , pp. 420-436 Paolino, L. , Romano, M. , Sebillo, M., Tortora, G., Vitiello, G. AudioVisual Information Clues about Geographic Data on Mobile Interfaces. Proceedings of The IEEE Pacific-Rim Conference on Multimedia (Bangkok), Springer Verlag 2009 Athula Ginige, Marco Romano, Monica Sebillo, Giuliana Vitiello, Pasquale Di Giovanni: Spatial data and mobile applications: general solutions for interface design. AVI 2012: 189-19 V. Deufemia, L. Paolino, G. Tortora, A. Traverso, V. Mascardi, M. Ancona, M. Martelli, N. Bianchi, and H. De Lumley. 2012. Investigative analysis across documents and drawings: visual analytics for archaeologists. In Proceedings of the International Working Conference on Advanced Visual Interfaces (AVI '12), pp. 539-546