Aug 29, 2014 - (2014) The Effect of Silver Nanoparticle Size and Coating on Escherichia coli. .... and cell membrane inhibiting the respiration process [3,9].
JSM Nanotechnology & Nanomedicine
Central Research Article
The Effect of Silver Nanoparticle Size and Coating on Escherichia coli 1
1
1
2
Tajkarimi, M. , Iyer, D. , Tarrannum, M. , Cunningham, Q. , Sharpe, I.3, Harrison, S. H.2 and Graves, J. L.1
Special Issue on
Research at the Joint School of Nanoscience and Nanoengineering *Corresponding author Joseph L. Graves, Jr., Associate Dean for Research & Professor of Biological Sciences, Joint School of Nanosciences and Nanoengineering, North Carolina A&T State University & UNC Greensboro, NC 27401, USA, E-mail:
1
Department of Nanoengineering, North Carolina Agricultural and Technical State University, USA 2 Department of Biology, North Carolina Agricultural and Technical State University, USA 3 Department of Chemical, Biological, and Bioengineering, North Carolina Agricultural and Technical State University, US
Submitted: 18 July 2014 Accepted: 27 August 2014 Published: 29 August 2014 Copyright © 2014 Graves et al.
Abstract
OPEN ACCESS
Silver nanoparticles are being increasingly used as antimicrobials. The shapes, sizes, and coatings of silver nanoparticles are factors known to individually influence the release of silver ions (Ag+) and thereby their effectiveness. However, size and coating effects have not been investigated in combination. This experiment investigates the effect of size and coating of spherical silver nanoparticles specifically 10 nm spherical (citrate-coated, polyvinylpyrrolidone --PVP-coated), 40nm spherical (citratecoated, PVP-coated) and bulk silver nitrate on the gram-negative bacterium Escherichia coli. We found that citrate coatings and smaller sizes of silver nanoparticles had significantly higher antimicrobial effect against Escherichia coli MG1655 compared to larger PVP-coated nanoparticles, while bulk silver nitrate was most effective. Thus, with regard to a gram-negative bacterium, the positively-charged citrate coating was more effective than the negatively-charged PVP coating. This indicates that care must be taken to determine the best type of silver nanoparticles to use against different bacterial species, and that the cellular composition and environment of bacteria may be expected to influence nanoparticle effectiveness.
Keywords
INTRODUCTION Emerging outbreaks of infectious disease and widespread resistance to conventional antimicrobial drugs are significant global public health problems, and there has been an increasingly aggressive search for new antimicrobial agents [1,2]. Nanoparticles have been proposed due to their high surface-tovolume ratio and their unique chemical and physical properties which are often best realized through the use of metallic compounds [2-4]. In particular, silver is a metal that has had historical use as an antimicrobial agent [2,5-7]. Past examples of the antimicrobial use of silver include its use for water treatment in 1000 BCE, the use of silver nitrate to treat venereal disease in 1700 CE, and the use of silver nitrate to treat fresh burns from at least the 18th century forward [5-9]. In modern times, silver has been successfully used as an antimicrobial against 16 major species of bacteria. The antimicrobial activity of silver has been established to be due to Ag+ ions in a number of studies going back at least to the 1970’s. For example, Spadaro et al. [10] utilized silver electrodes
• Nanoparticles • E. coli • AgNps
with weak direct current to inhibit growth on agar plates for the bacterial varieties of Staphylococcus aureus, Escherichia coli, Proteus vulgaris, and Pseudomonas aeruginosa. These results are particularly interesting in that the strains used in this study were isolated from patients in the Veterans Administration Hospital in Syracuse, NY. Strains living in hospitals have been exposed to a number of biocidals and in general should be “tougher” than stains living in the general environment. Indeed, silver-resistant bacteria have been repeatedly found in burn wards, clinical and natural environments, and on human teeth [11].
Sondi and Salopek-Sondi [12] is one of the earliest studies that examined specifically the impact of silver nanoparticles on bacterial growth. Their study with E.coli and 12 nm diameter nanoparticles suggested that if the primary mechanism of biocidal action is Ag+ ions, then AgNPs would be more effective than bulk silver. In all treatments (10, 50, and 100 µg/cm3), there was a significant delay in bacterial growth and lower population size achieved at the end of 9 hours relative to the control (0 µg/ cm3). The effect was greatest for 100 µg/cm3 with exponential growth delayed for an additional hour, and a final population
Cite this article: Tajkarimi M, Iyer D, Tarrannum M, Cunningham Q, Sharpe I, et al. (2014) The Effect of Silver Nanoparticle Size and Coating on Escherichia coli. JSM Nanotechnol Nanomed 2(2): 1025.
Tajkarimi et al. (2014) Email:
Central size of 42% (0.75 x 10⁹colony forming units; CFU) relative to the control. Sondi and Salopek-Sondi [12] argued that this was due to the fact that the concentration of the AgNPs decreased with time in the culture. This resulted from the interaction of the AgNPs with the intracellular substances of the destroyed cells. Their SEM images showed that AgNPs coagulated with dead bacterial cells, thus reducing the concentration of them and Ag+ ions in the liquid medium. Subsequent studies have confirmed these general findings Baker et al. [13]; Morones et al. [3]; Panacek et al. [14]; Pal et al. [15]; Shahverdi et al. [16]; among others. These impacts of AgNPs have also been found for natural microbial communities [17-19].
Nanoparticle morphology is an important determinant of toxicity to bacteria with smaller NPs being most effective [13,14]. Morones et al. [3] studied NPs in the range of 1 – 100 nm diameters and found that toxicity was enhanced based on a lower size range (1 – 10 nm), and observed a range of varying NP shapes through transmission electron microscopy (TEM). Pal et al. [16] found that truncated triangular AgNPs displayed the greatest effect on E. coli compared to spherical and rod-shaped NPs.
While the exact mechanisms of silver nanoparticle toxicity to bacteria are not fully known, there is a growing consensus concerning the candidate actions. First, the action of silver nanoparticles occurs both by the release of silver ion (Ag+) as well as from potential disruption or damage to the cell wall and membrane caused by the particles themselves [2,11,20]. Silver interacts with the thiol group compounds found in respiratory enzymes of bacterial cells. It also binds to the bacterial cell wall and cell membrane inhibiting the respiration process [3,9]. Silver is known to act on E. coli by inhibiting the uptake of phosphorous and releasing phosphate, manitol, succinate, proline, and glutamine from the cells [20,21]. The penetration of silver ions inside the cell is thought to impact the ability of DNA to replicate by causing it to condense. Furthermore, silver ions may interact with the thiol groups of proteins inside the cell causing these to become inactivated [20,22,23]. Due to the large surface area to volume ratio, smaller AgNPs should be able to more effectively release Ag+ ions into the cell and, following attachment to the cell membrane, may also penetrate into the cell [3, 11, 14-16, 20]. Once inside, Ag+ ions may be lethal as they disrupt metabolism, cell signaling, DNA replication, transcription, translation, and cell division, either directly or through the generation of reactive oxygen species (ROS) [11,20]. In summary, the toxicity of AgNPs upon bacteria appears dependent on particle shape, size, and concentration (> 75 µg/ml usually ceases growth) [20]. This study investigates the effect of AgNP on bacteria by examining both particle size and coating type. AgNPs can be synthesized both by chemical and biological methods [16,24-26]. Chemical methods require some sort of compound coating the AgNPs to prevent further aggregation. For example, Sondi, Goia, and Metijevic [24] utilized Daxad 19, a sodium salt of high molecular weight naphthalene sulfonate formaldehyde to prevent NP aggregation. Others have used citrate (C6H5Na3O7), thiosalicyclic acid (C6H4(SH)CO2H, IUPAC name, 2-mercaptobenzoic acid), or polyvinylpyrrolidone (PVP, IUPAC name 1-ethenylpyrrolidinz-one) as coating agents for AgNP production. The fact that these coatings have different solubility’s would impact solution JSM Nanotechnol Nanomed 2(2): 1025 (2014)
pH differently, may adhere to biological cell walls differently suggests that coating type may play a role in how AgNPs kill bacteria. El Badaway et al. [27] showed that toxicity of AgNPs was dependent on more negatively charged particles. In a study performed on Bacillus spp, they found toxicity increased along the following series of coatings: uncoated (H2—AgNPs), citrate coated (Citrate-AgNPs), polyvinylpyrrolidone coated (PVPAgNPs), and branched polyethyl-eneimine coated (BPEI-AgNPs). Our study will test the generality of this finding by specifically comparing two different commonly used coatings (citrate, PVP) and examine toxicity for 10 nm and 40 nm AgNPs in the model gram-negative bacterium Escherichia coli.
MATERIALS AND METHODS Bacterial culture
We cultured E. coli K-12 MG1655 using Davis Minimal Broth (DMB, DifcoTMSparks, MD ) with Dextrose 10%(Dextrose, Fisher Scientific, Fair Lawn, NJ) as a sole carbon source, enriched with thyamine hydrochloride 0.1% (Thyamin Hydrochloride, Fisher scientific, Fair Lawn, NJ) in 10 ml of total culture volume maintained in 50 ml Erlenmeyer flasks. The flasks were placed in a shaking incubator with temperature maintained at 37°C for 24 hours. Cultures were propagated by daily transfers of 0.1 ml of each culture into 9.9 ml of DMB.
Measuring bacterial growth
Bacterial growth in BHI broth samples was assessed by measuring turbidity at 620 nm for hours 0, 3, 6, 12 and 24, using a 98-well plate Synergic Mx spectrophotometer (Biotek, VA USA) using clear polyester 98-well plates.
Bacterial enumeration
Bacterial populations were determined by spread plating on DMA agar. In this procedure, samples were withdrawn from inoculated samples at 0 and 24 h and were serially diluted in 0.1% peptone water. Appropriate dilutions were surfaced plated (200 µl) onto duplicate DMA plates.
SEM image bacterial preparation
SEM preparation was conducted using aldehyde fixative for a minimum of one hour using Karnovsky’sglutaraldehyde, followed by 2% paraformaldehye2% glutaraldehydein 0.1M phosphate buffer for another hour, post-fixation with osmium tetroxide and cacodylatephosphate buffer for one hour and washing with deionized water, followed by applying a series of graded acetonitrile using concentrations of 50,70,90,95, and 100%. We used Zeiss Auriga BUFIBFESEM.
AFM image bacterial preparation
Glass slides were washed carefully with acetone and then sonicated with 100% ethanol and deionized water for 10 minutes. The glass slide is dried with nitrogen gas and plasma cleaned for 3 minutes. Bacteria were washed for 10 minutes at 4ºC with deionized water and 10 µl of 0.1% ploy – l -Lysin were added into the glass and the same volume of the washed bacteria were added and air dried. Imaging was then immediately conducted using tapping mode AFM [28].We used AFM Agilent model 5600LS.
Experimental design
2/9
Tajkarimi et al. (2014) Email:
Central
RESULTS
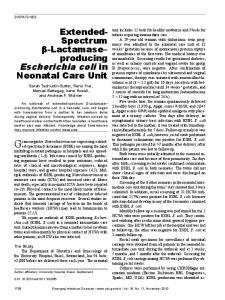
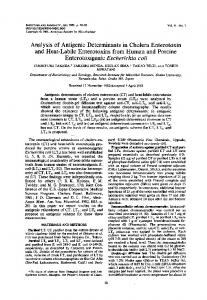
Figure 1 shows the population growth as measured by the mean optical density of the bacteria in the presence of 40 nm citrate-coated silver nanoparticles at varying concentrations relative to the control bacteria. The standard deviations in all optical density measurements ranged between 0.001 and 0.049, with a mean standard deviation of 0.005. Given these small values, none of the standard deviations are shown in there optical density figures. Figure 1 shows that there is no apparent growth of the bacteria at any of the concentrations assayed (2000, 4000, 5000, and 6000 µg/L). Table 1 reports the differences in the natural logarithms of CFUs at 0 and 24 hours for all experiments reported on in this study. In all treatments containing 40nm citrate-coated nanoparticles, the difference between CFUs is negative, while the control treatment showed substantial positive growth in CFU’s (increasing by over 1 log unit in 24 hours). The difference was concentration dependent, with the greatest differences occurring at concentrations exceeding 5000 µg/L (> -2.00 log units.) Figure 7a and show Scanning Electron Microscope (SEM) images of treated and non-treated bacteria with 40 nm PVP-coated silver nanoparticles. Figure 7b reports coagulations of silver nanoparticles on the surface of bacteria compared to non-treated bacteria. Figure 8a and b compare the AFM image of non-treated and treated bacterial with AgNPs. This image was taken using the tapping mode [28] both of these images illustrate association of silver nanoparticles with the bacterial cell wall compared to the control treatment without silver nanoparticles. The AFM image of the treated cell shows apparent damage to the cell wall compared to the untreated control. Table 2 reports the intrinsic rates of increase for the bacteria from all experiments at different concentrations of the various nanoparticles and bulk silver nitrate. The intrinsic rate of JSM Nanotechnol Nanomed 2(2): 1025 (2014)
Population Growth E. coli K12-1655 with 40nm Citrate-coated Silver nanoparticles 0.6
0.5
Optical Density
0.4
0.3
0.2
0.1
0.0
-0.1 0
3
6
9
12
15
18
21
24
27
Time (Hrs) Time Time Time Time Time
vs vs vs vs vs
0 ug/L 2000 ug/L 4000 ug/L 5000 ug/L 6000 ug/L
Figure 1 Shows population growth as measured by optical density of bacterial cultures exposed to 40nm citrate-coated silver nanoparticles. Concentrations assayed were 0, 2000, 4000, 5000, and 6000 µg/L. Bacterial growth is eradicated at all concentrations greater than 0 µg/L. Population Growth E. coli K12-1655 with 40nm PVP-coated Silver nanoparticles 0.6
0.5
0.4
Optical Density
The ability of the bacteria to grow in response to silver was determined by exposing them to varying concentrations of spherical silver nanoparticles of 10 nm and 40 nm diameter sizes, and of different coating, citrate and PVP (obtained from nano Composix, San Diego, CA) and bulk silver nitrate (Fisher Scientific, Fair Lawn, NJ ). We determined that the different-sized silver nanoparticles and bulk silver nitrate were effective over different concentration ranges replicating the findings of earlier researchers [3]. Therefore we assayed the effectiveness of 10 nm particles at concentrations of 100 µg/L, 250 µg/L, 500 µg/L, 750 µg/L, and 1000 µg/L. The 40 nm particles were evaluated at 2000 µg/L, 4000µg/L, 5000µg/L, and 6000µg/L. Bulk silver nitrate was evaluated at 50 µg/L, 100 µg/L, 250 µg/L, 500 µg/L, 1000 µg/L, and 2000 µg/L. All silver treatments were compared to equivalent inoculates of bacteria growing in DMB medium without silver (control). Population growth in response to silver was measured by optical density and by determining colony forming units (CFU) via serial transfer on DMB agar plates at 0 and 24 hours. Two plates were prepared for each treatment in each experiment. The optical density was determined as an estimate of the cell density of bacteria at 620 nm absorbance using a multimode single-channel monochromator-based microplate reader. Optical density readings were taken at 0, 3, 6, 12, and 24 hours of growth. Optical density readings were recorded twice for each treatment in each experiment.
0.3
0.2
0.1
0.0
0
3
6
9
12
15
18
21
24
27
Time (Hrs) Time Time Time Time Time
vs vs vs vs vs
0 ug/L 2000 ug/L 4000 ug/L 5000 ug/L 6000 ug/L
Figure 2 Shows population growth as measured by optical density of bacteria exposed to 40nm PVP-coated silver nanoparticles. Concentrations assayed were 0, 2000, 4000, 5000, and 6000 µg/L.
increase, r, is calculated using the standard exponential growth equation: Nt = N0 * erT;
Thelinear form is:
ln(Nt) = ln(N0) + rT
where Nt is the population size at 24 hours measured by CFUs, N0 is the population size at 0 hours measured by CFUs, T is time in hours, and r is the intrinsic rate of increase.
3/9
Tajkarimi et al. (2014) Email:
Central Table 1: Ln of CFU difference by experiment and treatment.
Population Growth E. coli K12-1655 with 10nm PVP-coated Silver nanoparticles
40nm Citrate-coated
2000
4000
5000
6000
2.40
-1.75
-3.97
-5.12
-5.12
2.26
-1.84
-4.08
40nm PVP-coated
-5.23
-2.23
Control
2000
4000
5000
6000
2.04
1.37
0.64
1.48
0.83
2.26
1.26
0.81
10nm Citrate-coated
1.32
0.73
Control
100
250
500
750
1000
2.26.981
1.91
1.14
-2.21
-4.29
-2.90
2.23
2.11
Control
1.03
10nm PVP-coated
100
2.26
250
1.87
2.23
1.80
-2.17 500
-0.68
-1.38
-0.79
-1.39
Bulk Silver Nitrate
-4.11
-2.973
-1.80
-2.42
750
-1.83
-2.49
50
100
250
500
1000
2000
2.17
1.86
-2.65
-4.15
-6.45
-7.60
-7.60
-4.14
-6.44
0.5
0.4
-7.59
-7.59
Differences in ln CFU units are given for each treatment (concentrations) and experiment. These show that for 40 nm particles Citrate-coating is more effective than PVP-coating (greater log reduction at all concentrations.) At the 10 nm size, PVP performed best at 250 mg/L, but Citrate showed greater reduction at the higher concentrations.
0.2
0.1
0.0
-0.1 0
3
0.5
0.4
9
Time vs Time vs Time vs Time vs Time vs Time vs
12
15
18
21
24
27
0 ug/L 100 ug/L 250 ug/L 500 ug/L 750 ug/L 1000 ug/L
Figure 4 Shows population growth as measured by optical density of bacteria exposed to 10nm PVP-coated silver nanoparticles. Concentrations assayed were 0, 100, 250, 500, 750, and 1000 µg/L. Bacterial growth is eradicated at 1000µg/L. Bacterial growth is delayed by 6 hours and 12 hours at concentrations 100 and 250 µg/L and 500 and 750µg/L respectively. Population Growth E. coli K12-1655 with bulk Silver Nitrate 0.5
0.4
Optical Density
0.6
6
Time (Hrs)
Population Growth E. coli K12-1655 with 10 nm Citrate-coated Silver nanoparticles
Optical Density
0.3
1000
Control
2.16 1.90 -2.09 (All concentrations are in µg/L)
0.6
Optical Density
Control
0.3
0.2
0.3
0.1
0.2
0.0 0
3
6
9
12
15
18
21
24
27
Time (Hrs)
0.1 Time Time Time Time Time
0.0
0
3
6
9
12
15
18
21
24
0 ug/L 50 ug/L 100 ug/L 250 ug/L 500 ug/L
27
Time (Hrs) Time vs 0 ug/L Time vs 100 ug/L Time vs 250 ug/L Time vs 500 ug/L Time vs 750 ug/L Time vs 1000 ug/L
Figure 3 Shows population growth as measured by optical density of bacteria exposed to 10nm citrate-coated silver nanoparticles. Concentrations assayed were 0, 100, 250, 500, 750, and 1000 µg/L. Bacterial growth is eradicated at all concentrations greater than 250 µg/L. Population growth is delayed by six hours at concentrations of 100 and 250 µg/L respectively. JSM Nanotechnol Nanomed 2(2): 1025 (2014)
vs vs vs vs vs
Figure 5 Shows population growth as measured by optical density of bacteria exposed to bulk silver nitrate. Concentrations assayed were 0, 100, 250, and 500 µg/L. Bacterial growth is eradicated at all concentrations greater than 50 µg/L. Bacterial growth is delayed by 3 hours at 50 µg/L.
Table 2 shows for the 40nm citrate-coated nanoparticles that for all treatments of these particles the value of r is negative. This follows automatically since the value of r is dependent on the difference in the ln CFU, which is negative in this experiment. The magnitude of r is concentration dependent, with the lowest values observed at the highest concentrations of nanoparticles. The
4/9
Tajkarimi et al. (2014) Email:
Central implication of this is that prolonged exposure of these bacteria to 40nm citrate-coated bacteria at the highest concentrations should cause extinction of the culture. It should also be noted that the concentrations of 40nm nanoparticles used (2000 – 6000 µg/L) to achieve these negative growth rates were much higher than for either 10nm or bulk silver.
Figure 2 shows that the bacteria can achieve some population growth in the presence of 40nm PVP-coated nanoparticles as measured by the mean optical density of the bacteria at the concentrations assayed (2000, 4000, 5000, and 6000 µg/L respectively.) There is a lag in the growth of the PVP-coated 40 nm treatments compared to the control. Growth does not begin in these treatments until after 12 hours. Table 1 reports the differences in the ln CFUs at 0 and 24 hours are all positive for this experiment. Again the control treatment showed the most substantial positive growth in CFU’s (increasing by about 1 log unit in 24 hours). At each concentration the bacteria continue to grow; this is also concentration dependent, with the least amount of difference occurring at concentrations exceeding 2000 µg/L. As measured by optical density, the increases of concentrations of 2000 to 5000 µg/L are similar and bacterial growth at 6000 µg/L lags behind that of the lower concentrations at the end of 24 hours. This is contradicted by the more accurate CFU measurements which show an inconsistent pattern of population increase by concentration as shown in Tables 1 (CFU difference) and 2 (intrinsic rate of increase). These results allow a comparison of the efficacy of citrate- versus PVP-coated 40nm spherical nanoparticles. At this size and range of concentrations, citrate is more effective than PVP-coated nanoparticles for controlling bacterial growth. Figure 3 illustrates that bacteria can achieve population growth in the presence of 10nm citrate-coated nanoparticles as measured by mean optical density of bacteria at the concentrations assayed (100, 250, 500, 750, and 1000 µg/L respectively). The results indicate that the smaller nanoparticles (10nm) are effective at a much lower concentration than the larger nanoparticles (40nm), per previous studies. At 100 and 250 µg/L, we observe a clear lag in the growth compared to the control (6 hours). Growth is effectively wiped out at the higher concentrations (500 – 1000 µg/L). The ln CFUs at 0 and 24 hours (Table 1) are positive for 100 and 250 µg/L and become negative at the higher concentrations. As in the previous experiments, this is concentration dependent via optical density measure, and inconsistent with concentration via the CFU measure. The highest reduction was observed at 750 µg/L (> -4.29), with 1000 mg/L showing somewhat less at (> -2.90).This is also mirrored in the inconsistent pattern of population increase by concentration as shown in (Table 2) (intrinsic rate of increase). Figure 4 show the pattern of population growth in the presence of 10nm PVP-coated nanoparticles as measured by the mean optical density of the bacteria at the concentrations assayed (100, 250, 500, 750, and 1000 µg/L respectively). Again, as with citrate, the results indicate that the smaller PVP nanoparticles (10nm) are effective at a much lower concentration than the larger PVP nanoparticles (40nm), per previous studies. At 100 and 250 µg/L we again observe a clear lag in the bacterial growth compared to the controls (6 hours). Growth is effectively wiped JSM Nanotechnol Nanomed 2(2): 1025 (2014)
Table 2: Intrinsic Rate of Increase ( r ) by experiment and treatment. Citrate-coated 40nm
Control
2000
4000
5000
6000
0.097
-0.075
-0.168
-0.216
-0.216
Mean r SD r
0.004
0.003
0.003
2000
4000
5000
6000
0.097
0.055
0.030
0.058
0.033
SD r
0.004
0.003
0.005
0.005
Citrate-coated 10nm
0.003
Control
100
250
500
750
1000
0.093
0.084
0.045
-0.091
-0.175
-0.122
Mean r SD r
0.001
0.006
0.003
0.001
0.005
PVP-coated 10nm
0.002
Control
100
250
500
750
1000
0.093
0.076
-0.031
-0.058
-0.076
-0.102
Mean r SD r
0.001
SD r
0.003
Control Mean r
Mean r
0.003
PVP-coated 40nm
0.002
0.000
0.001
Bulk Silver Nitrate
Control
50
0.090
0.079
0.000
0.003
100
0.001
250
500
1000
0.002
2000
-0.099 -0.173 -0.269 -0.316 -0.316 0.016
0.000
0.000
(All concentrations are µg/L, all rates are per hour)
0.000
0.000
Table 3: Bulk Silver Nitrate, Non-Linear Regression – Concentration versus log CFU Difference. r
r2
Adj. r2
S.E. of Estimate
0.930
0.876 S.E.
0.853 t
0.669
0.284
1.44
1-- 2 logs) were observed at all concentrations greater than 50 µg/L. The non-linear regression was highly significant (see Table 3).
Silver nanoparticles
Figure 7 SEM images of E. coli MG1655. (a) Non-treated. (b) Treated with 20 µg/l 40 nm PVP coated spherical silver nanoparticles. Silver nanoparticle accumulation is apparent on the surface of the treated bacterial cell.
2 um
2 um
Figure 8 AFM images of E. coli MG1655. (a) Non-treated. (b) Treated with 250 µg/l 10 nm citrate-coated spherical silver nanoparticles. There is a distinctive surface change on cell wall structure in response to treatment. JSM Nanotechnol Nanomed 2(2): 1025 (2014)
6/9
Tajkarimi et al. (2014) Email:
Central effective (~2X) in reducing bacterial population size at all higher concentrations (500 –1000µg/L). Figure 5 shows the pattern of population growth in the presence of bulk silver nitrate as measured by the mean optical density of the bacteria at the concentrations assayed (50, 100, 250, 500, 1000, and 2000 µg/L respectively). These ranges were chosen to allow comparison of the effectiveness of bulk silver nitrate versus both the 10 and 40nm nanoparticles. The results show that bulk silver nitrate can effectively control bacterial growth at >100 µg/L, superior to the 10nm nanoparticles. There is a three hour lag in bacterial growth compared to the controls at a concentration of 50 µg/L. Bacterial growth is effectively wiped out at the higher concentrations (100 – 2000 µg/L). The ln CFUs at 0 and 24 hours (Table 1) are consistent and show a strong relationship with concentration (Figure 6). This relationship has the form of diminishing returns, with concentrations higher than 500 reducing the cultures by > 6 ln units. As expected, all intrinsic rates of increase at concentrations higher than 50 µg/L are negative and highly concentration dependent as well (Table 2).These data all together indicate that the efficacy of the various silver treatments with regard to minimum concentration required to eliminate bacterial growth are PVP-coated 40nm