On-line Predictive Load Shedding for Network Monitoring Pere Barlet-Ros1 , Diego Amores-L´opez1 , Gianluca Iannaccone2 , Josep Sanju`as-Cuxart1 , and Josep Sol´e-Pareta1 1
Technical University of Catalonia (UPC), Computer Architecture Dept. Jordi Girona, 1-3 (Campus Nord D6), Barcelona 08034, Spain {pbarlet,damores,jsanjuas,pareta}@ac.upc.edu 2 Intel Research 15 JJ Thomson Avenue, Cambridge CB3 0FD, UK
[email protected]
Abstract. Building robust network monitoring applications is hard given the unpredictable nature of network traffic. Complex analysis on streaming network data usually leads to overload situations when presented with anomalous traffic, extreme traffic mixes or highly variable rates. We present an on-line predictive load shedding scheme for monitoring systems that quickly reacts to overload situations by gracefully degrading the accuracy of analysis methods. The main novelty of our approach is that it does not require any knowledge of the monitoring applications. This way we preserve a high degree of flexibility, increasing the potential uses of these systems. We implemented our scheme in an existing network monitoring system and deployed it in a research ISP network. Our experiments show a 10-fold improvement in the accuracy of the results during long-lived executions with several concurrent monitoring applications. The system efficiently handles extreme load situations, while being always responsive and without undesired packet losses. Key words: Network monitoring, load shedding, resource management, traffic sampling, resource usage monitoring, resource usage prediction
1
Introduction
The processing requirements imposed on network monitoring systems have greatly increased in recent years. Continuous and fine-grained analysis of network traffic is now a basic requirement for this class of systems. For example, there is a growing demand for monitoring applications that require tracking and inspection of a large number of concurrent network connections for intrusion and anomaly detection purposes. These systems must also handle ever-increasing link speeds and highly variable data rates, and be robust to anomalous or extreme traffic mixes. Within the networking research community, several initiatives have been advanced to provision monitoring infrastructures that allow a large number of
users to submit arbitrary traffic queries on live network streams [1, 2]. Recent research proposals have also introduced system designs that provide developers with sufficient flexibility in the definition of the monitoring applications and with the ability to distribute their computations efficiently across the measurement infrastructure [3, 4]. However, proposed designs do not directly address the increasingly serious problem of efficiently handling overload situations, when resource demands clearly exceed the system capacity. The alternative of over-provisioning the system to handle peak rates or any possible traffic mix has two major drawbacks. First, it would be prohibitively expensive and result in a highly underutilized system based on an extremely pessimistic estimation of workload [5]. Second, it would necessarily lead to reduce its flexibility and possible applications [6]. We have designed a load shedding scheme that allows current network monitoring systems to sustain the rapidly increasing data rates, number of users and complexity of analysis methods, with minimum impact on the accuracy of the results. The main novelty of our approach is that it does not require any explicit knowledge of the queries or the type of computations they perform (e.g., flow classification, maintaining aggregate counters, pattern search). In a previous work [7], we proposed a method to predict the resource usage of arbitrary and continuous network traffic queries. Our method (briefly reviewed in Section 3) automatically identifies, from small sequences of the incoming packet streams, the traffic feature(s) that best model the cost of each query (e.g., the number of packets, bytes, unique source IP addresses, etc.) and uses them to accurately predict the CPU usage. In this paper, we extend that work by defining how this short-term prediction can be used to guide the system on deciding when, where and how much load to shed in the presence of overload (Section 4). We present long-lived experiments on a research ISP network, where the traffic load and query requirements exceed by far the capacity of the monitoring system (Section 5). Our results indicate that, with the load shedding mechanism in place, (i) the system efficiently handles extreme overload situations, while being always responsive and without introducing undesired packet losses, and (ii) the queries can always complete and return results within acceptable error bounds.
2
Related Work
Most of the existing proposals to handle overload situations in network monitoring are based on data reduction techniques, such as packet filtering, aggregation and sampling. The most representative example is arguably Cisco’s NetFlow [8], which aggregates incoming packets into flow records. Sampled NetFlow also resorts to packet sampling to deal with overload situations, while Adaptive NetFlow [9] dynamically adapts the sampling rate to the memory consumption. Keys et al. [6] developed a monitoring system robust to extreme traffic mixes that combines aggregation, adaptive sampling and the use of memory-efficient counting algorithms to extract a set of 12 pre-defined traffic summaries.
Several works have also addressed similar problems in the intrusion detection space. For example, Dreger et al. discuss in [10] several modifications to the Bro NIDS [11], such as dynamically selecting the restrictiveness of the packet filters, to allow Bro to operate in high-speed environments. Gonzalez et al. [12] also propose the inclusion of a secondary path into Bro that implements sampling and filtering to reduce the cost of those analysis tasks that do not require stream reassembly and stateful inspection. The design of mechanisms to handle overload situations is a classical problem in any real-time system and several works have proposed solutions in other environments. For example, in the database community, the Aurora system [13] sheds excess load by inserting additional drop operators in the query data flow, while TelegraphCQ [14] uses approximate query processing techniques to provide delay-bounded answers in the presence of overload. Unfortunately, proposed solutions require the use of declarative query languages with a restricted set of operators, of which cost and selectivity are assumed to be known, hindering the use of those techniques in our context. In the Internet services space, SEDA [15] proposes an architecture to develop highly concurrent server applications, built as networks of stages interconnected by queues. In SEDA, load shedding is achieved by applying admission control on the event queues when an overload situation is detected.
3 3.1
Architecture Monitoring Platform
We chose the CoMo platform [4] to develop and evaluate our load shedding scheme. The platform allows users to define traffic queries as plug-in modules written in C that contain stateful computations. The user is also required to specify a simple stateless filter to be applied to the incoming packet stream, as well as the granularity of the measurements, hereafter called measurement interval (i.e., the time interval that will be used to report continuous query results). In order to provide the user with maximum flexibility when writing queries, CoMo does not restrict the type of computations that a plug-in module can perform. As a consequence, the platform does not have any explicit knowledge of the data structures used by the plug-in modules or the cost of maintaining them. 3.2
Prediction and Load Shedding Overview
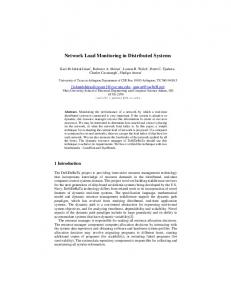
Figure 1 shows the components and data flow in the system. The prediction and load shedding subsystem (in gray) intercepts the packets from the filter before they are sent to the plug-in module implementing the traffic query. The system operates in four phases. First, it groups each 100ms of traffic in a “batch” of packets.3 Each batch is then processed to extract a large set of 3 The choice of 100ms is somewhat arbitrary, but our experimental results indicate that it represents a good trade-off between prediction accuracy and overhead, as we will show in Section 5.2.
Fig. 1. System overview
pre-defined traffic features. A feature is a counter that describes a specific property of the batch. For example, the number of packets, bytes, unique destination IP addresses, 5-tuple flows, etc. The features we compute have the advantage of being lightweight with a deterministic worst case computational cost. An exhaustive description of the 42 traffic features currently supported by our system can be found in [7]. The feature selection subsystem is in charge of selecting the most relevant features according to the recent history of the query’s CPU usage. This phase is important to reduce the overhead of the prediction algorithm, because it allows the system to discard beforehand the features regarded as useless for prediction purposes. This subset of relevant features is then given as input to the multiple linear regression (MLR) subsystem to predict the CPU cycles required by the query to process the entire batch. When the prediction exceeds the available cycles, the load shedding subsystem pre-processes the batch to discard a portion of the packets. Finally, the actual CPU usage is computed and fed back to the prediction subsystem to close the loop. The feature extraction, feature selection and multiple linear regression phases were already described and evaluated in [7]. In the following sections we focus on the load shedding component of the system.
4
Load Shedding
In this section, we provide the answers to the three fundamental questions any load shedding scheme needs to address: (i) when to shed load (i.e., which batch), (ii) where to shed load (i.e., which query) and (iii) how much load to shed (e.g., the sampling rate to apply). Algorithm 1 presents our load shedding scheme in detail, which uses the output of the prediction subsystem described in Section 3. 4.1
When to shed load
To decide when to shed load the system maintains a threshold (avail cycles) that accounts for the amount of cycles available in a time bin to process queries. Since batch arrivals are periodic (e.g., every 0.1s in our implementation), this threshold can be dynamically computed as (timebin × CP U f req.) − overhead, where overhead stands for the cycles needed by our prediction subsystem (ps cycles),
Algorithm 1: Load shedding algorithm Input: Q: Set of qi queries bi : Batch to be processed by qi after filtering como cycles: CoMo overhead cycles rtthresh, delay: Buffer discovery parameters 1 2 3 4 5 6 7 8 9 10 11 12 13 14 15 16 17
srate = 1; pred cycles = 0; foreach qi in Q do fi = feature extraction(bi ); si = feature selection(fi , hi ); pred cycles += mlr(fi , si , hi ); avail cycles = (time bin × CPU frequency) - (como cycles + ps cycles) + (rtthresh - delay); if avail cycles < pred cycles × (1 + e\ rror) then \
avail cycles−ls cycles srate = pred ; cycles×(1+error) \ foreach qi in Q do bi = sampling(bi , qi , srate); fi = feature extraction(bi ); P ls\ cycles = α × i ls cyclesi + (1 − α) × ls\ cycles;
foreach qi in Q do query cyclesi = run query(bi , qi , srate); hi = update mlr history(hi , fi , query cyclesi ); ˛ ˛ ˛ ˛ cycles + (1 − α) × e\ rror; e\ rror=α × ˛1 − P pred query cyclesi ˛ i
plus those spent by other CoMo tasks (como cycles) not directly related to query processing (e.g., packet collection, disk and memory management). The CPU usage is measured using the time-stamp counter, as described in [7]. When the predicted cycles for all queries (pred cycles) exceed the avail cycles threshold, excess load needs to be shed. We observed that, for certain time bins, como cycles is greater than avail cycles, due to CoMo implementation issues (i.e., other CoMo tasks can occasionally consume all available cycles). This would force the system to discard entire batches, having a negative impact on the accuracy of the prediction and query results. However, this situation can be minimized considering the presence of buffers (e.g., in the capture devices) that allow the system to use more cycles than those available in a single time bin. That is, the system can be delayed in respect to real-time operation as long as it is stable in the steady state. We use an algorithm, inspired in the way TCP determines the size of the congestion window [16], to dynamically discover by how much the system can safely (i.e., without loss) exceed the avail cycles threshold. The algorithm continuously monitors the system delay (delay), defined as the difference between the cycles actually used and those available in a time bin, and maintains a threshold (rtthresh) that controls the amount of cycles the system can be delayed without
loss. rtthresh is initially set to zero and gets increased whenever queries use less cycles than available. If at some point, the occupation of the buffers exceeds a predefined value (i.e., the system is turning unstable), rtthresh is reset to . rtthresh grows zero, and a second threshold (initialized to ∞) is set to rtthresh 2 exponentially while below this threshold, and linearly once it is exceeded. This technique has two main advantages. First, it is able to operate without explicit knowledge of the maximum rate of the input streams. Second, it allows the system to quickly react to changes in the traffic. Algorithm 1 (line 7) shows how the avail cycles threshold is modified to consider the presence of buffers. Note that, at this point, delay is never less than zero, because if the system used less cycles than the available in a previous time bin, they would be lost waiting for the next batch to become available. Finally, as we further discuss in Section 4.3, we multiply the pred cycles by 1 + e\ rror in line 8, as a safeguard against prediction errors, where e\ rror is an Exponential Weighted Moving Average (EWMA) of the actual prediction error measured in previous time bins (computed as shown in line 17). 4.2
Where and how to shed load
Our approach to shed excess load consists of adaptively reducing the volume of data to be processed by the queries (i.e., the size of the batch). We already discussed in Section 2 several data reduction techniques that can be used for this purpose (e.g., filtering, aggregation and sampling). In our current implementation, we support uniform packet and flow sampling, and let each query select at configuration time the option that yields the best results. When an overload situation is detected, the same sampling rate is applied to all queries (line 11).4 In order to efficiently implement flow sampling, we use a hash-based technique called Flowwise sampling [17]. This technique randomly samples entire flows without caching the flow keys, which reduces significantly the processing and memory requirements during the sampling process. To avoid bias in the selection and deliberate sampling evasion, we randomly generate a new H3 hash function [18] per query every measurement interval, which distributes the flows uniformingly and unpredictably. 4.3
How much load to shed
The magnitude of load shedding is determined by the maximum sampling rate that keeps the CPU usage below the avail cycles threshold. Since the system does not differentiate among queries, the sampling rate could be simply set to the cycles ratio avail pred cycles in all queries. This assumes that their CPU usage is proportional to the size of the batch (in packets or flows, depending on whether packet or flow sampling is used). However, the cost of a query can actually depend on 4 Note that using the same sampling rate for all queries does not differentiate among them. See Section 6 for further discussion.
several traffic features, or even on a feature different from the number of packets or flows. In addition, there is no guarantee of keeping the CPU usage below the avail cycles threshold, due to the error introduced by the prediction subsystem. We deal with these limitations by maintaining an EWMA of the prediction error (line 17) and correcting the sampling rate accordingly (line 9). Moreover, we have to take into account the extra cycles that will be needed by the load shedding subsystem (ls cycles), namely the sampling procedure (line 11) and the feature extraction (line 12), which must be repeated after sampling in order to correctly update the MLR history. Thus, we also maintain an EWMA of the cycles spent in previous time bins by the load shedding subsystem (line 13) and subtract this value from avail cycles. After applying the mentioned changes, the sampling rate is computed as shown in Algorithm 1 (line 9). The EWMA weight α is set to 0.9 in order to quickly react to changes. It is also important to note that if the prediction error was zero in average, we could remove it from lines 8 and 9, because buffers should be able to absorb such error. However, there is no guarantee of having a mean of zero in the short term.
5
Evaluation and Operational Results
In this section we evaluate our load shedding system in a research ISP network. We also assess the impact of sampling on the accuracy of the queries, and compare the results of our predictive scheme to a system that uses instead a reactive approach, discarding packets when the buffers become full. We do not present here the accuracy of the prediction subsystem, which was already evaluated in [7]. 5.1
Testbed Scenario
Our testbed equipment consists of two single processor Pentium IV at 3 GHz, both equipped with an Endace DAG 4.3GE card [19]. Through a pair of optical splitters, both computers receive an exact copy of one direction of a full-duplex Gigabit Ethernet link that connects the Catalan RREN (Scientific Ring) to the Spanish NREN (RedIRIS). The first PC is used to run the CoMo monitoring system on-line, while the second one only collects a packet-level trace, which is used as our reference to verify the accuracy of the results. Throughout the evaluation, we present the results of two 8 hours-long executions (see Table 1 and Figure 3(a) for details). In the first one (load shedding), we ran a modified version of CoMo that implements our load shedding scheme,5 while in the second execution (original como), we repeated the same experiment, but using the original version of CoMo. The duration of the executions was determined according to the amount of storage space available to collect the packet-level traces (400 GB). 5 The source code of our load shedding system is publicly available at http://loadshedding.ccaba.upc.edu.
Table 1. Executions done in our experiments Link load (Mbps) mean/max/min load shedding 24/Oct/06 9:00-17:00 750.4/973.6/129.0 original como 25/Oct/06 9:00-17:00 719.9/967.5/218.0 Execution
Date/Time
We have selected a set of seven queries that are part of the standard distribution of CoMo (see Table 2).6 They present different resource usage profiles (CPU, memory and disk bandwidth) for the same input traffic and use different data structures to maintain their state (e.g., aggregated counters, hash tables, sorted lists). Note that our method considers all queries as black boxes. Table 2. Queries used in the experimental evaluation Name application counter flows high-watermark pattern search top destinations trace
5.2
Description Port-based application classification Traffic load in packets and bytes Per-flow counters High watermark of link utilization Finds sequences of bytes in the payload List of the top-10 destination IPs Full-payload collection
Performance Results
Figure 2 presents the CPU usage during the load shedding execution, broken down by the three main tasks presented in Section 4 (i.e., como cycles, query cycles and ps cycles + ls cycles). We also plot the cycles the system estimates as needed to process all incoming traffic (i.e., pred cycles). From the figure, it is clear that the system is under severe stress because, during almost all the execution, it needs more than twice the cycles available to run our seven queries without loss. However, we can observe that our load shedding system is able to keep the CPU usage consistently below the 3 GHz mark. Figure 3(a) confirms that, during the 8 hours, not a single packet was lost. This indicates that predictions are accurate and the system is robust to overload. In Figure 3(b), we plot the Cumulative Distribution Function (CDF) of the CPU usage per batch (i.e., the service time per batch). Recall that batches represent 100ms, resulting in 3 × 10⁸ cycles available per batch. The figure shows that the system is stable. As expected, sometimes the limit of available cycles is slightly exceeded owing to the buffer discovery algorithm presented in Section 4.1. The 6 The source code of the queries used in the evaluation is publicly available at http://como.sourceforge.net.
9
9
x 10
CPU usage [cycles/sec]
8 7 6 CoMo cycles Load shedding cycles Query cycles Predicted cycles CPU frequency
5 4 3 2 1
0 09:00 10:00 11:00 12:00 13:00 14:00 15:00 16:00 17:00 time [hh:mm]
Fig. 2. CPU usage (load shedding execution)
CDF also indicates good CPU usage, between 2.5 and 3 × 10⁸ cycles, with a probability around 90%. On the contrary, Figure 3(b) shows that, for the original como execution, the service time per batch is significantly larger than the arrival time of batches, with a probability of exceeding the limit of available cycles greater than 30%. Thus, this system is unstable and leads not only to drops of packets without control, but even of entire batches. Figure 3(a) shows the packets dropped by the DAG card,7 while Figure 3(b) certifies that the probability of losing an entire batch (i.e., service time of zero) is larger than 20%.
4
x 10
Load shedding 1 0.9
Total DAG drops Unsampled
5
0 09:00 10:00 11:00 12:00 13:00 14:00 15:00 16:00 17:00 time [hh:mm] 4
x 10
Original CoMo
packets/sec
10
0.8 0.7 F(CPU usage)
packets/sec
10
0.6 0.5 0.4 0.3
CPU cycles per batch Load shedding Original CoMo
0.2
5 Total DAG drops 0 09:00 10:00 11:00 12:00 13:00 14:00 15:00 16:00 17:00 time [hh:mm]
(a) Link load and packet drops
0.1 0 0
2
4
6 8 10 12 CPU usage [cycles/batch]
14
16 8
x 10
(b) CDF of the CPU usage per batch
Fig. 3. Performance of our load shedding system compared to the original CoMo
7 The values are a lower bound of the actual drops, because the loss counter present in the DAG records is only 16-bit long.
5.3
Accuracy Results
We modified the source code of the counter, flows and top destinations queries, in order to allow them to estimate their unsampled output when load shedding is performed. This modification was simply done multiplying the metrics they compute by the inverse of the sampling rate applied to each batch. We chose the counter and flows queries mainly to verify our implementation of packet and flow sampling, respectively. In particular, we measured the relative value error in the number of packets, bytes and flows, defined as |1 − estimated actual value |, where the actual value is obtained from the complete packet trace. Conversely, the top destinations query was chosen to evaluate the impact of our current load shedding mechanisms on a query that computes a metric known to be statistically more complex and problematic [17, 20]. In this case, we selected packet sampling as load shedding mechanism [20]. In order to objectively measure the error, we used the detection performance metric proposed in [20], which is defined as the number of misranked flow pairs, where the first element of a pair is in the top-10 list returned by the query and the second one is outside the actual top-10. Table 3 presents the error in the results of these three queries averaged across all the measurement intervals. We can observe that although our load shedding system introduces a certain overhead, the error is kept significantly low compared to the original version of CoMo. Large standard deviation values are due to long periods of consecutive packet drops during the original como execution. It is also worth noting that the error of the top destinations query obtained in the load shedding execution is consistent with that of [20].
Table 3. Errors in the query results (mean ± stdev) Query counter (packets) counter (bytes) flows top destinations
original como 55.03% ±11.45 55.06% ±11.45 38.48% ±902.13 21.63 ±31.94
load shedding 0.54% ±0.50 0.66% ±0.60 2.88% ±3.34 1.41 ±3.32
Figure 2 shows the overhead introduced by our load shedding system (ps cycles+ ls cycles) to the normal operation of the entire CoMo system. We believe this overhead is reasonably low compared to the advantages of keeping the CPU usage and the accuracy of the results well under control. The bulk of the overhead, as discussed in [7], corresponds to the feature extraction phase, which is entirely implemented using a family of memory-efficient algorithms that could be directly built in hardware [21]. Alternatively, this overhead could be reduced significantly by applying sampling in this phase.
6
Conclusions and Future Work
In this paper, we presented a predictive load shedding scheme that operates without explicit knowledge of the traffic queries and quickly reacts to overload situations by gracefully degrading their accuracy via packet and flow sampling. We implemented our scheme in an existing monitoring system and evaluated its performance and correctness in a research ISP network. We demonstrated the robustness of our method through an 8 hours-long continuous execution, where the system exhibited good CPU utilization without packet loss, even when it was under severe stress. We also pointed out a significant gain in the accuracy of the results compared to the original version of the same monitoring system. We also identified several limitations of our current implementation that constitute an important part of our immediate future work. First, our method does not differentiate among queries. Hence, we are currently investigating the use of different sampling rates for different queries according to per-query utility functions, as proposed in [13]. Second, there is a large set of imaginable queries that are not able to correctly estimate their unsampled output from sampled streams. For those queries, we plan to support many different load shedding mechanisms, such as computing lightweight summaries of the input data streams [14] and more robust flow sampling techniques [22]. Declarative load shedding is also part of our future work, which will allow the queries to specify their own load shedding mechanisms. Finally, we are interested in applying similar techniques to other system resources, such as memory, storage space and disk bandwidth. Acknowledgments. This work was funded by a University Research Grant awarded by the Intel Research Council, and by the Spanish Ministry of Education (MEC) under contract TEC2005-08051-C03-01 (CATARO project). Authors would also like to thank the Supercomputing Center of Catalonia (CESCA) for allowing them to collect the packet traces used in this work.
References 1. The OneLab project: http://www.fp6-ist-onelab.eu. 2. kc claffy, Crovella, M., Friedman, T., Shannon, C., Spring, N.: Community-oriented network measurement infrastructure (CONMI) workshop report. SIGCOMM Comput. Commun. Rev. 36(2) (2006) 41–48 3. Cranor, C., Johnson, T., Spataschek, O., Shkapenyuk, V.: Gigascope: A stream database for network applications. In: Proceedings of ACM Sigmod, New York, NY, USA, ACM Press (June 2003) 647–651 4. Iannaccone, G.: Fast prototyping of network data mining applications. In: Proceedings of Passive and Active Measurement Conference. (March 2006) 5. Stankovic, J., Lu, C., Son, S., Tao, G.: The case for feedback control real-time scheduling. In: Proceedings of the 11th Euromicro Conference on Real-Time Systems. (June 1999) 11–20 6. Keys, K., Moore, D., Estan, C.: A robust system for accurate real-time summaries of internet traffic. In: Proceedings of ACM Sigmetrics, New York, NY, USA, ACM Press (2005) 85–96
7. Barlet-Ros, P., Iannaccone, G., Sanju` as-Cuxart, J., Amores-L´ opez, D., Sol´e-Pareta, J.: Predicting resource usage of arbitrary network traffic queries. Technical report, Technical University of Catalonia (December 2006) http://loadshedding.ccaba.upc.edu/prediction.pdf. 8. Cisco Systems: NetFlow services and applications. White Paper (2000) 9. Estan, C., Keys, K., Moore, D., Varghese, G.: Building a better NetFlow. In: Proceedings of ACM Sigcomm, New York, NY, USA, ACM Press (August 2004) 245–256 10. Dreger, H., Feldmann, A., Paxson, V., Sommer, R.: Operational experiences with high-volume network intrusion detection. In: Proceedings of ACM Conference on Computer and Communications Security, New York, NY, USA, ACM Press (2004) 2–11 11. Paxson, V.: Bro: A system for detecting network intruders in real-time. Computer Networks 31 (1999) 2435–2463 12. Gonzalez, J., Paxson, V.: Enhancing network intrusion detection with integrated sampling and filtering. In: Proceedings of International Symposium on Recent Advances in Intrusion Detection. (2006) 272–289 13. Tatbul, N., C ¸ etintemel, U., Zdonik, S.B., Cherniack, M., Stonebraker, M.: Load shedding in a data stream manager. In: Proceedings of International Conference on Very Large Data Bases. (2003) 309–320 14. Reiss, F., Hellerstein, J.M.: Declarative network monitoring with an underprovisioned query processor. In: Proceedings of International Conference on Data Engineering, Los Alamitos, CA, USA, IEEE Computer Society (2006) 56–67 15. Welsh, M., Culler, D.E., Brewer, E.A.: SEDA: An architecture for well-conditioned, scalable internet services. In: Proceedings of ACM Symposium on Operating System Principles, New York, NY, USA, ACM Press (2001) 230–243 16. Stevens, W.R.: TCP Slow Start, Congestion Avoidance, Fast Retransmit, and Fast Recovery algorithms. RFC 2001 (January 1997) 17. Duffield, N.: Sampling for passive internet measurement: A review. Statistical Science 19(3) (2004) 472–498 18. Carter, J.L., Wegman, M.N.: Universal classes of hash functions. Journal of Computer and System Sciences 18(2) (1979) 143–154 19. Endace: http://www.endace.com. 20. Barakat, C., Iannaccone, G., Diot, C.: Ranking flows from sampled traffic. In: Proceedings of ACM conference on Emerging network experiment and technology, New York, NY, USA, ACM Press (2005) 188–199 21. Estan, C., Varghese, G., Fisk, M.: Bitmap algorithms for counting active flows on high speed links. In: Proceedings of ACM SIGCOMM Conference on Internet Measurement. (2003) 153–166 22. Duffield, N., Lund, C., Thorup, M.: Flow sampling under hard resource constraints. In: Proceedings of ACM Sigmetrics. (2004) 85–96


![stop load shedding - NAG [PDF]](https://m.moam.info/img/260x300/stop-load-shedding-nag-pdf_648d884b098a9e88478b45b4.jpg)