University Group for Identification Technologies (GUTI) - Dpt. Electronics ... verification is the process in which, for a given signature who belongs to a user, a.
On-line Signature Biometrics using Support Vector Machine Aitor Mendaza-Ormaza, Oscar Miguel-Hurtado, Ivan Rubio-Polo, Raul Alonso-Moreno University Group for Identification Technologies (GUTI) - Dpt. Electronics Technology University Carlos III of Madrid Avda. Universidad, 30 E-28911 Leganés (Madrid); SPAIN {amendaza, omiguel, irubio, ramoreno}@ing.uc3m.es
1 Introduction Handwritten signature has long been established as the most diffuse mean for personal verification in our daily life. It is commonly, in general, in all kind of legal documents and transactions. Therefore, within all biometric modalities, signature is probably the widest accepted. On the other hand, signature is a behavioural characteristic of individuals, and therefore is considered being weaker against fraud. Signature verification is the process in which, for a given signature who belongs to a user, a decision is made whether the signature has been made by that user, a genuine signature, or has been made by another user, a forgery signature. Typically, forged signatures have been classified into three groups: (1) random, (2) simple and (3) skilled [SB00]. The different methods for signature verification can be divided in two main groups: off-line (static) and on-line (dynamic). The off-line techniques are based in processing the digitalized grey-scale image of the signature written on a paper. On the contrary, on-line techniques take into account dynamic characteristics of the signature such as pressure exerted, tilts, position or velocity of the stylus. All this signals provide, not only information of the signature, but also information about the act of signing, which is consider more related to the specific user.
2 Support Vector Machines SVM is a learning method introduced by V. Vapnik [CV95][Va95], for two-group classification problems. The machine maps the input vectors, with a non-linear mapping, to a very high-dimension feature space. In this feature space a decision surface (a hyperplane) is built which maximizes the distance from either class to the hyperplane and separates the largest possible number of points belonging to the same class on the same side (maximal margin between the vectors of the two classes). Therefore the misclassification error of data both in the training set and test set is minimized.
185
The basic algorithm of the SVMs uses linear thresholds. But with a simple change of the function (kernel) of the algorithm, K(u,v), the SVMs can be used to learn other thresholds such as, Radial Based Functions (RBF) networks, or N-layer sigmoid neural networks. Authors have used a one-against-all approach. N genuine signatures are taken for one class, and M skilled forgeries are taken as the data for the other class. With this set, an SVM is trained and a model is obtained for each user.
3 Database and signal pre-processing 3.1 Data used for this work The study of features extracted form a signature and the experimental evaluation of the on-line signature verification system was carry out thanks to the MCyT-SignatureDatabase Corpus, which is publicly available. This database is constituted of 100 different users. Each user has produced 25 genuine signatures, and 25 skilled forgeries are also captured. To capture the signatures of the database, a Wacom Intous A6 USB graphic tablet was used. 3.2 Pre-processing and Derived Features The raw signals captured at MCyT need pre-processing to reduce noise and irrelevant information. In this paper the following pre-processing steps are used: i) Smoothing of the five temporal functions (x-axis, y-axis, pressure, azimuth and inclination) by a low pass filter to eliminate the noise introduced by the graphic tablet in the data capture. ii) Time normalization. iii) Location normalization: x-axis and y-axis temporal function are normalized through the mean of those function. iv) Size normalizing: x-axis and y-axis are normalized through the norm of the 2 dimension vector [x,y]. Pressure, azimuth and inclination are normalized by their maximum values. v) We then calculate the Speeds and Acceleration of the coordinates x-axis, y-axis, pressure, azimuth and inclination. 3.3 Features Study and Discrimination In order to use the most suitable set of features for on-line signature verification, a set of 138 features has been analyzed. This set of 138 features is obtained considering all signals given in the database (x, y, pen pressure p, pen azimuth az, pen inclination in). Also, as mentioned before, speeds and accelerations have been considered (sx, sy, sp, saz, sin, ax, ay, ap, aaz, ain). More precisely, for each of the primary coordinates captured directly by the tablet, 10 features have been analyzed. This means 50 features for a single signature. For each speed (s) and acceleration (a) (sx, sy, sp, saz, sin, ax, ay, ap, aaz, ain) of the primary coordinates, 8 features have been analyzed. Again, this means 80 features extracted from the 5 speeds and 5 accelerations. Moreover, 8 global features have also been analyzed. Therefore, a total of 138 features are obtained.
186
In order to obtain the optimal features for biometric verification, analysis using Fisher’s Ratio has been done. In order to reduce even further the number of features obtained by mean of the Fishers’ Ratio, a Principal Component Analysis (PCA) has also been employed. PCA can be defined as a process to get a few linear combinations which can be used to summarize data, losing as little information as possible. As it will be shown in the next section, a subset of features has been made up with a really small loss of discrimination.
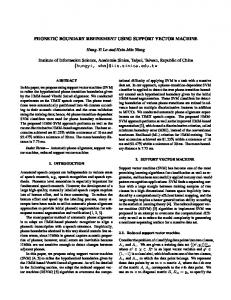
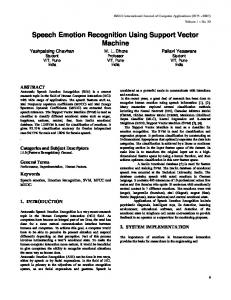
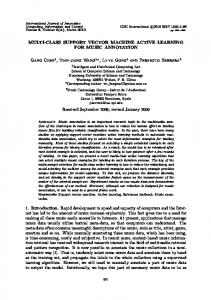
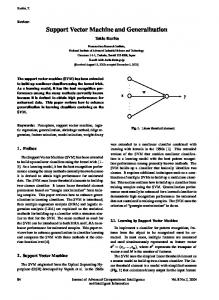
4 Experimental Results A Classification’s Error study has been carried out to measure discriminative power of the subset of features. Taking the first subset of features from Fisher’s Ratio, the PCA process to discard features has been carried out. This has been done calculating the Classification’s Error in each step to know the discriminative power of the feature subsets. The results obtained has lead to the authors to select two subsets, one of 27 features, and a second of only 10 features for applications where the data-size has a critical significance. The Classification’s Error obtained is of 5% with the 27 Feature Set and of 6.5% with the 10 Feature Set. Once the two subsets have been chosen, a complete experimental evaluation for the proposed SVM algorithm has been conducted on MCyT Signature Database. Forgeries are classified into Random forgeries and Skilled ones. All signatures in database, both genuine and forgeries, from others users will be used as random forgeries for a determined user. Two parameters have been studied to know their influence in the authentication task: i) Number of signatures taken for enrolment process. It has been carried out experiments using 4 sets: 5 genuine and 5 skilled forgeries (set I), 5 genuine and 10 skilled forgeries (set II), 10 genuine and 5 skilled forgeries (set III) and 10 genuine and 10 skilled forgeries (set IV). ii) Number of Features. Both subsets, with 10 and 27 features have been analyzed. The results obtained by the authors shows that the use of unbalanced sets of training signatures (sets II and III) only moves the EER in the FRvsFAF graphic to the left of the zero (set II) or to the right of the zero (set III). The improvement of the error trade-off curves between sets I and IV is very small and is not worth the effort of the user in the enrolment phase. FR vs FAF SETI
100
FR vs FAF SET II
70 FR SETI F27 FAR SETI F27 FR SETI F10 FAR SETI F10
90 80
FR SETII F27 FAF SETII F27 FR SETII F10 FAF SETII F10
60 50
70 60
40
50
30 40
20
30 20
10
10 0 -1
-0.8
-0.6
-0.4
-0.2
0
0.2
0.4
0.6
0.8
0 -0.8
1
187
-0.6
-0.4
-0.2
0
0.2
0.4
0.6
0.8
1
FR vs FAF SET III
80
FR vs FAF SET IV
100 FR SETIII F27 FAF SETIII F27 FR SETIII F10 FAF SETIII F10
70 60
FR SETIV F27 FAF SETIV F27 FR SETIV F10 FAF SETIV F10
90 80 70
50
60
40
50 40
30
30
20
20 10 0 0.8
10 0.82
0.84
0.86
0.88
0.9
0.92
0.94
0.96
0.98
0 -1
1
-0.8
-0.6
-0.4
-0.2
0
0.2
0.4
0.6
0.8
1
5 Conclusion This paper introduces a complete methodology for feature selection using Fishers’ Ratio in a first steep, and Principal Component Analysis to fine tune the selection. This has been applied to on-line handwritten signature biometrics. Also, throughout this work, Support Vector Machines has revealed as a successfully model for this biometric modality. This paper studied how the different parameters of the SVM and the appropriate choosing of elements for training (number of Features, number of signatures) are critical to obtain good performance of the system.
6 Acknowledgements Authors would like to thank J. Ortega-Garcia and J. Fierrez-Aguilar for the provision of the MCyT Signature Database. This work has been funded by the Spanish Ministry of Science and Education (TEC2006-12365).
Bibliography [CV95] C.Cortes and V.Vapnik, “Support-vector networks. Machine Learning”, vol. 20, pp. :273-297, Nov. 1995. [SB00]
Sansone and Vento, “Signature Verification: Increasing Performance by a Multi-Stage System”, Pattern Analysis & Applications, vol. 3, pp. 169–181, 2000.
[Va95]
V.Vapnik, “The Nature of Statistical Learning Theory”, Springer, 1995.
188