Content based Texture Image Retrieval, Texture Analysis, and. Fuzzy logic. Keywords. Discrete ... bricks, tree, fabric, grass, hair, clouds, etc. It contains information ..... for texture classification and discrimination in large image databases, Proc.
International Journal of Computer Applications (0975 – 8887) Volume 18– No.3, March 2011
On Scale Invariance Texture Image Retrieval using Fuzzy Logic and Wavelet Co-occurrence based Features Shailendrakumar M. Mukane Department of Electronics and Telecommunication Engg. SVERI’s College of Engineering, Pandharpur, Maharashtra State,
Sachin R. Gengaje
Dattatraya S. Bormane
Department of Electronics Engg.
Department of Electronics and Telecommunication Engg. JSPM’s Rajarshi Shahu College of Engineering, Pune, Maharashtra State, India.
Walchand Institute of Technology, Solapur, Maharashtra State, India.
India. 413304.
ABSTRACT In this paper, analysis of the feature selection for scale invariance texture image retrieval using fuzzy logic classifier and wavelet and co-occurrence matrix based feature is carried out. Two types of texture features are extracted one using Discrete Wavelet Transform (DWT) and other using Cooccurrence matrix. Energy and Standard Deviation are obtained from each sub-band of DWT coefficients up to fifth level of decomposition and eight features are extracted from co-occurrence matrix of whole image and each sub-band of first level DWT decomposition. The different size samples of texture image are undertaken. The suitability of features extracted is analyzed using a fuzzy logic classifier. The performance is measured in terms of Success Rate. Best and Worst case analysis is done for each of the feature set and texture image size. Also the minimum number of features required for maximum average success rate is obtained. This study shows that for samples taken from 256x256 texture size, excellent success rate is achieved for Wavelet Statistical Features (WSF) as well as Wavelet Co-occurrence Features (WCF). Also WSF perform better for 128x128 and 256x256 texture image. For both the types of features performance degrades in case of 512x512 texture image. Worst case analysis shows that energy feature WSF and 8-features group WCF performs excellently.
General Terms Content based Texture Image Retrieval, Texture Analysis, and Fuzzy logic.
Keywords Discrete Wavelet Transform, Wavelet Statistical features, Wavelet Co-occurrence matrix features.
1. INTRODUCTION Generation of digital images and its use is rapidly increasing everyday life of peoples. To access digital library information i.e. available in the form of digital images, it has to be organized properly so as to allow efficient browsing, searching, and retrieval of useful images. Therefore, Image Retrieval becomes an active research area. The drawbacks of manual browsing, searching, and retrieval, can be reduced by Content Based Image Retrieval (CBIR) method where in images are expressed by their visual content of images. A comprehensive literature survey is available [1].
Texture, Shape, and Color are the general visual content features of image. Texture features are very important because it is an intrinsic property of virtually all surfaces such as skin, bricks, tree, fabric, grass, hair, clouds, etc. It contains information about the structural arrangement of surfaces and their relationship to the surrounding environment [2]. Also textures can refer to the visual patterns that have properties of homogeneity that will not result from the presence of only a single color or intensity [3]. Texture analysis is to be carried out for visual content of the texture image. Texture analysis methods can be classified broadly into two categories viz. structural and statistical. Structural methods [4, 5] are useful when the textures are very regular [6] which rarely happen in real life applications. Statistical methods can be useful for texture analysis of images having irregular textures. Weszka et al. [7] compared the classification performance of Fourier power spectrum, second order Gray Level Co-occurrence Matrix (GLCM), and first order statistics of gray level differences. It is tested for terrain samples and commented that Fourier methods performed poorly. Haralick [2] suggested GLCM texture features and used these features to analyze remotely sensed images. Wan et al. [8] presented comparative study of four texture analysis methods such as gray level Run-length method[RLM], Co-occurrence matrix method, Histogram method, and Auto-correlation method and shown that Co-occurrence method is superior. Tamura et al. [9] presented features in accordance with psychological studies on the human perception of texture. Wold decomposition [10] provided another approach to describe textures in terms of perceptual properties. Gabor transform is a special case of Short Time Fourier Transform (STFT). Manjunath and Ma [11] had given a comprehensive performance evaluation of Gabor Wavelet based texture analysis and commented that they are quite robust. Wavelet Transform [12, 13] provides a multiresolution approach for the problem at hand. Smith and Chang [14] used mean and variance extracted from wavelet sub-band coefficients, as the texture representation. Classification methods can be divided into categories such as parametric, non-parametric, stochastic methods, non-metric methods [15]. Classification task involves classifying images based on the feature vectors provided by the feature extraction methods. Classification methods start from Bayesian decision theory. If no prior parameterized knowledge about the probability structure then classification is based on nonparametric techniques. That is classification will be based on information provided by training samples alone. These
10
International Journal of Computer Applications (0975 – 8887) Volume 18– No.3, March 2011 techniques include fuzzy classification, neural network approach, etc. Engin Avci [16] used multilayer perceptron neural network classifier to classify selected texture images. I.Turkoglu, E. Avci [17] presented a comparison of wavelet support vector machine (W-SVM) and wavelet-adaptive network based fuzzy inference system (W-ANFIS) approaches for texture image classification. Both W-SVM and W-ANFIS methods are used for classification of the 22 texture images Lucia Dettori and Semler [18] implemented classification step through a decision tree classifier based on the cross-validation classification & regression tree approach. A decision tree generated a set of rules & integrated it in to the classification system based on the given texture features. G. Schaefer et al. [19] used fuzzy classification for thermograph based breast cancer analysis using statistical features. Wan [8] used 1-Nearest Neighbor & k- Nearest Neighbor techniques to classify the Bark texture images and shown that 1- Nearest neighbor classifier is more appropriate than others. In this study, it is proposed study the features for scale invariance texture retrieval using fuzzy logic. 25 texture images are taken from the Brodatz texture Album. Two types of feature sets are extracted in the feature extraction process viz., discrete wavelet transform based feature set, and wavelet and co-occurrence matrix based feature set. Then the average success rate and minimum success rate for the feature sets are studied with the help of fuzzy classifier to classify texture images for samples of different texture image size.
2. FEATURE EXTRACTION The texture features are extracted using DWT at different level and co-occurrence matrix of whole image and first level of DWT decomposition.
Figure 1: Wavelet Decomposition, (a) one level (b) two level Based on the available wavelet coefficients, Energy (1) and standard deviation (2) of all the sub-bands up to fifth level of decomposition are calculated as features by using the equation (1)
2.1 Wavelet Statistical Features (WSF) The Wavelet transform provides a multi-resolution approach. It decomposes a signal with a family of basis functions obtain through translation and dilation of a mother wavelet. In this the advantage of variable window size is available. The window size can be kept wide for low frequencies and narrow for high frequencies which lead to an optimum timefrequency resolution for complete frequency range. When applied to image, DWT decomposes the image into four subbands followed by the sub-sampling. The sub-bands are namely LL, LH, HL, and HH where L denotes low frequency and H denotes high frequency. Out of four, LH, HL, & HH represent the finest scale wavelet coefficients of details images and LL represents low frequency level coefficients of approximation image. The Pyramid structured Wavelet Transform (PWT) & Tree structured Wavelet Transform (TWT) can be two major types of DWT. The PWT recursively decomposes the LL band only to get 2nd & higher level sub-bands. Figure 1 shows two levels PWT decomposition used in this study. Highest level of decomposition depends upon the wavelet filter used, need of the application and features required for the classification. Coefficients obtained from DWT of approximate & detail sub-bands are the fundamental features. In TWT, other subbands can also be decomposed if required.
(2) where is the energy & is the standard deviation for the k-th sub-band of dimension NxN and coefficients are & mean value is [20]. For each samples of different texture image size, above features are computed and stored in the data base feature vector as Wavelet Statistical Features (WSF). This feature is used at the time of classification stage.
2.2 Wavelet Co-occurrence features (WCF) The Co-occurrence matrix features are obtained from whole sample image and one level DWT decomposed sub-bands coefficients of sample image. Co-occurrence matrix is derived for distance vector d (i, j) i.e. offset is taken as d (1, 1). From the co-occurrence matrix the co-occurrence parameters namely contrast, inverse difference moment, energy, norm entropy, local homogeneity, cluster shade, cluster prominence, & maximum probability are obtained[16, 21] by the equations (3) – (10) respectively. , i j (3)
11
International Journal of Computer Applications (0975 – 8887) Volume 18– No.3, March 2011 where m is the mean of the fuzzy set and is the standard deviation from the mean. The mean value will change as per the texture image. (4) ( 5) (6)
(7)
Rules for the fuzzy system are obtained by fuzzification of the numerical values from wavelet and co-occurrence matrix methods, as given below: 1. The fuzzy sets corresponding to each texture feature are generated and maximum degree of membership will be =1 for each fuzzy set. The standard deviation of feature values from the mean is calculated. 2. Each texture feature is assigned to the fuzzy set with the maximum degree of membership. Suppose for rule i we are giving d inputs then fuzzy system will generate d no. of membership function A by taking mean as m. rule i will be generalized as IF e1 is Ai1 AND e2 is Ai2 AND . . . ed is Aid AND
(8)
THEN
(9) (10)
Output is Di texture image. These rules can be symbolically tabulated in Table 1
where,
Table 1. Rules for fuzzy systems Rule No.
and Co (i, j) is the (i, j) th element of the co-occurrence matrix. These parameters are also stored in database feature vector as Wavelet Co-occurrence Features (WCF).
3. FUZZY LOGIC CLASSIFIER A Fuzzy system is a fuzzy logic based system. In this system fuzzy logic can be a basis for the representation of the various kinds of knowledge or it can model the interactions and relationships among the system variables. Fuzzy logic provides innovative tools to handle the complex and illdefined systems where classical tools become unsuccessful. Fuzzy systems are universal approximators of non linear functions. Two aspects are important in fuzzy system one generating the best rule set and second tuning the membership functions. These should relate properly the independent and dependent variable. Inputs to the fuzzy system are WSF and WCF features that are covered in this research. The outputs of the system are specific texture image. The no. of features is represented by f and output images are represented by D. Fuzzy system will find mapping between f and D. f = {e1, e2, ---- ed}T where d is a user defined no. of texture features. D = {25 Texture images} In this system, features represent crisp numbers. Fuzzy sets with Gaussian membership functions are used to define these input variables. These fuzzy sets can be defined using the following equation [22]. (11)
Rule
e1
1. 2. 3. 4. 5. 6. 7. .
Image D1 Image D4 Image D5 Image D6 Image D9 Image D11 .. ..
A11 A21 A31 A41 A51 A61 .. ..
25.
..
A251
e2
...
A12 ... A22 ... A32 ... A42 ... A52 ... A62 ... .. ... .. ... A252
...
ed A1d A2d A3d A4d A5d A6d .. .. A25d
Success rate is calculated using the results obtained after defuzzification.
4.
EXPERIMENTAL RESULTS AND DISCUSSIONS
In this experiment twenty five texture images from the Brodatz texture [23] are used for classification [16]. The texture images are D1, D4, D5, D6, D9, D11, D16, D17, D18, D20, D21, D26, D29, D32, D34, D47, D57, D64, D65, D77, D82, D83, D84, D101, and D102 each of different scales i.e. 512x512, 256x256, and 128x128 sizes. 1000 samples each of 64x64, 128x128, and 256x256 size of 25 512x512 texture images, 1000 samples each of 64x64 and 128x128 size of 25 256x256 texture images while 1000 samples each of 64x64 size of 25 128x128 texture images are randomly generated and used for the study. In this experiment pyramid structured type of DWT is used with dB4 as a wavelet filter. One feature database is created using wavelet decomposed sub-bands up to fifth level of decomposition. Total number of sub-bands up to fifth level will be 20. Energy (1) and standard deviations (2) of each sub-band coefficients are calculated for
12
International Journal of Computer Applications (0975 – 8887) Volume 18– No.3, March 2011 each level and each of the 1000 samples. These features are stored as WSF.
WSF1- using Energy only of 1st level, 2nd level, 3rd level, 4th level, and 5th level DWT decomposition using dB4. WSF2- using Standard Deviation only of 1st level, 2nd level, 3rd level, 4th level, and 5th level DWT decomposition using dB4. WSF3- using Energy and Standard Deviation both of 1st level, 2nd level, 3rd level, 4th level, and 5th level DWT decomposition using dB4. WCF1- using five co-occurrence features viz. contrast, energy, local homogeneity, cluster shade, and cluster prominence of whole image and four sub-bands of 1st level DWT decomposition using dB4. WCF2- using eight co-occurrence features viz. contrast, inverse difference moment, energy, norm entropy, local homogeneity, cluster shade, cluster prominence, & maximum probability of whole image and four sub-bands of 1st level DWT decomposition using dB4. Performance of the above feature sets is tested with the help of a fuzzy classifier in terms of Success rate. Let NT be the no. of samples to be tested and out of that if the system correctly classifies NC times then success rate of the system for rule i as a percentage is given as (12)
90
%Average Success Rate
The mean and standard deviation of WSF and WCF for 1000 samples each derived from 512x512, 256x256, and 128x128 texture image are obtained. These are required for the fuzzy classification. Classification is carried out for following feature categories.
95
85
80
75
70
65
128x128 texture image 256x256 texture image 512x512 texture image
60
55
4
6
8
10
12 No. of features
14
16
18
20
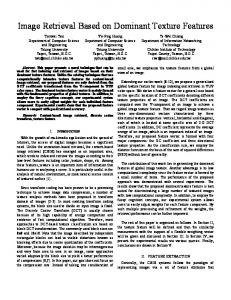
Figure 2: Average Success Rate of Energy only (WSF1) for sample size 64x64 100 90 80 % Minimum Success Rate
Another feature database is obtained using eight cooccurrence features (3)-(10) by finding the co-occurrence matrix of original sample image and 4- sub-bands of the 1level DWT coefficients co-occurrence matrix. These are stored as WCF. This way, maximum WSF will be 20x2=40 for five level decomposition and maximum WCF will be 5x8=40 for a sample.
100
70 60 50 40 30 20 128x128 texture image 256x256 texture image 512x512 texture image
10 0
4
6
8
10 12 14 Texture Image Size
16
18
20
Figure 3: Minimum Success rate of Energy only (WSF1) for sample size 64x64 100
98
96
%Average Success Rate
The best case as well as worst case analysis of each of the feature set is carried out for different scale texture images to decide features performing well and giving excellent success rate. Average and minimum success rate for each category of feature set and number features required for a particular sample size but for different scale texture images are studied and presented in graphs.
94
92
90
88
Figure 2 shows that average success rate for the sample size of 64x64 is almost constant close to 100% irrespective of number of energy (WSF1) features for 256x256 texture size. For 128x128 texture size minimum required energy features are 8 to have 100% success rate. Average success rate for 512x512 texture size touches 100% only when number of energy features are 16. Minimum success rate for sample size of 64x64 of WSF1 is 94% for 4 number of features and 100% for other higher number of features for 256x256 texture size while for 4 numbers of features it is 0% and others it is also 100% for 128x128 texture size and for 512x512 texture size, it is 0% up to 12 number of features as shown in figure 3.
86
84 256x256 texture image 512x512 texture image 82
4
6
8
10
12 No. of features
14
16
18
20
Figure 4: Average Success Rate of Energy only (WSF1) for sample size 128x128 If the sample size is increased to 128x128 then average success rate becomes 100% for 8 and more number of features, for both 256x256 and 512x512 texture images, as shown in figure 4. Minimum success rate is almost 0% for 4 number of features as shown in figure 5.
13
International Journal of Computer Applications (0975 – 8887) Volume 18– No.3, March 2011
90
80
80 % Minimum Success Rate
100
90
%Minimum Success Rate
100
70 60 50 40 30
70 60 50 40 30
20
20
10 0
256x256 texture image 512x512 texture image 4
6
8
10
12 14 No. of features
16
18
128x128 texture image 256x256 texture image 512x512 texture image
10 0
20
Figure 5: Minimum Success rate of Energy only (WSF1) for sample size 128x128
4
6
8
10 12 14 Texture Image Size
16
18
20
Figure 7: Minimum Success rate of Standard Deviation only (WSF2) for sample size 64x64
In case of standard deviation (WSF2) features, average success rate becomes 100% from 8 features for 256x256 texture image whereas for 128x128 texture image it reaches to 100% at 4th level of DWT decomposition and in case of 512x512 texture image it maximally reaches up to 91% at 4th level as shown in figure 6 for sample size 64x64.
100
95
%Average Success Rate
90
As shown in figure 7 for sample size 64x64, minimum success rate of WSF2 category is 0% only at 4 for 256x256 texture image where as it is 0% for any number of features in case of 512x512 texture image while it is 0% up to 3 rd level of DWT decomposition.
85
80
75
70 100
65
%Average Success Rate
90
60
128x128 texture image 256x256 texture image 512x512 texture image 5
10
15
20 25 No. of features
30
35
40
80
Figure 8: Average Success Rate of Energy + Standard Deviation (WSF3) for sample size 64x64 70
100 60
90 80 128x128 texture image 256x256 texture image 512x512 texture image 40
4
6
8
10
12 No. of features
14
16
18
20
Figure 6: Average Success Rate of Standard Deviation only (WSF2) for sample size 64x64 When energy and standard deviation features are taken together (WSF3) then average success rate is constant at 96% for 256x256 texture image at 1st level while it becomes 100% for higher level of DWT decomposition. For 128x128 texture image average success rate becomes 100% from 2 nd level while 512x512 texture image it hardly reaches to 96% at 4th level as shown in figure 8 for sample size 64x64. In case of WSF3, the minimum success rate is 0% at 1st level only, for 128x128 and 256x256 texture images while it is 0% for any level, for 512x512 texture images as shown in figure 9 for sample size 64x64.
% Minimum Success Rate
50
70 60 50 40 30 20 128x128 texture image 256x256 texture image 512x512 texture image
10 0
5
10
15
20 25 Texture Image Size
30
35
40
Figure 9: Minimum Success rate of Energy + Standard Deviation only (WSF3) for sample size 64x64 Figure 10 shows for sample size 64x64 average success rate of the category of 5 co-occurrence features (WCF1) changes from 100% at 5 number of features to 96% constant from 10 features for 128x128 texture images and vice versa for
14
International Journal of Computer Applications (0975 – 8887) Volume 18– No.3, March 2011 256x256 texture images while it is maximum up to 77.5% at 5 features for 512x512 texture images.
features. 100
100
95
%Average Success Rate
%Average Success Rate
90
80
70
90
85
60
80
50
256x256 texture image 512x512 texture image
128x128 texture image 256x256 texture image 512x512 texture image 40
5
10
15 No. of features
20
75
10
15 No. of features
The minimum success rate of WCF1 is 0% for any number of features for 512x512 texture images while it becomes zero from 10 numbers of features for 128x128 texture images. For 256x256 texture images around 7-8% up to 10 numbers of features as shown in figure 11 for sample size 64x64.
90 80 70
90 80 70 60 50 40 30
60
20
50
10
40
0
256x256 texture image 512x512 texture image 5
10
15 Texture Image Size
30 20
0
25
100
% Minimum Success Rate
100
20
25
Figure 13: Minimum Success rate of 5 Co-occurrence Features (WCF1) for sample size 128x128
128x128 texture image 256x256 texture image 512x512 texture image
10
20
Figure 12: Average Success Rate of 5 Co-occurrence Features (WCF1) for sample size 128x128
Figure 10: Average Success Rate of 5 Co-occurrence Features (WCF1) for sample size 64x64
% Minimum Success Rate
5
25
100
5
10
15 Texture Image Size
20
25
90
If sample size is taken 128x128 for 512x512 and 256x256 texture images then average success rate is 100% constant for 256x256 texture images while it hardly reaches to 92% in case of 512x512 texture images as shown in figure 12. Whereas minimum success rate is 100% constant for 256x256 texture images while it is 0% constant for 512x512 texture images as shown in figure 13.
80
%Average Success Rate
Figure 11: Minimum Success rate of 5 Co-occurrence Features (WCF1) for sample size 64x64
70
60
50
When whole set of co-occurrence features (WCF2) is taken then average success rate is 100% constant for 256x256 texture images. Whereas changes from100% at 8 numbers of features to 96% constant from 16 numbers of features for 128x128 texture images and hardly it becomes 68% maximum for 512x512 texture images as depicted in figure 14 for sample size 64x64.
Figure 14: Average Success Rate of 8 Co-occurrence Features (WCF2) for sample size 64x64
Figure 15 shows for sample size 64x64 that minimum success rate of WCF2 is almost 100% constant for 256x256 texture images and 0% constant for 512x512 texture images. In case of 128x128 texture images, it is 0% from 16 numbers of
Interpretation of misclassification shows that for a case study of 128x128 texture images of 64x64 sample sizes, samples of D64 texture the feature set WSF1, WSF2, and WSF3 recognize it as D47 texture and 512x512 texture images of
128x128 texture image 256x256 texture image 512x512 texture image 40
5
10
15
20 25 No. of features
30
35
40
15
International Journal of Computer Applications (0975 – 8887) Volume 18– No.3, March 2011 128x128 samples of D65 texture the feature set WCF1 and WCF2 recognize it as D26 texture.
[3] J. R. Smith and S. F. Chang 1996 Automated binary texture feature sets for image retrieval, Proc. ICASSP, Atlanta, GA.
100
[4] P. Gomez-Gil, M. Ramirez-Cortes, J. Gonzalez-Bernal, A. G. Pedrero, C. I. Prieto-Castro, D. Valencia, R. Lobato, J. E. Alonso, 2008, A Feature Extraction Method Based on Morphological Operators for Automatic Classification of Leukocytes, Proceedings of the 2008 Seventh Mexican International Conference on Artificial Intelligence (MICAI). IEEE Computer Society, pp. 227232.
90
% Minimum Success Rate
80 70 60 50 40
[5] S. Yokoi and J. Toriwaki, 1986, Adjacency Relations among Figures on a Digitized Image Plane with Applications to Texture Analysis, Proceedings of the First International Symposium for Science on Form, KTK Scientific Publishers, Tokyo, pp.431-439.
30 20 128x128 texture image 256x256 texture image 512x512 texture image
10 0
5
10
15
20 25 Texture Image Size
30
35
40
Figure 15: Minimum Success rate of 8 Co-occurrence Features (WCF2) for sample size 64x64
5. CONCLUSION In this study, Wavelet Statistical Features and Wavelet Cooccurrence Features are tested using fuzzy logic classifier for classification and retrieval of texture images under different scales of texture images. The performance is measured in terms of Success Rate. Best case and worst case analysis is carried out for the data. The best average as well as minimum success rate for minimum number of features is given by energy feature WSF1 for 256x256 texture images for 64x64 as well as 128x128 sample sizes. As texture scale reduced or increased from 256x256 texture image, the number of features required increases in case of WSF. WCF features have not performed consistently in case of 128x128 and 64x64 sample size of 512x512 texture images. WCF features are also gives excellent performance for 256x256 texture images with 64x64 as well as 128x128 sample size. Worst case analysis showed that WSF features give excellent performance for 256x256 followed by 128x128 texture images while performs poorly for 512x512 texture images. It also shows that if sample size is increased from 64x64 to 128x128 for 256x256 texture images then performance of WCF1 improves whereas performance does not change for 512x512 texture images. The Best case as well as worst case analysis shows that the WCF2 offers excellent performance, for 256x256 texture images. Study reveals that 256x256 image sizes represent the texture properties very effectively for WSF as well as WCF.
[6]
R. Haralick, 1979, Statistical and structural approaches to texture, Proceedings of IEEE, Vol. 67, no. (5), pp. 786-804.
[7] Y. Wan, J. Du, D. Huang, Z. Chi, Y. Cheung, X. Wang, G. Zhang, 2004, Bark Texture Feature Extraction Based on Statistical Texture Analysis, Proceedings of 2004 Int. Sympo. On Intelligent multimedia, Video & Speech processing, Hong Kong. [8]
J. Weszka, C. Dyer, and A. Rosenfeld, A comparative study of texture measures for terrain classification, IEEE Trans. on Sys., Man. and Cyb. 1976, SMC-6(4).
[9] H. Tamura, S. Mori, and T. Yamawaki, Texture features corresponding to visual perception”, IEEE Trans. on Systems, Man, and Cybernetics, 1978, vol. 8, No. 6. [10] Liu F., Picard R.W., Periodicity, directionality, and randomness: Wold features for image modelling and retrieval, IEEE Trans. on PAMI, 1996, vol.18, pp.722733. [11] B. S. Manjunath, and W. Y. Ma, Texture features for browsing and retrieval of image data, IEEE Trans. on PAMI,1996, Vol. 18, No. 8, pp.837-842. [12] I. Daubechies, The wavelet transform, time-frequency localization and signal analysis, IEEE Trans. on Information Theory, 1990, Vol. 36, pp. 961-1005. [13] S. G. Mallat, A theory for multi-resolution signal decomposition: the wavelet representation, IEEE Trans. on PAMI, 1989, Vol. 11, pp.674-693.
In the current study, features tested for only twenty five textures for scale invariance which give excellent results with 256x256 texture images. As the number of different textures will be included in the classifier rule base, classification will become complicated and more number of features will be required for the classification.
[14] J. R. Smith and S. F. Chang, 1994, Transform features for texture classification and discrimination in large image databases, Proc. IEEE Int. Conf. on Image Processing.
6. REFERENCES
[16] E.Avci, An expert system based on Wavelet Neural Network-Adaptive Norm Entropy for scale invariant texture classification, Experts Systems with Applications, 2007, vol.32, pp.919-926, Elsevier.
[1] A. W. M. Smeulders, M. Worring, S. Santini, A. Gupta, and R. Jain, Content-based image retrieval at the end of the early years IEEE Trans. Pattern Anal. Mach. Intell., 2000, vol. 22, no. 12, pp. 1349–1380. [2] R. M. Haralick, K. Shanmugam, and I. Dinstein, Textural features for image classification, IEEE Trans. on Systems, Man, and Cybernetics, 1973, SMC-3, pp. 610621.
[15] R.O. Duda, P.E. Hart, D.G. Stork, 2006, Pattern Classification, John Wiley and Sons, Second Edition.
[17] I. Turkoglu and E.Avci, Comparison of wavelet-SVM and Wavelet-adaptive network based fuzzy inference system for texture classification, Digital Signal Processing, 2008, Vol.18, pp.15-24, Elsevier.
16
International Journal of Computer Applications (0975 – 8887) Volume 18– No.3, March 2011 [18] L. Dettori and L. Semler, A comparison of wavelet, ridge let, and curve let-based texture classification algorithms in computed tomography, Computers in Biology and Medicine, 2007, vol.37, pp.486-498, Elsevier.
[21] S. Arivazhagan, L. Ganesan, T. Subash Kumar, Texture classification using ridge let transform, Pattern Recognition Letters, 2006, vol.27, pp.1875-1883, Elsevier.
[19] G. Schaefer, M. Zavisek, T.Nakashima, Thermography based breast cancer analysis using statistical features and fuzzy classification, Journal of Pattern Recognition,2009, Vol. 47. PP. 1133-1137, Elsevier.
[22] P.M. Pawar and R. Ganguli, Genetic fuzzy system for damage detection in beams and helicopter rotor blades, Computer methods in applied mechanics and engineering, 2003, vol.192, pp.2031-2057, Elsevier.
[20] M. Kokare, P. K. Biswas, and B. N. Chatterji, Rotationinvariant texture image retrieval using rotated complex wavelet filters, IEEE Trans. on Systems, Man, and Cybernetics-Part B: Cybernetics, 2006, vol.36, no.6, pp.1273-1282.
[23] P. Brodatz, 1996, Textures: A Photographic Album for Artists and Designers, New York: Dover.
17