Oct 24, 2011 - such as web analytics, business intelligence and social net- working over tera- (or even peta-) byte datasets have pushed sql-like centralized ...
On the Elasticity of NoSQL Databases over Cloud Management Platforms (extended version) Ioannis Konstantinou, Evangelos Angelou, Christina Boumpouka, Dimitrios Tsoumakos, Nectarios Koziris Computing Systems Laboratory, School of Electrical and Computer Engineering National Technical University of Athens
{ikons, eangelou, christina, dtsouma, nkoziris}@cslab.ece.ntua.gr ABSTRACT NoSQL databases focus on analytical processing of large scale datasets, offering increased scalability over commodity hardware. One of their strongest features is elasticity, which allows for fairly portioned premiums and high-quality performance and directly applies to the philosophy of a cloudbased platform. Yet, the process of adaptive expansion and contraction of resources usually involves a lot of manual effort during cluster configuration. To date, there exists no comparative study to quantify this cost and measure the efficacy of NoSQL engines that offer this feature over a cloud provider. In this work, we present a cloud-enabled framework for adaptive monitoring of NoSQL systems. We perform a thorough study of the elasticity feature on some of the most popular NoSQL databases over an open-source cloud computing platform. Based on these measurements, we finally present a prototype implementation of a decision making system that enables automatic elastic operations of any NoSQL engine based on administrator or applicationspecified constraints.
1.
INTRODUCTION
Computational and storage requirements of applications such as web analytics, business intelligence and social networking over tera- (or even peta-) byte datasets have pushed sql-like centralized databases to their limits [12]. This led to the development of horizontally scalable, distributed nonrelational data stores, called NoSQL databases. Google’s Bigtable [13] and its open-source implementation HBase [6], Amazon’s Dynamo [15], Facebook’s Cassandra [20], and LinkedIn’s Voldemort [8] are a representative set of such systems. NoSQL systems exhibit the ability to store and index arbitrarily big data sets while enabling a large amount of concurrent user requests. They are perfect candidates for cloud platforms that provide infrastructure as a service (IaaS) such as Amazon’s EC2 [2] or its open-source alternatives such as Eucalyptus [24] and OpenStack [7]: NoSQL administrators can utilize the cloud API to throttle the number of acquired resources (i.e., number of virtual machines
Permission to make digital or hard copies of all or part of this work for personal or classroom use is granted without fee provided that copies are not made or distributed for profit or commercial advantage and that copies bear this notice and the full citation on the first page. To copy otherwise, to republish, to post on servers or to redistribute to lists, requires prior specific permission and/or a fee. CIKM ’11, October 24-28, 2011 Glasgow, UK Copyright 2011 ACM X-XXXXX-XX-X/XX/XX ...$10.00.
– VMs and storage space) according to application needs. This is highly-compatible with NoSQL stores: Scalability in processing big data is possible through elasticity and sharding. The former refers to the ability to expand or contract dedicated resources in order to meet the exact demand. The latter refers to the horizontal partitioning over a sharednothing architecture that enables scalable load processing. It is obvious that these two properties (henceforth referred to as elasticity) are intertwined: as computing resources grow and shrink, data partitioning must be done in such a way that no loss occurs and the right amount of replication is conserved. Many NoSQL systems (e.g., [6, 15, 20, 8, 9]) claim to offer adaptive elasticity according to the number of participant commodity nodes. Nevertheless, the “throttling” is usually performed manually, making availability problems due to unanticipated high loads not infrequent (e.g., the recent Foursquare outage [17]). Adaptive frameworks are offered by major cloud vendors as a service through their infrastructure: Amazon’s SimpleDB [3], Google’s AppEngine [5] and Microsoft’s SQL Azure [11] are proprietary systems provided through a simple REST interface offering (virtually) unlimited processing power and storage. However, these services run on dedicated servers (i.e., no elasticity from the vendor’s point of view), their internal design and architecture is not publicly documented, their cost is sometimes prohibitive and their performance is questionable [19]. A number of recent works has provided interesting insights over the performance and processing characteristics of various analytics platforms (e.g., [19, 25, 14]), without dealing with elasticity in virtualized resources, which is the typical case in cloud environments. The studies presented in [16, 22, 29] deal with this feature but do not address NoSQL databases, while [21] is file-system specific. Finally, proprietary frameworks such as Amazon’s CloudWatch [1] or AzureWatch [4] do not provide a rich set of metrics and require a lot of manual labor to be applicable for NoSQL systems. Thus, although both NoSQL and cloud infrastructures are inherently elastic, there exists no actual study to report how effective this is in practice, at least over architecturally different engines. To the best of our knowledge, there also exists no actual system that combines these two technologies to offer automated NoSQL cluster resize according to dynamic workload changes. Our work aims to bridge this gap between individual implementations and practice. Having reviewed the majority of open-source NoSQL solutions (including considerable hands-on experience with many of them) and the Eucalyp-
Rebalancing Get fresh metrics
Command Issuing
Balance data
Monitoring Collect Performance Metrics
Hardware NoSQL Cluster resize resize
Cluster Coordinator Manage NoSQL nodes
Cloud Management Adjust resources Add/delete VMs
Cloud Provider
Virtual NoSQL Cluster
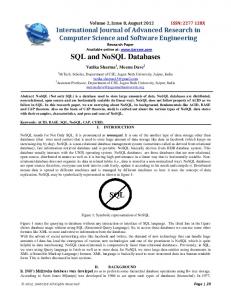
Figure 1: Architecture of our Cloud-based NoSQL elasticity-testing framework. tus IaaS [24], our task is to design and deploy a distributed framework that allows (in a customizable and automated manner) any NoSQL engine to expand or contract its resources by using a cloud management platform. Specifically, in this work we perform a thorough study that presents the following tangible contributions: • Utilizing a VM-based measurement framework, we are able to provide a generic control module that monitors NoSQL clusters. We then identify how each metric of interest (CPU, Memory usage, Network, etc) varies under workloads of various types (reads, writes, updates) and rates. • We document the costs and gains after a cluster resize. Specifically, using both client and cluster-based metrics, we register the performance gains when increasing the size of the cluster in varying workloads. We also measure the cost in terms of time delay and describe the performance degradation at all stages of adding or deleting a new VM. • Based on our findings, we demonstrate the applicability of our framework by presenting a prototype implementation of our system that allows for adaptive cluster resize without any human involvement. Taking advantage of our experience in building and operating this platform, this work may also be used as an invaluable guide to technical issues such as: Automatic VM setup and configuration, NoSQL tuneup and glitches, implementation shortcomings and best workload practices. To achieve maximum result generalization and show our framework’s modularity, we incorporate three popular NoSQL implementations, HBase [6], Cassandra [20] and Riak [9] that support elasticity and also offer an acceptable level of development support required. The same hold for the choice of the open-source client [14] our system incorporates. The remainder of this paper is organized as follows: the basic system architecture is presented in Section 2. Section 3 presents a brief description of the supported NoSQL systems and their elasticity features. Our experimental results are detailed in Section 4, related work is presented in Section 5 and Section 6 contains a thorough analysis of our findings, design decisions and recommendations, while Section 7 concludes our work.
2.
ARCHITECTURE Our elasticity-testing framework, an open-source project1
1
download address omitted for double-blind reviewing
with over 2K lines of Python code, features an architecture that is illustrated in Figure 1. The Command Issuing module is used to initiate a cluster resize operation. It interacts with the Cloud Management module that contacts the cloud vendor to adjust the cluster’s physical resources by releasing or acquiring more virtual machines. The Rebalancing module makes sure that newly arrived nodes join the cluster contributing an equal share of the work. The Cluster Coordinator module executes higher level add, remove and rebalance commands according to the particular NoSQL system used. Finally, the Monitoring module maintains up-to-date performance metrics that collects from the cluster nodes. Below we describe each module in more detail: Command Issuing Module: This is the ‘coordinator’ module. In the current implementation phase, this module requests addition or removal of a number of VMs using the Cloud Management and Cluster Coordinator modules. Monitoring Module: Our system takes a passive monitoring approach. Currently, it receives data from Ganglia [23], a scalable distributed system monitoring tool that allows the user to remotely collect live or historical statistics (such as CPU load averages, network, memory or disk space utilization) through its XML API and present them through its web front-end via real-time dynamic web pages. Apart from general operating-system statistics, Ganglia may also gather NoSQL performance metrics such as the current number of open client threads, number of served operations per second, etc. Rebalancing Module: The rebalancing module is activated after a newly arrived virtual machine from the cloud vendor has successfully started (i.e., has booted and received a valid IP). When this happens, the module executes a “global rebalance” operation, in which client requests are spread equally among the cluster nodes according to the specific NoSQL implementation and semantics. Cloud management: Our system interacts with the cloud vendor using the well known euca-tools, an Amazon EC2 compliant REST-based client library. The command issuing module interacts with this module when it commands for a resize in the physical cluster resources, i.e., the number of running VMs. Our cloud management platform is a private Eucalyptus [24] installation. The use of euca-tools guarantees that our system can be deployed in Amazon’s EC2 or in any EC2-compliant IaaS cloud. We have created an Amazon Machine Image (AMI) that contains pre-installed versions of the supported NoSQL systems along with the Ganglia monitoring tool. Cluster coordinator: The coordination of the remote VMs is done with the remote execution of shell scripts and the injection of on-the-fly created NoSQL specific configuration files to each VM. A higher level “start cluster”, “add NoSQL node” and “remove NoSQL node” command is translated in a workflow of the aforementioned primitives. Our framework implementation makes sure that each step has succeeded before moving to the next one. For instance, the Command Issuing module requests an “add virtual machine” command using the euca-tools API and waits until it is started and has been assigned with an IP. After this, the Cluster Coordinator creates the appropriate configuration scripts on-the-fly, transfers them to the new VM, and remotely starts the NoSQL service along with the Ganglia tool. The Rebalancer module inserts the node to
the cluster and rebalances client requests among the server nodes. On a another instance, when the decision dictates for node deletion, the Cluster Coordinator is instructed to remove it from the cluster calling the “terminate instance” command of the Cloud Management. Data loss during node removal is avoided with the use of NoSQL data replication. In this case, NoSQL systems transparently replicate the removed data in order to maintain the replication factor. Our framework currently incorporates three popular NoSQL systems that implement rebalancing operations: HBase, Cassandra and Riak (for an overview of these systems, refer to Section 3). Yet, the system is extensible enough to include more engines that support elastic operations by implementing the system’s abstract primitives in the Cluster Coordinator module and by including the system’s binaries to the existing AMI virtual machine image. The precooked virtual machine image is available for download from the project’s web site.
3.
NOSQL OVERVIEW
This section provides a short overview of the three NoSQL engines incorporated so far in our framework. In particular, we focus on key architectural characteristics, behaviour and advantages, as these features shed light into many of the results that follow.
3.1
HBase
HBase is a Bigtable-like structured store that runs on top of the Hadoop Distributed File System (HDFS). Both HBase and Hadoop implement a centralized master-slave architecture. HBase has an HMaster node that keeps track of the various cluster nodes (RegionServers) that serve client requests. Data is divided into regions allocated to the RegionServers by HMaster and reside, normally, on the local HDFS DataNode. When regions grow above a user-defined limit, they are split in half. Incoming data is cached until a pre-configured size is reached at which point a flush to disk creates a new file. Once the number of newly written files exceeds a configurable threshold a minor compaction is performed. In contrast, a major compaction is scheduled at regular intervals that consolidates all files. A load balancer is triggered periodically aiming to balance the cluster load by migrating regions as required. Cluster synchronization is accomplished thanks to Zookeeper, a distributed coordination service. Clients contact the Zookeeper to retrieve the node hosting the necessary metadata for locating the RegionServer that owns the corresponding region. Data replication is supported, with the default factor set to 3. HBase inherits a strong level of consistency from HDFS. In the event of new nodes joining the cluster, they are used for storing any new data in the system. Data are not redistributed by default but a load rebalancing can be forced.
3.2
Cassandra
Cassandra is a Dynamo-inspired system that follows Bigtable’s data model [10]. Nodes form a DHT ring with each node holding a specific partition of the key-space and serving as a contact point. New nodes entering the ring are assigned a partition of the data stored in the cluster, namely, half the key-space of the node with the largest partition is transferred to it. Therefore, no more than the number of nodes present in the ring can be inserted at the same time. Data is replicated for fault-tolerance, with the default replication factor
being equal to 3. Cassandra is optimized for fast write operations. There exist five levels of consistency available for every operation executed. Eventual consistency can favour fast writes whereas strong consistency can be achieved if needed.
3.3
Riak
Similarly to Cassandra, Riak is strongly influenced by the Dynamo paper [9]. Featuring a DHT architecture, Riak focuses on scalability and high availability supporting adjustable data replication for durability (the default replication factor is 3) and tunable levels of consistence. Data rebalancing is handled automatically as soon as new nodes enter the ring, aiming in dividing data partitions into equal shares and distributing them amongst nodes.
4.
EXPERIMENTAL RESULTS
Our experimental setup consists of a Eucalyptus 2.0.0 private cluster of 16 Node controllers and a single machine in the role of Cloud and cluster controller. We were allocated enough resources for a cluster of 20 client VMs (load generators) and 28 server VMs. Each server VM has a 4 virtual core processor with 8GB of RAM and 50GB of storage space, while client VMs have 2 virtual CPUs and 4GB of RAM. Cluster peers store their data into their root file system, i.e., no external Elastic Block Storage (EBS) is used. The versions of Hadoop and Ganglia used are 0.20.2 and 3.1.2 respectively, both in their default configuration. Clients and workloads used: We utilize fixed HBase (v. 0.20.6) Cassandra (v. 0.7.0 beta) and Riak (v. 0.14.0) initial cluster sizes of 8 nodes which are loaded with 20 million objects (i.e., 20GB of plain raw data, since each item takes up 1KB) by utilizing the YCSB [14] load function. Every database is configured with a replication factor of 3, which in the case of Cassandra, HBase and Riak results in a total database size of about 60GB, 90GB and 105GB respectively (HBase and Riak use more metadata per record). Since HBase and Cassandra are written in java and they were setup for production mode, a generous heap space of 6GB was supplied. For the most part, all database systems were setup using their default settings, as presented in their online manual pages. The only deviation from this rule is Cassandra’s auto_bootstrap parameter, which was set to false, as it effectively prevents adding more nodes to the cluster ring than the number of already participating nodes. Our default workload for use through the YCSB tool is a straightforward random uniform read, varying λ appropriately, where λ is the number of active threads of the YCSB tool. YCSB uses two parameters, the number of threads per client and the target number of operations per second they will try to achieve. Consequently, λ defines the number of concurrent pending operations at every time point. In our experiments, we pose a sufficient number (2M to 10M) of simple get queries that collectively cover a significant part of the dataset (10% to 50%). Although YCSB comes with a set of workloads that simulate real-world conditions, we use 4 consistent workloads (namely UNIFORM READ, ZIPFIAN READ, UNIFORMUPDATE and UNIFORM RMW) in order to better understand the behaviour of the databases for different types of load. These correspond to simple (i.e., not composite) workloads, where all operations are of the defined type, that is uniform random reads, zipfian random reads, uniform ran-
70K 140K 210K 280K Query arrival rate λ (reqs/sec)
50 25 0
70K 140K 210K 280K Query arrival rate λ (reqs/sec)
30
50 RAM Usage (GB)
Hbase Cassandra
75
Cassandra Hbase
Cassandra Hbase
40 30 20 10 0
70K 140K 210K 280K Query arrival rate λ (reqs/sec)
Query Latency (sec)
100 % of CPU usage
Throughput µ (reqs/sec)
90K 80K 70K 60K 50K 40K 30K 20K 10K 0
25
Cassandra Hbase
20 15 10 5 0
70K 140K 210K 280K Query arrival rate λ (reqs/sec)
Figure 2: CPU-RAM usage and mean query throughput-latency for various λ query rates of the UNIFORM READ workload for an HBase-Cassandra Cluster of 8 nodes. dom updates and uniform random read-modify-writes respectively. Our evaluation conforms to the following methodology: First, we plan to identify the performance metrics that are affected under heavy load of concurrent requests and various workload types. In the second phase, we plan to identify the cost and performance gain/loss cost after cluster resize for various workloads and resize choices. Finally, taking advantage of our findings, we present a prototype, fully automated system setup where the command issuing module monitors the appropriate performance metrics and adaptively adds/removes the desired amount of resources in order to keep the cluster within some user-defined limits.
4.1
Metrics affected during stress-testing
In the first set of experiments, we measure how a number of metrics is affected under variable load. We are interested both in generic, server-side metrics (i.e., CPU load and memory usage) and application-specific, client-side ones (i.e., query throughput and mean query latency), varying the aggregate query rate as well as the workload type. Figure 2 presents the results for four metrics, two reported by YCSB (throughput and latency) and two by Ganglia (CPU and Memory usage) for values of aggregate λ up to 280 Kreqs/sec. Considering Riak, the 8-node cluster could not accommodate such big rates of λ. Riak was able to achieve an average throughput of 10 Kreqs/sec for an 8-node cluster, which fully complies with previously reported performance measurements2 . Yet, above this rate, extra requests are dropped and Riak servers become unresponsive. Thus, we were unable to directly compare Riak with HBase and Cassandra, limiting its participation to the data rebalancing experiment in Section 4.3. The maximum throughput for the other two databases can be derived from the first graph of Figure 2. We notice that HBase achieves a maximum aggregate throughput of about 80 Kreqs/sec at λ ' 80 Kreqs/sec, while Cassandra achieves its maximum throughput of 13K at λ ' 20 Kreqs/sec. The variation of the CPU load as perceived from the cluster seems in accordance with the client-perceived throughput. The maximum usage is a bit over 55% (aggregated over the whole server cluster) for HBase and ' 76% for Cassandra, with the load remaining constant henceforth. As seen in both experiments, increasing λ further has no effect, as both systems are fully utilized. Thus, further arriving requests are simply queued, to be answered later by the system, resulting in mostly flat CPU and throughput curves. In terms of memory usage, the HBase cluster uses a con2
http://bit.ly/lEpqWC
Table 1: CPU-RAM usage and mean query throughput-latency under different workload types with a fixed query rate of λ = 180 Kreqs/sec for an HBase-Cassandra Cluster of 8 nodes. h
hhhh h
Workload
Metric
CPU
MEM Thr/put Latency (GB) (Kreqs/sec) (sec) HbCassHbCass Hb Cass Hb Cass 55 73 17 48 75.5 9 3.9 18.7 55 68 17 28 77.4 8.6 1.4 18.4 45 74 24 36 30.4 12.2 4.1 10.8
hhhh h (%)
Uniform READ Zipfian READ UPDATE
stant 17 GB of memory while Cassandra seems to take up more memory as the load increases. This could be due to the fact that Cassandra, unlike HBase, has no central node that directs the clients to the appropriate server to get a particular tuple. The server responsible is reached after searching the ring and returns the tuple to the client. This process can create several cached results. To force a memory cleanup, a restart of the cluster is necessary, which results in an original memory usage of 5 GB. Finally, in terms of the average read latency per query, HBase predictably outperforms Cassandra. Both systems exhibit a linear increase in the client-side perceived latency with Cassandra’s rate being noticeably higher. The linearly increasing latency curves can be explained from pending server requests which have to wait more since λ increases but the throughput remains constant. Having determined the way the metrics were affected during the uniform reads for variable λ, we monitor the steady state values of these metrics for different types of workloads. In Table 1, we present the relevant results for a value λ = 180 Kreqs/sec. As shown, the average CPU and RAM usage is almost identical for HBase for uniform and zipfian read workloads, while average CPU usage slightly decreases in the case of updates. Cassandra on the other hand exhibits more variation between uniform and zipfian read, with zipfian read producing lower CPU load and memory usage. Update operations produce slightly more load but are less heavily dependent on memory. In all cases, Cassandra uses more memory and produces significantly more CPU load than HBase. In terms of average throughput and latency, HBase outperformed Cassandra for short term experiments, even in the case of updates.
4.2
Cost of adding and removing nodes
The cost of adding or removing nodes in a NoSQL cluster is mostly measured in time and can be divided in four parts: VM initialization: Launching new virtual machines takes a significant part of the addition phase. Even when the virtual machine image is cached on the VM container, the VM is available after about 3 minutes, allowing for OS boot
time and DHCP negotiation. However, multiple node addition can be done in parallel on multiple VM containers even when multiple VMs are launched on the same container. This means that the previously reported time remains constant. VM removal is done instantaneously (i.e., in less than 10 secs), since it is a much more straightforward operation for the cloud management system. Node reconfiguration: This phase involves the creation of various configuration files and their propagation to all nodes on the cluster. This is necessary because in both existing and new nodes the configuration files should match and because there are a number of settings that have to be available on both new and existing nodes (for example, hard coded domain name resolution effected by altering the /etc/hosts file of all nodes). Given the automatic nature of these changes and the fact that configuration files are usually small in size, completing this phase takes at most 30 seconds even for large cluster sizes. This phase is necessary during node addition as well as during node removal. Region rebalancing: This part of the addition/removal process involves the necessary time for the new nodes to become actual serving parts of the cluster. This consists of the time consumed by launching the services/daemons using the database’s default scripts, the time for the new node to become active during addition and the time for the data regions to be allocated to each new node during addition or to an old node during removal. The total time for HBase could vary depending on the number of new or removed nodes and the amount of regions, but in our experiment we have measured times of at most 2 minutes. Given the distributed nature of Cassandra and Riak, the time to add/remove new nodes to the ring is at most 30 seconds irrespective of database size. Data rebalancing: Data rebalancing is expensive in terms of extra load on the servers and the network infrastructure. It also invalidates data blocks while operations are performed on the cluster as we have witnessed in our tests. HBase and Cassandra can add nodes to the cluster without moving the relevant data. The operational correctness in this case is achieved through the distributed HDFS filesystem in HBase’s case and through extra hops in Cassandra’s case. In Riak, data rebalancing cannot be avoided when bringing new nodes online. This operation, in any case, depends heavily on the amount of data that have to be moved, the number of pre-existing nodes and the number of new nodes that have to fetch the existing data. This means that all cases would have to be treated individually. However, a relevant test outlining performance gains and time costs is presented in Section 4.3. In general, in the rebalancing tests we performed, we observed erratic cluster behaviour and large time costs.
4.3
Cluster resize performance measurements
Our first concern on the costs and gains of a resize operation relates to the rebalancing of the database data. Since data rebalancing is by itself a resource intensive procedure, we only perform node additions and data migration in an idle cluster for this case, i.e., without applying extra client workload. This scenario is valid, since data rebalancing is usually scheduled for off-peak time periods. Nevertheless, in our experiments conducted with extra client workload during data rebalance, all systems exhibited erratic behaviour, and never reached the performance in throughput or la-
Table 2: Completion time, total moved data, final average query throughput and latency for a 8+8 node cluster resize operation in HBase, Cassandra and Riak with and without data rebalancing
hhh hhhh Cluster hhhh Metric Completion time (min) Data moved (GB) Througput (Kreqs/s) Avg. Latency (s)
HBase
Cassandra
Riak
Reb No Reb No Reb 98 5 665 5 150 22.5 87.7 44.8 154.5 129.6 18.3 14.9 18 0.7 1.1 7.1 9.3 0.2
tency of the initial cluster before the resize operation. Even worse, disconnects and inconsistencies were propagated to the clients, resulting in a significant number of exceptions. In Table 2 we present our results for an original examination of the costs and gains of data rebalancing for HBase, Cassandra and Riak. We have started an 8-node cluster in each case and added 20M tuples. After the data insertion, we expand each cluster by adding 8 more nodes, let the systems stabilize without performing data rebalance and apply a UNIFORM READ workload with a λ = 180 Kreqs/sec. These results are depicted in the “No” column for every database (for Riak that rebalances data automatically as soon as a new node joins the ring, this is not applicable). After this, we perform a manual data rebalancing operation in HBase (through the HDFS balancer3 ) and Cassandra (through loadbalance commands4 ). When data rebalancing finishes, we apply a UNIFORM READ workload with a λ = 180 Kreqs/s for HBase, Cassandra and 18 Kreqs/s for Riak (Riak could not operate with a higher workload). The results for this setup are presented in the “Reb” column for every database. As can be deduced from Table 2, the data rebalancing costs far outweigh its benefits for the cases of HBase and Cassandra. For HBase, which also required a restart of the whole cluster that took about 4 minutes, a net gain of about 20% in throughput (154.5 Kreqs/sec balanced vs 129.6 Kreqs/sec not balanced) was achieved compared to a non-rebalanced 16 node cluster, which could be easily offset by adding two extra nodes without using data rebalancing. In Cassandra’s case, the results were better with a net gain of 22% for the average throughput (18.3 Kreqs/sec vs 14.9 Kreqs/sec for a non balanced 16 node cluster). In terms of latency, similar performance benefits were achieved (33% and 23% for HBase and Cassandra respectively). The data moved during data rebalancing for HBase are roughly 22 GB or 25% of the entire dataset. In Cassandra’s case, a much larger number of 87.7 GB of data are moved, which translates to the whole dataset. HDFS’s centralized balancer is more advanced than Cassandra’s when deciding how many data blocks to move to the new nodes since it tries to minimize the moved data by taking into account replica locations. Although this leaves the cluster unbalanced in terms of disk usage, it allows a rebalancing operation to complete in much less time than Cassandra. Cassandra, on the other hand, by halving the ID space of a pre-existing node and assigning it to the newly arrived one, uses a more naive but decentralized approach to balance the cluster, moving more data. As far as Riak is concerned, rebalancing is also a costly 3 4
http://bit.ly/iCNsbF http://bit.ly/kEZZFI
30 20 10 0
500
1000 1500 Time (sec)
2000
READ+8 READ+16 UPDATE+8 UPDATE+16
150K 100K 50K 0
500
1000 1500 Time(sec)
2000
% of CPU usage
READ+8 READ+16 UPDATE+8 UPDATE+16
Throughput µ (reqs/sec)
Latency (sec)
40
READ+8 READ+16 UPDATE+8 UPDATE+16
40
20
0
1000
2000 3000 Time(sec)
4000
Figure 3: Query latency, query throughput and CPU usage per time for an HBase cluster of 8 nodes after adding 8 and 16 more nodes for the UNIFORM READ and UNIFORM UPDATE workload with a query rate of λ = 180 Kreqs/sec operation both in time, taking 150 minutes to complete in our experiment, and in network bandwidth since 44.8 GB (or 43% of the entire dataset) were transferred to the newly added nodes. Given the large time costs for data rebalancing operations (93, 660 and 150 minutes in HBase, Cassandra and Riak respectively), and the fact that the benefits can be outweighed by adding more nodes without data migration with a fixed time cost of 5 minutes for each database (see the following results), we conclude that gains do not outweigh costs when aiming for the highest degree of elasticity. Therefore, subsequent tests were run without performing data rebalancing operations. We continue our evaluation of the gains in performance when adding nodes under varying workloads without data rebalancing for HBase and Cassandra. Our results describe the behaviour of an 8-node cluster under varying workloads after the addition of a variable number of nodes. We utilize a YCSB-generated load of λ = 180 Kreqs/sec, which, as previously shown, is well over the maximum load that both Cassandra and HBase can efficiently handle. Two types of workloads are used, UNIFORM READ and UNIFORM UPDATE (referred to as READ and UPDATE henceforth). For each combination of workload and database, we perform an addition of 8 (i.e., double the size) and 16 (i.e., triple the size) nodes. The cluster resize occurs at about t = 370 sec (shown in Figures 3 and 4 as a vertical line). The client-side query latency and throughput µ are measured as well as the total aggregate cluster CPU usage reported by the Ganglia tool. As we have shown, CPU usage is highly indicative of the cluster’s status. Figure 3 presents our results concerning the HBase cluster. Legends refer to the workload type along with the resizing action (e.g., READ+8 represents a read workload with an 8node resize). With read operations being faster than writes, we achieve comparable run times by adjusting the amount of objects requested in each workload, i.e., 10M in READ and 4M in UPDATE. The first graph plots present the mean query latency. Adding nodes during READ loads (READ+8 and READ+16) has a transient negative effect on the query latency, attributed to the fact that HMaster reassigns table regions to the new nodes as soon as the resize occurs. Although data is not actually moved (as explained in section 3.1), this reassignment poses an extra burden to the already overloaded cluster. Clients cache region locations which however change during cluster resizing. As a result, latency increases due to client cache misses. Nevertheless, this effect lasts for around 4-5 minutes when adding 8 nodes, while only a couple of minutes when adding 16 nodes (with
query latency less affected during this interval). This is because more servers quickly join the cluster and take a large portion of the applied load. The total 24 nodes are now adequate to handle the load. Therefore the transient period takes less time and affects the clients at a smaller degree. In the update workloads, we notice an oscillation in both cases: This happens because of the compaction and caching mechanisms of HBase (see Section 3.1). Incoming data is cached in memory (resulting in low update latencies) but when the memory is full and a I/O flush occurs with a compaction, the latency is increased until the new blocks are written to the file system. For the client-side throughput µ, depicted in the second graph, we notice a clear gain when adding nodes in read workloads: after the transient phase, adding 16 nodes results in about 170 Kreqs/sec in the steady state and 100 Kreqs/sec for the READ+8 case (compared to about 55K before additions). More servers are able to simultaneously handle more requests that results in a higher throughput (roughly doubling and tripling it respectively). Although items are not actually transferred, this speed is due to the caching effect of the RegionServers: New nodes eventually cache their assigned regions and do not need to contact the nodes that store them. For the update workloads, we notice small improvement in adding 16 compared to adding 8 nodes, but since the update is an I/O-bound operation, µ is not significantly altered. As initial data is not moved, a portion of incoming updates will be handled by the initial nodes. Only when new regions are created, due to a minor compaction for instance, I/O operations will be handled by the new nodes. The final graph reports the aggregate cluster CPU usage as registered by the Ganglia tool. In the read workloads we notice that the initial load of around 55% is reduced to around 42% in both cases. Evidently, the newly arrived nodes immediately start handling incoming queries and alleviate the initially overloaded cluster. The addition of 16 against 8 nodes does not result in a further decrease in the average CPU, as the load is still large enough for all servers to contribute. The extra 8 nodes make a difference in terms of throughput, as shown in the second graph. Contrarily, a drop in CPU usage is a good indication for adding servers against the maximum load. In the update workloads, we notice that in both experiments the initial CPU load continues to drop until run completion. This drop is due to the slow writes that occur during updates: The server freezes incoming requests until the updated regions are flushed to the file system. In Figure 4 we present the respective results for the Cas-
16
8
0
500
1000 1500 Time (sec)
2000
READ+8 READ+16 UPDATE+8 UPDATE+16
30K 20K 10K 0
500
1000 1500 2000 Time(sec)
% of CPU usage
READ+8 READ+16 UPDATE+8 UPDATE+16
Throughput µ (reqs/sec)
Latency (sec)
24
READ+8 READ+16 UPDATE+8 UPDATE+16
80 60 40 20 0
500
1000 1500 Time(sec)
2000
Figure 4: Query latency, query throughput and CPU usage per time for a Cassandra cluster of 8 nodes after adding 8 and 16 more nodes for the UNIFORM READ and UNIFORM UPDATE workload with a query rate of λ = 180 Kreqs/sec sandra cluster. In each test, clients request 2M each out of the total 20M objects stored in the database. During the experiment, clients are aware of the up-to-date list of server addresses and each request is directed to a random one. Since Cassandra does not have a mechanism to inform clients about new servers, a custom script was developed to propagate these changes back to the clients, whenever a cluster resize occurred. The first graph presents query latency: In both READ cases, we notice that the latency almost immediately drops from an initial value of around 22 secs to 10 secs and 8 secs respectively: New servers are assigned half of the data partitions of existing servers, they cache portions of their data and answer queries on their behalf. The larger the resize, the bigger the decrease in latency. The same hold for the update workloads: Adding more nodes reduces the query latency from 11 sec to around 7 in the UPDATE+8 case and to around 5 in the UPDATE+16 case. Again, we notice here that writes are in general faster than reads: This is due to the weak consistency model followed by Cassandra, where writes do not have to be propagated to every replica holder for the operation to succeed. Query throughput µ shows a similar trend. Both in read and update workloads we notice the almost linear effect of adding new nodes. Read throughput is increased from an initial value of 9 Kreqs/sec to 18 Kreqs/sec when 8 nodes are added and to 22 Kreqs/sec when 16 nodes are added. Update throughput is increased from around 15 Kreqs/sec to 29 Kreqs/sec in the +8 case, and to 35 Kreqs/sec in the +16 case. This behaviour is expected, since extra servers immediately join the p2p ring and take portions of the applied workload. Moreover, the asynchronous nature of eventual consistency enables Cassandra to maintain a stable throughput rate even in a write-heavy workload: Updates are successful upon transmitting the object to a single server, which replicates it later on in a lazy manner. Finally, in the third graph of Figure 4 we present the variation of the total cluster’s CPU usage during time. In the read case, we notice that adding 8 nodes slightly decreases the initial CPU usage to around 60%, whereas adding 16 extra servers decreases the average CPU load to around 50%. Similar to the HBase case, the 50% load of the 24-node cluster shows that the applied load is big enough for every server to contribute, since new servers are not idle. The same hold for the update workloads: Adding 8 nodes brings the load to around 80% and the addition of 16 nodes drops the load to around 70%. Update workloads are more computationally heavy than simple reads, as in the update case there is an extra cost of disk access that is avoided during reads by
caching fetched results. In this kind of setting, we note how both NoSQL systems take advantage of the addition of extra nodes: HBase exhibits very fast concurrent reads compared to Cassandra: In the READ+16 case it can handle 160 Kreqs/sec with a latency of about 2–3 secs and an aggregate CPU usage of 40%, whereas Cassandra’s throughput is 40 Kreqs/sec, a latency of around 8 secs and a higher CPU usage of 50%. On the other hand, Cassandra is more efficient with object updates: It maintains stable throughput and latency curves avoiding oscillations that occur with HBase. Finally, we notice that Cassandra does not exhibit a negative transient effect when new nodes enter the ring. Its decentralized nature allows for a transparent cluster resize, whereas in HBase the HMaster needs to coordinate the whole procedure.
4.4
Elasticity-provisioning prototype
In this section we present some initial results achieved using our framework to deploy a fully automatic cluster resize system. Our goal is to demonstrate the effectiveness and modularity of our design to allow for adaptive cluster resize without any human involvement. We utilize a long running read-heavy load through the YCSB tool, for a total load of 9 Kreqs/sec on an 8-node HBase cluster. Approximately 7 minutes into the experiment, an additional load of 180 Kreqs/sec is created using extra YCSB clients. The high load is run to completion, at which point the system returns to operation with medium and then low load. The expected behaviour we plan to achieve is through the use of a well-behaving balancing module to add nodes as the load increases beyond the servers’ capability and then return to the original cluster size once the extra load has faded. To achieve this, we have configured our rebalancing module with a number of triggers taking advantage of our experience from the previously-presented experiments. The parameter to trigger node addition is CPU usage of over 40%, for any one server on the cluster. This is in order to identify servers that are over-working despite a well-behaving operation of the cluster as a whole. On the other hand, to remove a node, our threshold is CPU usage of 15% or lower for all nodes in the cluster, as a removal should occur only when all servers have minimal load. To avoid oscillations, as both metrics could vary greatly during normal operation, we complement these metrics with the provided load_five Ganglia metric, a running average of the load in the last 5 minutes that helps in determining whether the CPU load is constant over time or whether it was caused by a transient process. These conditions for node addition and removal follow our experience with HBase’s operation. As we have observed,
# nodes % CPU
20 0
1000
2000 3000 4000 Time(sec)
5000
8 4 0
16
150
12
100
# nodes throughput
50
8 4
1000
2000 3000 4000 Time(sec)
5000
0
Number of Nodes
40
Throughput (Kreqs/sec)
12
Number of Nodes
% of CPU usage
16 60
Figure 5: CPU usage and query throughput for an HBase cluster of 8 nodes under dynamic load changes. the cluster seems to reach its peak performance when the average CPU load approaches 50%. The trigger was set a bit lower at 40% so as to deal pro-actively with load spikes. Also in Figure 2, we can see that the total CPU load for very small λ remains under 15%. A CPU load of under 15% indicates then that most cluster servers are idle and, as a consequence, one or more of them are redundant. As we can see in Figure 5, the experiment has validated our expectations from the experimental results. The low initial load stresses the servers enough to avoid a node removal but not enough for a node addition. Once we initiate the load increase (first vertical line, throughput graph), CPU increases dramatically and 10 minutes are needed for the new node to be fully operational and monitored. This happens for two reasons: First, launching, configuring and adding a new node to the cluster takes approximately 5 minutes (see Section 4.2). Second, the load average over 5 minutes has to significantly increase in order for the action to be triggered by one of the nodes. The total throughput, as measured on the whole cluster, increases as expected after each addition. The high load requests complete before the addition of the fourth extra node. At this point (second vertical line of throughput graph) the total load decreases significantly, but not substantially for a new node addition. The system continues its normal operation, since the medium load is just enough to prevent node removal. Once the load drops under the lower threshold (third vertical line), node removal proceeds. As shown, node removal is much faster than node addition, thus the system returns to its original size in about 5 minutes. In terms of throughput, each node addition produces a noticeable increase to the number of server requests, from about 100K to 130K before the high load part of the experiment finishes, despite the fact that no operation is performed to rebalance the cluster’s data. CPU usage does not drop significantly during single node addition, since there are not enough nodes added to accomodate the high load efficiently.
5.
RELATED WORK
A literature study about the challenges of scaling whole applications in cloud environments is presented in [28], along with an overview of state of the art efforts towards that goal. In [16], the authors propose a service specification language for cloud computing platforms that handles automatic deployment and flexible scaling of services. Similarly, the work in [22] designs a model implementing an elastic site resource manager that dynamically consolidates remote cloud resources on demand based on predefined policies and a prototype for extending Torque clusters. The works in [29, 26] solve the problem of optimizing VM resources (CPU, memory, etc) to achieve maximum performance using relational
DBs. In comparison, we use the standard VM model that large cloud providers currently offer. As a general observation, these works do not address NoSQL systems and their performance under (dynamic) cluster resizes. The work in [21] presents policies for elastically scaling the Hadoop-based storage-tier of multi-tier Web services based on automated control. Oppositely, we studied NoSQL systems that store structured data and are easier to manipulate in the application level. We converge in adopting the same metric, CPU Utilization, and evaluating rebalancing costs. The main difference is that this approach is HDFS-specific since monitoring was integrated in HDFS nodes, while data rebalance is mandatory for the new nodes to become operational. On the contrary, our framework uses an external monitoring tool, Ganglia, so as to be generic and applicable to any NoSQL system and rebalancing need not be forced, as it strongly relates to the NoSQL system used. A thorough analysis of various proprietary NoSQL-like cloud services, namely Google’s AppEngine, Microsoft’s SQL Azure and Amazon’s SimpleDB, is presented in [19]. The authors test system aspects such as scalability, cost and performance utilize the TCP-W benchmark. All systems are treated as “black boxes”, since no information about their design or implementation is assumed to be known. In contrast, our system is fully aware of the different engines’ inside mechanisms. Moreover, we utilize our measurements to present a modular framework that can be used to realize automatic cluster-resizing. Cloudy [18] is a cloud-enabled framework which supports auto-scaling features according to demand, providing simple key/value put/get primitives. Nevertheless, compared to our system, it is not designed to support numerous NoSQL databases. In NEFELI [27], cloud users inform the cloud management framework with hints about the application nature and the framework modifies its scheduling policies to improve the application performance. The difference is the need for a middleware to be installed inside the cloud management layer, whereas our framework utilizes only the cloud client tools, being completely agnostic about the internals of the cloud management platform, enabling it to be installed over various platforms. CloudWatch [1] is Amazon’s commercial product for monitoring and managing cloud resources. CloudWatch offers a set of metrics for every VM instance and a policy framework to trigger balancing actions when some conditions are met. Its metric support is limited, offering only hypervisorrelated information such as CPU usage and network traffic. Memory usage or application-specific metrics are not supported out of the box, in contrast to Ganglia which, apart from its own rich set of probes, has inherent support from many applications, including some NoSQL systems. CloudWatch, as a general purpose tool, does not have inherent
support for NoSQL and as of this, the extra coding to reconfigure the application cluster after a hardware resize is not avoided. Other frameworks for commercial cloud platforms like AzureWatch [4] feature similar characteristics, resulting in expensive vendor lock-ins.
6.
DISCUSSION
As our architecture and experimental section makes clear, there exists a number of often conflicting factors that our framework needs to take into account. During our design and implementation, we have observed that there are numerous pitfalls and dubious assumptions about several components, e.g., about the elastic capabilities of NoSQL databases. In the following, we argue on the design choices and offer recommendations based on our experience in setting up this system.
6.1
Monitoring module
Certain design decisions have to be made concerning the monitoring module. The most important of them are the type of monitoring, the relevant metrics that will be monitored, and the avoidance of single points of failure. Monitoring can be either active, achieved by periodically injecting probing queries, or passive, thus collecting statistics from already posed user queries. Similarly, monitored metrics could include either general-purpose metrics (such as network traffic, memory and CPU usage per VM) or high-level application-specific metrics (such as mean query response time), and they should ideally be collected in a fast and scalable way. Active monitoring implies running a specialized tool for determining the state of the database cluster as a whole, while passive monitoring could use statistics exported from the VMs and database-specific metrics reported from the database system. Our design has opted for the passive monitoring solution without database-specific metrics for two reasons; speed and accuracy. Active monitoring entails a significant trade-off between speed, accuracy and system abuse. This means that executing long running tests would interfere with the system’s normal operation stressing or altering it (in the case of writes). On the other hand, if small tests were to be chosen, they would fail to spot possible stress on very active data regions, giving an inaccurate state of the cluster’s performance. Results of Section 4.1 show that we can fairly accurately distinguish both the critical state of each database system and the amount of load that currently stresses the system using passive, general purpose metrics. We have selected to utilize the VM-related metrics for generality, because not every database uses the same metrics or reports them in a comparable manner. Passive data-collection through Ganglia, besides using a unified way to report accurate statistics in human readable format, is easy to setup in an elastic way, requiring only a single configuration file to be propagated amongst different monitored VMs. Ganglia offers proven scalability. Data can be collected remotely for individual hosts or for the whole cluster by probing the metadata aggregation service (gmetad). These collected statistics are then remotely accessed and evaluated in order for a system administrator or automated system to decide on appropriate rebalancing actions.
6.2
Database elasticity
Deciding the best way to elastically alter the cluster size
for each database, one has to take into account each DB’s characteristics. This includes data and region rebalancing, the ability to expose changes to the DB’s clients and avoid data loss when scaling down. Although HBase, Cassandra and Riak claim that they behave in an elastic way, the practicalities of scaling up or down differ in each system due to their architectural differences, and therefore affect the performance gain in each case. The ability to automatically rebalance different database regions (or shards in RDBMS terminology) is crucial for any elastic system. In HBase, region rebalancing is automatically performed by the HMaster when new nodes are added or removed from the cluster, and the Zookeeper is responsible for propagating and resolving conflicts between RegionServers, as per the HMaster’s decision. Given that all RegionServers operate on top of a shared file system (HDFS) there is no preferential treatment when assigning new regions, thus HMaster can easily deal the available regions in a fair way. Therefore, HBase is extremely elastic, as all new nodes can quickly assume load, increasing the cluster’s performance in very short time, as reported. Conversely, Cassandra does not split data into regions of equal size. As a decentralized system, it reassigns regions on a per node basis, i.e., region rebalancing is performed in node pairs between newly arrived and previously existing ones. Every new node acquires and is responsible for serving half the key-space of an existing one, meaning that for each request it has to retrieve data from the previous owner. Despite the fact that retrieved data are cached, new nodes are practically much slower, as they have to rely on existing nodes for results. In order for a new node to assume all the data corresponding to its key-space, a data rebalance operation has to be performed. Although our experiments show a 22% boost in terms of throughput compared to an unbalanced cluster of the same size, data migration took more than 11 hours and moved almost the entire dataset of 90GB. The need for such an expensive operation limits the elasticity of a Cassandra cluster for short-term load variations. Riak, on the other hand, divides data space into partitions and as new nodes are added, they claim an equal slice of partitions so that both data and requests are allocated evenly to all nodes participating in the ring. However, the fact that the cluster turns unresponsive for a throughput higher than what its nodes can handle, prevents us from examining its elasticity under high load. Overall, the important question is whether data rebalancing operations are necessary and when. In our opinion, data rebalancing should only be performed when the system administrator can accurately predict that the load will remain constant for a large amount of time, that is in the order of days. In this case, a data rebalancing operation should be performed, even if it affects peak system performance, as the overall gain justifies the time and performance cost of the rebalancing. On the contrary, variable and unpredictable load in the order of hours does not justify such an expensive of operation, and should be avoided. In this work, our goal is to test NoSQL systems undergoing extremely dynamic elastic operations under variable high load. This behaviour can be achieved using Cassandra and HBase, although the results are not similar. HBase’s operation over a similarly elastic, shared file system, and infrequent compactions provide the best results. Elastic behaviour has to also be exploited on the client
side, which means that the clients can be made aware of the addition of new servers. This is achieved automatically in HBase’s case, as clients negotiate with the HMaster. However, Cassandra and Riak need an explicit load-balancer external to the database system to simulate such a behaviour, affecting performance in terms of latency. Finally, there is the matter of avoiding data loss during node removal. To avoid data loss, there should remain at least one replica during node removal. For this guarantee, only 2 nodes can be removed at once, in the case of a replication factor of 3. What is more, after the removal, NoSQL systems must deal with the degraded replicas. Since Cassandra and HBase do not perform this automatically, it must be manually handled by the elasticity framework by explicitly issuing data rebalancing commands, which is, as we have shown in 4.3, a costly procedure.
7.
CONCLUSIONS
In this work we presented a thorough study to quantify and analyze the costs and gains of various NoSQL cluster resize operations, utilizing three popular NoSQL implementations. To this end, we designed and implemented a fully modular and cloud-enabled framework that allows efficient resource monitoring and direct interaction with the cloud vendor and the cluster manager. During this study, lots of valuable lessons were learned and much experience was gained relative to both cloud-platforms and NoSQL engines. A primary concern relates with the provisioning of a platform-agnostic, non-intrusive and metriccomplete monitoring module. Our Ganglia choice offers a complete set of metrics reported in a scalable manner, even with native NoSQL support (e.g., for HBase). Moreover, requiring just an image from a NoSQL engine enables different implementations being tested over the same framework. The ease of setup and the performance under elastic operations weigh on choosing a particular NoSQL. All three engines we tested can be setup with relative ease. There are few configuration files that need to be injected during launch and most of the operational parameters can be adjusted by altering the appropriate settings. There is no need to provide new configuration files or commands during normal operation, especially during the rebalancing phases. Nevertheless, their quite distinctive behavior and performance under different scenarios make the decision quite applicationspecific: HBase is the fastest and scales with node additions (only for reads though); Cassandra performs fast writes and scales also, without any transitional phase during node additions; Riak was unresponsive in high request rates, could scale only at lower rates but rebalances automatically; all three achieve small gains from a data rebalance, provided they are under minimal load. We believe that this work has demonstrated the feasibility of our ultimate goal. Based on our findings, we offered a prototype implementation of our automatic cluster resize module, that matches the number of provisioned resources against the total demand and the application expert’s rules of required operation. Our open-source implementation can provide a good basis on which numerous applications can test their adaptivity at very-high scale.
8.
REFERENCES
[1] Amazon CloudWatch. http://aws.amazon.com/cloudwatch/.
[2] Amazon Elastic Compute Cloud (Amazon EC2). http://aws.amazon.com/ec2/. [3] Amazon SimpleDB. http://aws.amazon.com/simpledb/. [4] AzureWatch. http://www.paraleap.com/azurewatch. [5] Google AppEngine. code.google.com/appengine. [6] HBase Homepage. http://hbase.apache.org. [7] OpenStack: The open source, open standards cloud. http://openstack.org. [8] Project Voldemort. http://project-voldemort.com. [9] Riak Homepage. https://wiki.basho.com/display/RIAK/Riak. [10] The Apache Cassandra Project. http://cassandra.apache.org/. [11] Windows Azure Platform. http://www.microsoft.com/windowsazure/. [12] D. J. Abadi. Data Management in the Cloud: Limitations and Opportunities. IEEE Data Eng. Bull, 32(1):3–12, 2009. [13] F. Chang, J. Dean, S. Ghemawat, W. C. Hsieh, D. A. Wallach, M. Burrows, T. Chandra, A. Fikes, and R. E. Gruber. Bigtable: A distributed storage system for structured data. In OSDI, 2006. [14] B. F. Cooper, A. Silberstein, E. Tam, R. Ramakrishnan, and R. Sears. Benchmarking Cloud Serving Systems with YCSB. In ACM SOCC, pages 143–154, 2010. [15] G. DeCandia et al. Dynamo: Amazon’s Highly Available Key-value Store. In SOSP, page 220, 2007. [16] F. Gal´ an, A. Sampaio, L. Rodero-Merino, I. Loy, V. Gil, and L. M. Vaquero. Service specification in cloud environments based on extensions to open standards. In COMSWARE, 2009. [17] E. Horowitz. Foursquare Outage Post Mortem. http://bit.ly/gjA2IK. [18] D. Kossmann et al. Cloudy: a Modular Cloud Storage System. In VLDB, 2010. [19] D. Kossmann, T. Kraska, and S. Loesing. An Evaluation of Alternative Architectures for Transaction Processing in the Cloud. In SIGMOD, pages 579–590, 2010. [20] A. Lakshman and P. Malik. Cassandra: A Decentralized Structured Storage System. SIGOPS Oper. Syst. Rev., 44(2):35–40, 2010. [21] H. C. Lim, S. Babu, and J. S. Chase. Automated control for elastic storage. In ICAC, 2010. [22] P. Marshall, K. Keahey, and T. Freeman. Elastic site: Using clouds to elastically extend site resources. In CCGRID, 2010. [23] M. L. Massie, B. N. Chun, and D. E. Culler. The Ganglia Distributed Monitoring System: Design, Implementation, and Experience. Parallel Computing, 30(7):817–840, 2004. [24] D. Nurmi, R. Wolski, C. Grzegorczyk, G. Obertelli, S. Soman, L. Youseff, and D. Zagorodnov. The Eucalyptus Open-Source Cloud-Computing System. In CCGRID, pages 124–131, 2009. [25] A. Pavlo, E. Paulson, A. Rasin, D. J. Abadi, D. J. DeWitt, S. Madden, and M. Stonebraker. A Comparison of Approaches to Large-Scale Data Analysis. In SIGMOD, pages 165–178, 2009. [26] A. Soror, U. Minhas, A. Aboulnaga, K. Salem, P. Kokosielis, and S. Kamath. Automatic virtual machine configuration for database workloads. In SIGMOD, 2008. [27] K. Tsakalozos, M. Roussopoulos, V. Floros, and A. Delis. Nefeli: Hint-Based execution of workloads in clouds. In ICDCS, pages 74–85, 2010. [28] L. M. Vaquero, L. Rodero-Merino, and R. Buyya. Dynamically scaling applications in the cloud. SIGCOMM Comput. Commun. Rev., 41:45–52, 2011. [29] P. Xiong, Y. Chi, S. Zhu, H. J. Moon, C. Pu, and H. Hacig¨ um¨ us. Intelligent management of virtualized resources for database systems in cloud environment. In ICDE, 2011.