Security-aware elasticity for NoSQL databases Athanasios Naskos1 , Anastasios Gounaris1 , Haralambos Mouratidis2 , and Panagiotis Katsaros1 1
2
Department of Informatics, Aristotle University of Thessaloniki, Greece {anaskos,gounaria,katsaros}@csd.auth.gr School of Computing, Engineering and Mathematics, University of Brighton, UK
[email protected]
Abstract. We focus on horizontally scaling NoSQL databases in a cloud environment, in order to meet performance requirements while respecting security constraints. The performance requirements refer to strict latency limits on the query response time. The security requirements are derived from the need to address two specific kinds of threats that exist in cloud databases, namely data leakage, mainly due to malicious activities of actors hosted on the same physical machine, and data loss after one or more node failures. We explain that usually there is a trade-off between performance and security requirements and we derive a model checking approach to drive runtime decisions that strike a user-defined balance between them. We evaluate our proposal using real traces to prove the effectiveness in configuring the trade-offs.
1 Introduction Cloud computing is an evolving paradigm that has transformed the way organisations and individuals store, share and access their information. It introduces a number of advantages and benefits by supporting a computational infrastructure where availability of resources is dynamic, meaning that hardware and software are provided on demand when users need them at a reasonable monetary cost. On the other hand, the paradigm also creates challenges and introduces concerns related to security. In fact, many organisations and individuals are still avoiding cloud services mostly because they are not sure if the services provided, typically by different providers, are suitable for their security requirements. Security concerns related to data leakage and data loss are of particular importance. Simply speaking, data leakage is the unauthorised transfer of data from one user to another. Each user should have access to their own data and not be able to access the data of others unless are authorised to do so. In the cloud, the risk of data leakage is increased due to the storage of data in a multi-tenant environment. A recent study [6] has shown that the risk of data leakage is increased for a company when employees use cloudbased services. On the other hand, data loss refers to a condition where data is destroyed and becomes unavailable. This could be the result of a malicious act (e.g. an attack to an organisation’s data), due to human error or due to hardware/software/network failures. In a cloud environment - and in particular in a multi-tenant environment - the risk of data loss can be increased due to the multi-tenancy situation.
We deal with a particular feature of cloud databases, namely elasticity, in light of security concerns. Elasticity allows cloud users to modify the amount of resources used on-the-fly, so that they can always handle the external request load, even when load changes are unanticipated. It is manifested in three main forms, horizontal scaling, where virtual machines (VMs) are added or removed, vertical scaling, where the hardware configuration of the existing VMs is modified, and migration, where existing VMs are moved between physical hosting machines. More specifically, in this work, we extend our previous work [14] on performance-oriented horizontal scaling so that we can reach elasticity decisions that take into account both performance and security requirements. Performance requirements are expressed as a threshold regarding the maximum allowed response time to user requests, while security requirements are expressed through the probability of data leakage due to multi- tenancy and of data loss through hardware failure and/or due to multi-tenancy. Ideally, one would aim to attain zero violations of the performance threshold, no security incidents, while minimizing the monetary cost associated with the provision of cloud VMs. Problem Challenges. The main challenge in the setting described above stems from the fact that the three requirements, that is bounded response times, minimal monetary cost and protection from failures and data leakage, are essentially intertwined and contradicting to a large extent, as explained below: – NoSQL databases partition the data across several nodes and can benefit from the inherent feature of cloud infrastructures to dynamically provision resources. The combination of these two characteristics allow cloud databases to horizontally scale when the external load increases, so that more servers become available to respond to user requests. If horizontal scaling is performed carefully, for example, in a load balancing way that avoids over-reacting, the average response time can be maintained to a certain desired level regardless of any changes in the external load. More specifically, more VMs can be added (scale-out) when the load increases, but this comes at an increased monetary cost. Analogously, when the external load decreases, some servers can be released by the user on the grounds that over-provisioned servers incur unnecessary monetary cost. In private clouds, monetary costs are implicit (e.g., through increased energy consumption), whereas, in public clouds, a fee is actually paid. – Online services may become unavailable due to failures of both the physical machines and the network, which can lead to data loss. The main mechanism to address this type of threat is through replication (or mirroring) that allows for data to be copied to several servers. The more the copies, the more resistant to failures the system becomes. However, this comes at the expense of higher response times when updating data, since eventually changes need to be propagated to all copies. Moreover, the more VMs are employed, e.g., for performance reasons, the higher the probability a number of VMs equal to or greater than the replication factor to fail thus leading to data loss.3 . – Despite any efforts from cloud providers, there is always the danger that malicious cloud users hosted on the same physical machines as the databases get unautho3
The volume of lost data decreases with the number of VMs for the same replication factor.
rized access to data. Intuitively the more physical machines are used to host the database, the higher the danger, whereas, at the same time, public machines are more vulnerable. To summarize, scaling out a database may improve the performance, but this may incur unnecessary monetary costs due to over-provisioning. Mirroring can be combined with scaling out and may cause performance problems but increases the robustness to failures. Scaling out may also exacerbate the data leakage and data loss threats. As such, keeping latency low through scaling-out is in contrast to monetary cost and avoiding the threat of data leakage and data loss. Real-world Motivating Example. We take motivation for our work from a real-case scenario, the Greek National Gazette Infrastructure, involving the sharing and storage of large number of documents. The Greek National Gazette is responsible for publishing laws and legal decisions on the Government’s newspaper in order for these laws and decisions to be active and applicable. Besides legal decisions there are also a number of decision categories originated from the private and public sector that by law must be send for publications to the Governments’s newspaper. In such scenario, the dynamic provision of services with acceptable performance is very important as is the need to make sure that documents are not leaked before the official publication, and they are not lost after they are published. Contributions. The contributions of this work are twofold. First, we present a Markov Decision Process (MDP) modeling approach to cloud elasticity, coupled with probabilistic model checking and accompanied by a security threat-aware decision mechanism; to this end, we build upon our performance-oriented proposal in [14]. The elasticity decision mechanism can account for user-defined trade-offs between performance and security requirements, while aiming to avoid over-provisioning in any case. Second, we present an evaluation that sheds light upon the impact of security requirements on the elasticity behavior. Our results show that our decision making proposal can effectively strike a configurable balance between the conflicting requirements mentioned above. Structure. The remainder of this paper is structured as follows. In Sec. 2, we present the MDP models and the decision mechanisms developed. In Sec. 3, we evaluate our proposal for a wide range of security attack and failure probabilities using real cloud database traces. We discuss the related work in Sec. 4 and conclude in Sec. 5.
2 Model-based security-aware elasticity This section presents the probabilistic Markov Decision Process (MDP) model, which serves as the basis of our proposed security-aware elasticity decision making mechanism. We first introduce the basic modeling representation at a conceptual level and how it is used to drive performance-oriented elasticity (initially proposed in [14]); this approach is then extended and refined to cover both performance and security issues.
MDPs are specified by their states, actions, transition probabilities and rewards [17]. In our model, each state corresponds to a different cluster size, where the size equals to the number of active cloud virtual machines (VMs), vms num, running a NoSQL database, such as HBase and Cassandra. The NoSQL database is typically both sharded and replicated; i.e., its tables are horizontally fragmented and each fragment is allocated to multiple VMs. For readability reasons, we denote a state as s[vms num] . There are three types of possible actions on every state: 1) add for VM additions, 2) rem for removals, and 3) no op for no operation. For every distinct number of VM additions or removals (ex. add1 , rem2 ) there is a separate action, and the corresponding transitions between two states through the same action have aggregate probability 1.
re
d1 ad
prob
no op
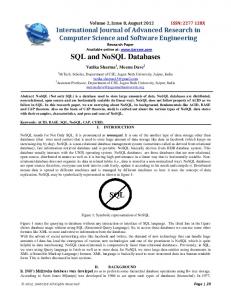
Fig. 1 (left) illustrates basic s3 current a simplified instance of the MDP model, where the sx states represent the number of active VMs. The edges extended represent the possible actions: 1) addx (blue arrow), s4 2) remx (red arrow), and 3) no op (black arrow); x is the number of new or removed VMs. In this examadd ple, the maximum number sx 1 sx sx n s5 remove ··· of VMs allowed to be added no op or removed in every step is 2, while the current numFig. 1: MDP model overview. ber of active VMs is 3 (s3 state). The action type is labelled on top of every transition ([addx /remx /no op]). The MDP associates a reward value to each state and action taking into account the current external conditions. State and action rewards are calculated based on user-specified utility functions, as discussed later. The external conditions considered in this work are captured by the user external load λ, which is measured as the amount of submitted queries per time unit. When the model is verified at runtime, the reward at state s[vms num] essentially reflects the expected utility of the system when there are vms num active VMs for the current value of external load.
m
prob 1 prob···
1
m
ad d1
re
no op
prob 2
no op
rem2
1
add2
The probabilistic nature of our model can easily capture the uncertainty of the environment that follows every elasticity decision; for example, for the same cluster size and external load, p% times in the past where no performance violations and (1-p)% there were ones. To mitigate uncertainty, Fig. 1 (right) illustrates an extension to the states of the model of Fig. 1 (left). Each model state for a specific cluster size is extended to n states, to better map the behavior of interest (i.e. performance, security). Each new smaller state corresponds to a different expected system behavior and is derived through clustering the log entries for the same external load and cluster size, resulting in deviations from expected behavior. The probability of transition to each possible state is commensurate to the probability of occurrence of the corresponding’s state behavior.
2.1 Model-based elasticity for performance A common performance requirement is the latency lat of processing user requests, i.e. the time elapsed from query submission to answer, not to exceed a certain threshold x, regardless of the number of concurrent users. However, for the same number of VMs and the same amount of incoming load λ, the latency may vary significantly, due to factors that are both external to our model and hard to model; e.g., a time-consuming operating system process is initialized. To ameliorate this, as presented in Fig. 1 (right), there are more than one model states (sx1 , sx··· , sxn ) for a single size x. In [14], several elasticity policies are examined, and the most effective one was termed as ADV+VC+PRE, standing for advanced+violation-cluster+prediction. More specifically, the policy is termed as advanced because it computes the cumulative reward after a pre-specified number of transitions in the model, called steps; this configurable parameter is set to 3, based on experimentation with different values [14]. The VC label indicates that one of the extended states in the model of Figure 1 (right) covers those states that violate the response latency threshold, while the other extended states correspond to non-violating states with different behavior. PRE indicates that a prediction mechanism of future incoming load is utilized. Rewards are associated only to⎧model states and are derived according to the following utility function: ⎨0, if lat > x u(vms) = , where vms is the current number of VMs. ⎩ 1 + (1/vms), if lat ≤ x As such, this utility function includes a user-specified constraint and manages to take into account both performance issues (through the lat threshold) and the monetary costs. The latter are implicitly considered by decreasing the utility in a way inversely proportional to the number of machines when there is no performance violation. Overall, this utility function penalizes both under-provisioning and over-provisioning. In this policy, one initial state in Fig. 1(right) is mapped to more than one states to cover (i) the occasion of latency threshold violations and (ii) normal execution. The transition probability for each state is estimated according to log measurements of similar past conditions; the similarity is defined in terms of the external load. Finally, the model is equipped with a prediction module, which allows for predicting the evolution of the external load and thus computing the expected reward of each model state at each time step in the future more accurately. The probabilities and state rewards are instantiated every time elasticity actions are considered based on the current external load. Then, a two-phase model verification procedure takes place to decide the optimal path considering the performance. To this end, the PRISM tool is used [10]. PRISM property specification language is PCTL probabilistic temporal logics. In the first phase, we ask for the maximum cumulative reward of the model, generating multiple optimal paths (sequences of states) that lead to the same optimal reward. Secondly, every first action of every optimal path is checked with another PCTL property to define its maximum probability of performance specific Service-Level Agreement (SLA) violation. The first action with the minimum maximum performance violation probability is the one selected from our decision mechanism: P max =?[F (stop)&(lat > x)&(f irst action = [action]),
where [action] is every first action of every possible path which leads to the optimal cumulative reward and stop is a flag that indicates that the verification of a path should stop if the maximum number of steps is reached. 2.2 Model-based elasticity for data leakage The performance-oriented model aims to avoid performance violations, while avoiding costly over-provisioning. In this section, we describe how our model is enhanced with capabilities to capture data leakages and consider them during elasticity decision making. The modifications refer to both the main model and the decision policy. More specifically, we further extend the state transformation presented in Fig. 1(right) introducing two-layer extensions. Hence, every sxi state is further transformed to sxia and sxina states, where i ∈ [1, n], a stands for attack and na stands for no attack. The probability of these two new states is computed through the multiplication of the probi probability and the probability of attack probia or no attack probina , respectively, i.e., probi = (probi · probia ) + (probi · probina ), since the data leakage attacks and latency violations are considered to be independent events. We consider that there is an explicit mechanism to count and report the number of attacks leading to data leakages in a periodic manner, e.g. [15]. The data leakage probability information is used in our models to initialize the transition probabilities to states that represent safe or not safe states. A reasonable assumption is that the probability of attacks per VM is the same and equal to proba , and the attacks on different VMs are statistically independent; in that case, probia becomes equal to i · proba In addition, we apply modifications to the above model verification procedure: 1. The utility function is extended to account for data leakages and performance tradeoffs through a 3-parameter function. The exact formula employed is as follows: ⎧ ⎪ ⎪ if attack = true ⎪ ⎨0, u(vms) =
a, if lat > x ⎪ ⎪ ⎪ ⎩ b + (c/vms), if lat ≤ x ∧ attack = f alse.
where a, b and c are user defined values and attack is a flag that indicates a data leakage. In Sec. 3 we show how setting the 3 parameters, can yield configurable trade-offs between the different objectives. 2. The second PCTL property (Sec. 2.1) is transformed to seek the first action with the minimum maximum probability of both performance specific SLA violation and data leakage: P max =?[F (stop)&(lat > x ∥ attack)&(f irst action = [action]) 2.3 Model-based elasticity for data loss As discussed in the introduction, data loss can be caused by malicious co-tenants and system failures. The attacks due to insecure multi-tenancy can be handled in exactly the
same way as those leading to data leakage. For the data loss threat, the same 3-parameter utility function can be employed as well. However, the model transition probabilities to states corresponding to failures require a bit more attention and need to be aware of the degree of replication r. To suffer from data loss, at least r machines need to become unavailable at the same time. If the probability of failure % & of one machine is pf , then the probability of r machines failing simultaneously is nr prf .
3 Evaluation Experimental Setup We have used logs from a real Cassandra infrastructure to conduct systematic experiments. The collected measurements are used firstly, to populate the initial logs, and secondly, to emulate a real situation. Through emulation, we have managed to fairly test each policy or configuration on an equal basis. The workload consists of asynchronous read requests (req), the volume of which evolves in a sinusoidal manner varying from 4000 to 16000 req/sec coupled with with 2 plateau periods at 13000 req/sec for 1000 time units each. We collected measurements every 30 secs and, in our emulation, a time unit is equal to this measurement collection period. In each sine period, there are 360 measurements. We allow an elasticity action to take place every 10 time units, to emulate a system that may modify the VMs every 5 mins (or 10 mins is cases of add action, to allow the system to stabilize). As the emulated load is generated based on the logs, which also act as training set, we consider that the system is well trained, and as such, the MDP models are instantiated in an accurate manner. In every up-scale action, up to 3 VMs can be added, while during down-scaling, up to 2 VMs are allowed to be removed in a single step. The cluster sizes varies from 8 up to 18 VMs. Every experiment runs for 5 iterations. Further details are provided in [14]. Dataset Latency Distribution (8 VMs)
3
10
Dataset Latency Distribution (18 VMs)
2
10
1
10 4000
50 ms 45 ms
Latency
Latency
50 ms 45 ms
1
6000
8000
10000 Load
12000
14000
16000
10
4000
6000
8000
10000 Load
12000
14000
Fig. 2: Latencies for 8 (left) and 18 (right) VMs Fig. 2 presents the latency distribution in two characteristic states of the collected dataset, where the dotted line shows the latency threshold of 45 msecs and the solid line of 50 msecs in both figures. For the minimum cluster size and lowest amounts of load, there are few latency values that violate the thresholds (mostly caused by the cold cache of the system at the beginning of the measurement collection) and the system can handle load up to about 8000 req/sec. However, additional machines need to be added if the load further increases to avoid performance threshold violations. For the maximum
ADV+VC+PRE DLeak-0 DLeak-1 DLeak-2 DLeak-3 45 msecs
12.5
8
12.3
11.7
12.4
50 msecs
12
8
11.8
11
11.9
Table 1: Average number of active VMs (0.1% attack probability) number of active VMs (18), except from a few outlier measurements, the system can handle the full amount of the incoming load. 3.1 Experimental Results Our experiments show the trade-offs between security attacks and latency violations for a series of utility function configurations and probabilities of attack incidents. Data Leakage Results The utility function presented in Sec. 2.1 tries to maintain the lowest number of active VMs, when there is no latency violation applies. In these cases, as the number of active VMs is placed in the denominator (1 + (1/vms)), overprovisioning is avoided, which additionally, alleviates the data leakage threat. The utility function presented in Sec. 2.2, aims to control the data leakage probability both more directly and in cases, where the performance threshold is exceeded, through deriving an acceptable tradeoff between the increase in the number of latency violations and the decrease in the number of data leakage attacks. In the first set of experiments, the latency threshold in the utility function is set to either 45 msecs or 50 msecs. Initially, we set the probability of data leakage attack per VM per step to 0.1%; later, we examine data leakage probabilities that differ by an order of magnitude. We examine four different parameter setups for the utility function presented in Section 2.2: – – – –
DLeak-0: a = 100, b = 100, c = 1 DLeak-1: a = 0.5, b = 1, c = 1 DLeak-2: a = 100, b = 100, c = 160 DLeak-3: a = 100, b = 1000, c = 1600
Intuitively, DLeak-0 tries to avoid attacks at any performance cost. The other 3 policies place more importance on latency violations than DLeak-0. In Fig. 3, we present the adaptation of the number of VMs to the incoming load for each policy. The red dotted line represents the incoming load while the solid blue line represents the number of active VMs. Except few instabilities, due to imminent environment uncertainty infused in our emulations, all the policies/configurations can broadly follow the load variation. Fig. 4(left) on the left presents the percentage of time steps where latency violations (left blue bar) and data leakages (right green bar) occur for the ADV+VC+PRE policy. In this experiment, the latency threshold is 45 msecs, and, for cluster size from 8 to 18 VMs, the attack probability ranges from 0.8% (lower bound) to 1.8% (upper bound)4. ADV+VC+PRE manages to yield a very low number of performance viola4
This implies that the database owner fully accepts the 0.8% probability of attacks. However, all the numbers can be transferred to a setting, where the cloud is hybrid with 8 private VMs and up to 10 public VMs. If the attack probability is 0% for the private ones, then all attack percentages become 0.8% less.
Fig. 3: Variation of the external load and the number of active VMs
Fig. 4: Aggregated Latency Violations and Data Leakage Percentage for 45 msecs (left) and 50 msecs (right) latency thresholds and 0.1% data leakage probability per VM. tions, at the expense of non-negligible secutiry attacks. The second pair of columns in the same figure presents the results for DLeak-0, where the system is actually penalized (zero reward) only for the attack situations, as the latency violation reward is very close to the no-attack no-violation case. As expected, the number of VMs is kept at the minimum possible number, i.e. 8 VMs; see Table 1. Overall, the attacks are reduced to their minimum, however the latency violations are reaching their highest percentage (65.63%).
Fig. 5: Aggregated Latency Violations and Data Leakage Percentage for 45 msecs (left) and 50 msecs (right) latency thresholds and 1% data leakage probability per VM ADV+VC+PRE DLeak-0 DLeak-1 DLeak-2 DLeak-3 45 msecs
12.4
8
12.2
10.9
12.2
50 msecs
12
8
11.4
10.8
11.6
Table 2: Average number of active VMs (1%) As we also observe in Fig. 4, the DLeak-2 parameterisation achieves a reduction in the deviation from the lower bound of probability attacks of 20% (from 0.4% to 0.32%) compared to the ADV+VC+PRE policy, at the expense of an increase in the latency violations, since the system is prohibited to scale in several cases to avoid data leakage attacks. DLeak-1,DLeak-3 parameter setups increase the number of violations without being able to decrease the number of data leakages. As we observe in Table 1, DLeak-2 keeps the number of active VMs lower than the DLeak-1 and DLeak-3 i.e. 11.7, which explains the decrease in the number of data leakages. This also is an indication that different parameter configurations can achieve different trade-offs but this needs to be performed carefully. Fig. 4 (right) presents an experiment where latency violation threshold becomes 50 msecs. The data leakages percentage is decreased in all the security enhanced policies, with DLeak-3 achieving the optimal tradeoff. In DLeak-3, the deviation of data leakages from their lower bound is reduced by 21% while the latency violations are slightly increased. In the second line of Table 1, the average number of active VMs in the DLeak-3, is bigger than the one from DLeak-2 achieving almost the same data leakages reduction albeit with a more significant increase in latency violations. In Fig. 5 the data leakage probability because of multi-tenancy is changed to 1%, hence the percentage of data leakage throughout the cluster ranges from 8% to 18% in a single step. As we observe, the data leakage percentage is reduced from 12.89% to 11.70% for the DLeak-2 with an increase in the latency violations (i.e. 14.56% from 0.44% achieved by ADV+VC+PRE policy), reaching a significantly better trade-off than DLeak-0. The mean number of the active VMs in DLeak-2 is reduced from 12.4 to 10.9, presented in Table 2. The parameter setups DLeak-1 and DLeak-3 achieve almost the same reduced percentage of data leakage attacks i.e. 12.2%, while DLeak-3 achieves
Fig. 6: Aggregated Latency Violations and Data Losses Percentage for 45 msecs (left) and 50 msecs (right) latency thresholds and rep = 2, pf = 1% ADV+VC+PRE DLoss-0 DLoss-1 DLoss-2 DLoss-3 45 msecs
12.4
8
12.3
11.7
12.4
50 msecs
12
8
11.8
11
11.9
Table 3: Average number of active VMs (r = 2, pf = 1%) lower latency violations number. When the latency violation threshold is changed to 50 msecs (see Figure 5 (right)) the same trend applies, with the exception of an increase in the data leakage attacks of the DLeak-3 compared to DLeak-2 parameter setup. As it is expected the average number of active VMs is reduced in all the cases between the 45 msecs and the 50 msecs latency thresholds (presented in Table 2). Finally, DLeak-2 achieves the most fair tradeoff between the data leakage attacks and the latency violations. Data Loss Results In this set of experiments, we also try to achieve an acceptable tradeoff between the latency violations and the occurrences of data losses due to machine failures. The failure probability of one machine is set to pf = 1%, while we run experiments for two values of replication factor i.e. r = 2 and r = 3 and two values of latency threshold, 45 and 50 msecs. The utility function presented in Section 2.2 is utilized, and similar parameter setups are examined: – – – –
DLoss-0: a = 100, b = 100, c = 1 DLoss-1: a = 0.5, b = 1, c = 1 DLoss-2: a = 100, b = 100, c = 160 DLoss-3: a = 100, b = 1000, c = 1600
Fig. 6 presents the results for pf = 1% and r = 2 for both 45 (left) and 50 (right) msecs latency thresholds. The data loss probability ranges from 0.28% for 8 VMs, up to 1.5% for 18 VMs. As we observe in the left figure, DLoss-0 achieves the minimum possible percentage of data losses i.e. 0.28%, with the cost of the highest observed latency violation percentage, i.e. 65.32% as it maintains the minimum number of VMs
ADV+VC+PRE DLoss-0 DLoss-1 DLoss-2 DLoss-3 45 msecs
12.5
10.5
12.3
11.9
12.4
50 msecs
12
10.8
11.9
11
11.9
Table 4: Average number of active VMs (r = 3, pf = 1%)
Fig. 7: Aggregated Latency Violations and Data Losses Percentage for 45 msecs (left) and 50 msecs (right) latency thresholds and rep = 3, pf = 1% (see Table 3). DLoss-1 and DLoss-2 obtain a good tradeoff reducing the data losses percentage up to 8.8% in absolute numbers. DLoss-3 is the less effective approach in this experiment. As we observe in Table 3, the amount of data loss incidents is correlated to the mean number of active VMs, as expected. Exactly the same trend is observed in the 50 msecs latency threshold experiments, shown in Fig. 6 (right). DLoss-2 reduces the data losses by 13%, while the latency violations are far less (i.e. 5.59%) than the maximum possible. (i.e. 61.29% see DLoss-0 in the same figure). As previously noted the same trend applies for the mean active VMs number, presented in the second line of Table 3. Next, we change the replication factor from r = 2 to r = 3 and repeat all the experiments. As the replication factor is increased, the data loss probability is reduced and ranges from 0.0056% for 8 VMs, up to 0.0816% for 18 VMs. Fig. 7 presents the results. As we observe in this figure, the DLoss-0 parameter setup behaves differently from all the previous experiments, as it achieves a tradeoff between the data losses and the latency violations, without keeping the amount of VMs to the lowest possible vale. As it is depicted in Table 4, the mean number of active VMs for the DLoss-0 is 10.5, which explains the results of Fig. 7. The change in the behavior is explained by the reduction in the probability of the data loss incident. As the probability is too low, even the small difference (i.e. 1/V M s) between the reward for the latency violation state (i.e. 100) and the reward for the no-attack no-violation state (i.e. 100 + 1/V M s) makes the difference and guides the system to avoid latency violations. Taking into account the highest latency violation percentage, which is 65%, DLoss-0 is able to reduce both the data losses and the latency violations for both 45 and 50 msecs latency violation thresholds. DLoss-3 in Fig. 7 (left) is not able to reduce the data losses as it utilizes almost the same mean number of VMs with the ADV+VC+PRE policy. In Fig.
7 (right), where the latency threshold is set to 50 msecs, all the policies reduce the data losses, while the Dloss-2 achieves the best tradeoff with mean number of VMs equal to 11 as depicted in Table 4. Generic Lessons A more thorough parameter analysis using also additional settings is left as future work. However, the lesson learnt from the above experiments is that the elasticity decision making approach along with the 3-parameter utility function in Sec. 2.2 provides a powerful tool for striking a balance between security and performance requirements. As a rule of thumb to be used by system administrators, we advocate setting the parameters a and b at the order of hundreds (2 orders of magnitude higher than the reward for the security incident) and the parameter c an order of magnitude higher than the maximum cluster size, in order to yield an effective approach in reaching a mid-way balance. Following this rule, our work can be applied in a real-world example, including the motivating one, given a desired threshold on performance and understanding of the maximum probability of occurrence of security-related events that can be tolerated. Our solution comes also with a clear interface with different cloud providers, various NoSQL databases and data leakage/loss reporting mechanisms [14] in order to provide a complete system, and, finally, it has very low running overhead.
4 Related Work The literature is rich with research efforts that consider security issues within the context of cloud computing. Recent initiatives mainly from the industry and government organisations such as ENISA and Cloud Security Alliance, have sought to produce a number of guidelines and methods to help in the selection of cloud providers as well as addressing some specific security concerns of the cloud. Yet such guidelines appear often too cumbersome with no clear indications as to when a CSP may be considered as not being trustworthy. This makes the valuable information detailed within these documents hard to exploit. Gong et al. [4] showed that using a side-channel attack, an attacker can instantiate new VMs of a target virtual machine so that the new VM can potentially monitor the cache hosted on the same physical machine . [7] identified four possible places where faults can occur in cloud computing: provider-inner, provider-across, provider user and user-across. Mulazzani et al. [13] showed that attackers can exploit data duplication techniques to access customer data by obtaining hash code of the stored file. Wenzel et al. [21] consider security and compliance analysis of outsourcing services in the cloud computing context. There are also works that focus on the development of model-based approaches to security analysis in cloud environments. A goal-drivel approach is introduced to analyse security risks of cloud based system [8]. Goals, threats and risks are consider from three main components: data, service/application, and technical and organisational measure. We have also contributed to this line of research with the development of a modelbased framework that enables elicitation, analysis of security and privacy requirements and selection of deployment models [9] and service providers [12] based on such requirements. These works provide important developments in analysing and modelling security in cloud computing but they do not take into account performance issues.
Our work is also related to proposals that deal with cloud elasticity to maintain specific performance characteristics. Tan et al. [19] combine cloud elasticity with anomaly prevention, which refers to the resource contention, software bugs or hardware failures. This proposal utilizes a prediction technique based on system metrics to vertically scale the resources of the VMs or to decide for VM migration, i.e. they consider different forms of elasticity, as is also the case in Shen et al. [18] and Gong et al. [5]. A work that indirectly solves MDP models utilizing reinforcement learning-based policies to guide elasticity appears in Tsoumakos et al. [20], which is extended in our previous performance-oriented work in [14]. Differently to our work which considers the same VM types, Hector et al. [3] and Qi et al. [22] deal with VM type heterogeneity issues. A significant number of proposals use rule-based techniques to guide the elasticity, e.g., Moore et al. [11] and Copil et al. [2]. In Copil et al. [2], a technique is proposed that addresses the implications of an elastic action across multiple dimensions, providing for example the cost implication of a horizontal scaling action. None of those techniques is accompanied by online probabilistic verification of elasticity properties. Finally, model checking and runtime quantitative verification for cloud solutions other than horizontal scaling has been proposed in Calinescu et al. [1] and Perez et al. [16]. The former, utilizes PRISM to guide service adaptation, while the latter presents a technique to predict the minimum cost of cloud deployments using PCTL over MDP models. In summary, to the best of our knowledge, our proposal is the first one that addresses the elasticity problem taking into account both performance and security issues.
5 Conclusions This work presents a novel approach, to support elasticity decisions for cloud databases, which considers both performance and security requirements. Since, these requirements are contradicting, we have developed a probabilistic model checking solution that accounts for user-defined trade-offs between them. As demonstrated by the experiments, our proposal is capable of striking a configurable balance between security-related incidents and performance degradation. We are working towards improving our approach towards the following directions. Additional utility functions can be investigated, along with further experimentation under different settings. Also, tackling data leakage and data loss concerns during elasticity solves only a part of the security problems in cloud databases. With a view to providing more holistic solutions, we aim to investigate model checking based techniques to help database owners decide the initial deployment of their systems on the cloud. Acknowledgments: This research has been co-financed by the European Union (European Social Fund - ESF) and Greek national funds through the Operational Program “Education and Lifelong Learning of the National Strategic Reference Framework (NSRF) - Research Funding Program: Thales. Investing in knowledge society through the European Social Fund.”
References 1. Calinescu, R., Grunske, L., Kwiatkowska, M., Mirandola, R., Tamburrelli, G.: Dynamic qos management and optimization in service-based systems. IEEE Trans. Software Eng. 37(3),
387–409 (2011) 2. Copil, G., Moldovan, D., Truong, H.L., Dustdar, S.: Multi-level elasticity control of cloud services. In: ICSOC. pp. 429–436 (2013) 3. Fernandez, H., Pierre, G., Kielmann, T.: Autoscaling web applications in heterogeneous cloud infrastructures. In: IC2E (2014) 4. Gong, C., Liu, J., Zhang, Q., Chen, H., Gong, Z.: The characteristics of cloud computing. In: Proceedings of the 2010 39th International Conference on Parallel Processing Workshops. pp. 275–279. ICPPW (2010) 5. Gong, Z., Gu, X., Wilkes, J.: Press: Predictive elastic resource scaling for cloud systems. In: CNSM. pp. 9–16 (2010) 6. Grispos, G., Glisson, W.B., Storer, T.: Using smartphones as a proxy for forensic evidence contained in cloud storage services. CoRR abs/1303.4078 (2013) 7. Grobauer, B., Walloschek, T., Stocker, E.: Understanding cloud computing vulnerabilities. IEEE Security and Privacy 9(2), 50–57 (2011) 8. Islam, S., Mouratidis, H., Kalloniatis, C., Hudic, A., Zechner, L.: Model based process to support security and privacy requirements engineering. IJSSE 3(3), 1–22 (2012) 9. Kalloniatis, C., Mouratidis, H., Islam, S.: Evaluating cloud deployment scenarios based on security and privacy requirements. Requir. Eng. 18(4), 299–319 (2013) 10. Kwiatkowska, M., Norman, G., Parker, D.: Prism: probabilistic model checking for performance and reliability analysis. SIGMETRICS 36(4), 40–45 (2009) 11. Moore, L., Bean, K., Ellahi, T.: A coordinated reactive and predictive approach to cloud elasticity. In: CLOUD COMPUTING. pp. 87–92 (2013) 12. Mouratidis, H., Islam, S., Kalloniatis, C., Gritzalis, S.: A framework to support selection of cloud providers based on security and privacy requirements. Journal of Systems and Software 86(9), 2276–2293 (2013) 13. Mulazzani, M., Schrittwieser, S., Leithner, M., Huber, M., Weippl, E.: Dark clouds on the horizon: Using cloud storage as attack vector and online slack space. In: USENIX Security Symposium (2011) 14. Naskos, A., Stachtiari, E., Gounaris, A., Katsaros, P., Tsoumakos, D., Konstantinou, I., Sioutas, S.: Dependable horizontal scaling based on probabilistic model checking. In: CCGrid. IEEE (2015) 15. Papadimitriou, P., Garcia-Molina, H.: Data leakage detection. Knowledge and Data Engineering, IEEE Transactions on 23(1), 51–63 (2011) 16. Perez-Palacin, D., Calinescu, R., Merseguer, J.: Log2cloud: Log-based prediction of costperformance trade-offs for cloud deployments. In: ACM SAC. pp. 397–404 (2013) 17. Puterman, M.L.: Markov Decision Processes: Discrete Stochastic Dynamic Programming. John Wiley & Sons, Inc. (1994) 18. Shen, Z., Subbiah, S., Gu, X., Wilkes, J.: Cloudscale: Elastic resource scaling for multitenant cloud systems. In: SOCC. pp. 5:1–5:14 (2011) 19. Tan, Y., Nguyen, H., Shen, Z., Gu, X., Venkatramani, C., Rajan, D.: Prepare: Predictive performance anomaly prevention for virtualized cloud systems. In: ICDCS. pp. 285–294 (2012) 20. Tsoumakos, D., Konstantinou, I., Boumpouka, C., Sioutas, S., Koziris, N.: Automated, elastic resource provisioning for nosql clusters using tiramola. In: CCGrid. pp. 34–41 (2013) 21. Wenzel, S., Wessel, C., Humberg, T., J¨urjens, J.: Securing processes for outsourcing into the cloud. In: 2nd International Conference on Cloud Computing and Services Science (April 2012) 22. Zhang, Q., Zhani, M.F., Boutaba, R., Hellerstein, J.L.: Harmony: Dynamic heterogeneityaware resource provisioning in the cloud. In: ICDCS. pp. 510–519 (2013)