Prior to ask what class of food is depicted in an image, a computer vision system should be able to distinguish between food vs non-food images. In this work we.
On the Exploitation of One Class Classification to Distinguish Food vs Non-Food Images G. M. Farinella, D. Allegra, F. Stanco, and S. Battiato Image Processing Laboratory Department of Mathematics and Computer Science University of Catania {gfarinella, allegra, fstanco, battiato}@dmi.unict.it
Abstract. In the last years automatic food image understanding has become an important research challenge for the society. This is because of the serious impact that food intake has in human life. Food recognition engines, can help the monitoring of the patient diet and his food intake habits. Nevertheless, distinguish among different classes of food is not the first question for assisted dietary monitoring systems. Prior to ask what class of food is depicted in an image, a computer vision system should be able to distinguish between food vs non-food images. In this work we consider one-class classification method to distinguish food vs non-food images. The UNICT-FD889 dataset is used for training purpose, whereas other two datasets of food and non-food images has been downloaded from Flickr to test the method. Taking into account previous works, we used Bag-of-Words representation considering different feature spaces to build the codebook. To give possibility to the community to work on the considered problem, the datasets used in our experiments are made publicly available.
Keywords: Food understanding, One Class Classification, Bag of Words.
1
Introduction and Motivation
Food has always influenced human lives and cultural development. It has a key role for health and market economy. The current technologies to acquire visual data (e.g., smartphones and wearable cameras) allow new possible applications in food domain. As example, a food intake monitoring can be useful when people have to be assisted during their daily meals. The collected data can help to understand the habits (or eating disorders) of a patient to prevent diseases like obesity or diabetes. An intake monitoring system could replace the traditionally dietary assessment based on self-reporting, which is often inaccurate [1, 2, 3, 4, 5, 6, 7, 8]. In the last years wearable system for diet monitoring has taken a role for the monitoring of food intake [9]. Considering wearable glasses cameras, the first capability to address for an automatic diet monitoring system is the recognition of the frames of the acquired videos related to food. A food vs non-food classifier can be use to create automatic food-log to discover the intake behaviour of a person. Food image understanding is important also for marketing purpose. A restaurant could provide a mobile software which processes a photo of food plate and reports several information such as cuisine type, the used ingredients, a list of other similar dishes or a video on how to cook that plate. Mobile apps can be
exploited to recommend a restaurant serving food similar to the one of a selected picture by making retrieval with respect the food images of a menu [10, 11]. Several works have been published on food image classification in the last years. Jim´enez et al. [12] proposed one of the first food classification pipeline. They proposed to detect spherical fruits in natural environment and to exploit data acquired with a 3D laser scanner for recognition purpose. Multiple Kernel Learning SVM (MKL-SVM) is investigated by Joutou et al. [13]. In [7] the authors proposed a food recognition system based on the Bag of Words model which uses color features (e.g., histrograms, color moments) and dense SIFT on color space (DSIFT). Rav`ı et al. [14] developed a real-time mobile system for hierarchical food classification, exploiting Fischer Vector representation and a set of linear classifiers. Matsuda et al. [15, 16] introduced a new dataset (UEC FOOD 100) with food images belonging to 100 classes. Other datasets are introduced in [11, 17]. Specifically, [17] introduced PFID dataset composed by 1098 fastfood images belonging to 61 different classes. In [11] the UNICT-FD889 dataset has been introduced. This dataset contains 3583 instances with over 800 food plates acquired with mobile devices in real meal scenario. All the works mentioned above perform recognition among different food classes and assume that the analyzed image contains food. However, to build food monitoring systems able to perform a food-log (e.g., with the use of wearable cameras) the discrimination between food vs non-food images is the first issue to address. In this paper we focus our attention on food vs non-food images classification. This problem has been taken into account in [18, 19]. In [18] Kitamura et al. presented a food-logging web system which consider food vs non-food problem to analyse the food intake balance and visualise a food log. Circle detection and color information are exploited as feature to identify the presence of dishes in images. However in real scenario not all the images of food include the plate. Moreover the shape of the plates can be different from a plate to another. Kagaya et al. [19] used deep learning for food detection and recognition. As in [18], to perform a proper training of the method proposed in [19] both food images and non-food ones have to be employed. This means that to train a food vs non-food classifier, the variability of the non-food classes have to be captured in dataset used for training purpose. Despite could be simple to collect images of food (e.g., by considering the current available food datasets or by crawling images from website dedicated to food1 ), the collection of a proper representative dataset of non-food images can be a challenging task. Differently than previous works, in this paper we investigate one-class classification (OCC)[20] to recognize when an image is belonging to the food class. Multi-class classification methods, such as the ones proposed in the aforementioned works, aim to classify an unknown image into one of several predefined categories (two classes in case of food vs non-food classification). One-class classification approaches allow to obtain a model of a single class, so the images that do not fit the model are labeled as an “anomaly” with respect to that class. In this paper, the Bag of Words model is employed to represent images. Three different descriptors are compared: Texton, SIFT and PRICoLBP. One-class classification is performed by using one-class Support Vector Machine (OSVM). To learn about the food class we have used the UNICT-FD889 dataset, since it presents variability and because the images 1
https://www.flickr.com/groups/foodphotography/
are collected in real meal scenario with a mobile phone. We also used two more datasets for testing purpose which can be employed as benchmark to compare food vs non-food classification algorithms. The reminder of the paper is organized as follows. In Section 2 the proposed approach for food vs non-food recognition is described. Section 3 reports the experimental results. Finally, Section 4 concludes the paper providing hints for future works.
2
Proposed Method
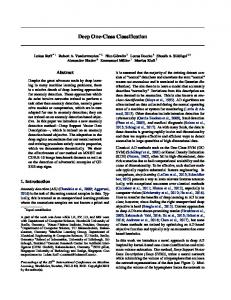
We consider the one-class classification paradigm (OCC) for food vs non-food classification problem [20, 21]. One-class classification algorithms learns about the class to be identified assuming that representative training data of all the other possible classes are not available or very difficult to obtain. We consider this paradigm for food vs non-food classification since in a training phase could be simple to have example of what a food image looks like, but it is very difficult to define all the images related to the non-food class. If one considers the problem of detecting food frames in videos acquired with wearable glasses, the non-food class is composed by all the possible scene that a human can observe in his life. This motivated us to perform a benchmark experiment where the unique class to be used for learning purpose is the food one. As training data to represent the food space we have used the UNICT-FD889 dataset introduced in [11]. It contains 3583 food images related to 889 different plates acquired with an iPhone in real scenarios during meals. Some examples of the images belonging to the UNICTFD889 are shown at the first three rows of Fig. 1. To test the discriminative capability of the approach, two more datasets of food and non-food images, respectively composed by 4805 and 8005 images, have been considered. The images of the two dataset used for testing have been downloaded from Flickr (see Fig. 1) by considering only images acquired with an iPhone at their original resolution. We employed three different image descriptors as baseline for our experiments: Bag of SIFT [22, 23], PRICoLBP [24] and Bag of Textons [11, 25]. For Bag of SIFT we have considered a dense sampling on a grid with spacing of 8 pixels. For each grid point a 16 × 16 patch is extracted and SIFT descriptor is computed consider the color domain as in [7]. The codebook to be used for a Bag of SIFT representation has been obtained through K-Means clustering with K = 2200. To obtain the gray and color PRICoLBP representations [24] we used the original code provided by the authors at URL http://qixianbiao.github.io. With the original parameters PRICoLBP representation is a 1180-dimensional vector for gray whereas 3540-dimensional vector for RGB images. To compute the Bag of Textons representation [11, 25] we considered both the MR8 and the Schmid bank of filters. We considered Textons in both gray and LAB color domains. Also in this case we used a vocabulary of 2200 Textons to represent images.
3
Experimental Settings and Results
We have performed two experiments to assess the performances of the SVM One Class Classification with the considered descriptors. In all the experiments we employed the LibSVM library [26] with a Sigmoid kernel with γ = 10−5 and an OSVM tolerance ν = 0.35. In the first experiment we have considered the UNICT-FD889 dataset for training the OSVM classifier. Tests have been repeated three times and the results are obtained by averaging on the three runs. For the training phase the
Fig. 1. Top: UNICT-FD889 image examples. Middle: examples of non-food images downloaded from Flickr. Bottom: examples of food images downloaded from Flickr.
UNICT-FD889 dataset has been divided in three parts. For each run two parts of the dataset (2855 food images) have been used for training the classifier. The remaining 728 food images have been used for testing purpose. To test the performances on the non-food class in each run we have used the 8005 images downloaded from Flickr. The results obtained in this first experiment are shown in Fig 2(a). Food classification rate is similar for all representations, while non-food classification rate is strongly dependent from the descriptor, and varies between 26.21% and 94.44%. As in [11], Textons outperform PRICoLBP (PLBP). Moreover, the Schmid bank of filters (LABSch) seems to outperform MR8 filters. The best performances are obtained when the Bag of SIFT representation (BoS) is employed. Color domain helps all the descriptors except PRICoLBP. Since SIFT and Textons capture different image’s aspects (i.e., SIFT summarises spatial histograms of gradients, whereas Textons encode textures) we have tested a simple concatenation of Bag of SIFT and Bag of Textons. This test shows an improvement in the discrimination capability (94.44% for non-food and 65.43% for food). The achieved results encourage the usage of multiple descriptors to have a low false positive rate (i.e., very few images of non-food class misclassified as food). Some example of misclassified images are shown in Fig 3. As last test we have concatenated Bag of Schmid Textons, Bag of SIFT and PRICoLBP (all obtained considering color domain). The results confirm that PRICoLBP do not add useful information for food vs non-food classification (Fig. 2(a)). In the second experiment we used the whole UNICT-FD889 dataset to perform training (3583 images). For testing purpose we have used the same dataset of non-food images employed for the first experiment (8005 images) and one more food dataset (4805 images) obtained from Flickr by downloading (and visually reviewing) images with the tag “food”. This experiment is more challenging than the first one since the food images used in the training and the once used in the testing phases look very different. Despite the Flickr images with “food” tag
r PLBP ,83% ,29% ,42% ,06%
LABMR8 GrayMR8 Color PLBP 66,16% 64,93% 63,83% 82,44% 79,75% 26,29% 81,08% 78,51% 29,42% 74,30% 72,34% 45,06%
Food Positive Rate Non-Food Positive Rate Accuracy Per Class accuracy
Gray PLBP 64,15% 27,06% 30,15% 45,61%
BoS BoS+LMr8 GraySch 63,28% 63,60% 64,15% 91,24% 93,21% 79,30% 88,91% 90,74% 78,04% 77,26% 78,40% 71,73%
LABSch LABSch+BoS LABSch+BoS+PLBP 63,32% 65,43% 63,78% 86,74% 94,44% 30,58% 84,79% 92,02% 33,34% 75,03% 79,93% 47,18%
100,00%
100,00%
90,00%
90,00%
80,00%
LABMR8 25,49% 92,04% 67,08% 58,77%
BoS BoS 37,75% 85,03% 67,30% 61,39%
80,00%
70,00%
70,00%
60,00% 50,00%
Food - True Positive
40,00%
Non-Food True Negative
30,00%
Accuracy
20,00%
Per-Class Accuracy
10,00%
60,00% 50,00% 40,00% 30,00% 20,00%
0,00%
10,00%
Gray PLBP 64,15% 27,06% 30,15% 45,61%
BoS BoS+LMr8 GraySch 63,28% 63,60% 64,15% 91,24% 93,21% 79,30% 88,91% 90,74% 78,04% 77,26% 78,40% 71,73%
LABSch LABSch+BoS LABSch+BoS+PLBP 63,32% 65,43% 63,78% 86,74% 94,44% 30,58% 84,79% 92,02% 33,34% 75,03% 79,93% 47,18%
LABMR8 BoS BoS+LABMR8 LABSch. BoS+LABSch 25,49% 37,75% 28,95% 43,20% 28,57% 92,04% 85,03% 93,20% 85,00% 95,07% 67,08% 67,30% 69,10% 69,32% 70,12% (a)58,77% Results61,39% of the first 61,08%experiment. 64,10% 61,82%
0,00%
100,00% 90,00% 80,00% 70,00% Food Positive Rate Non-Food Positive Rate Accuracy Per Class accuracy
60,00%
Food - True Positive
50,00%
Non-Food -True Negative Accuracy
40,00%
Per-Class Accuracy
30,00% 20,00% 10,00% 0,00% LABMR8
BoS
BoS+LABMR8
LABSch.
BoS+LABSch
(b) Results of the second experiment. Fig. 2. Food vs Non-Food classification results.
are related to images containing food, these can contain also other objects not belonging to the food class (e.g., sometime the percentage of the pixels related to food are much less than the once of the background and other objects). There is also a huge variability in the scale of the food plates, as well as photometric variability, and there are examples of dishes which never appear into the training dataset. In this experiment we considered only Textons and SIFT descriptors on color domain since they obtained the best performances in the first experiments. The results obtained in this second experiment are shown in Fig 2(b). Also in this case seems that combination of the descriptors can help for the task under consideration. We report some examples of misclassified images in Fig. 4. We would highlight once more that in our experiments images of non-food class have not been used for training the classifier. Considering the results of the two experiments, it is clear that by learning from the food class only it is possible to achieve low false positive rate for food vs non-food classification already with simple image representations. This means that in a possible wearable systems for food monitoring which have to automatically collect food images there will be few outlier to be manually removed by nutrition experts. Note that the trade-off between good true positive rate and low false positive rate can be tuned by the
LABMR8
BoS
BoS+LABMR8
(a) Images of food classified as non-food.
(b) Images of non-food classified as food. Fig. 3. Some misclassification examples for (a) food class and (b) non-food class related to the first experiment.
(a) Images of food classified as non-food.
(b) Images of non-food classified as food. Fig. 4. Some misclassification examples for (a) food class and (b) non-food class related to the second experiment.
parameters used in one class classification. On the other hand, the classification accuracy of the food class is still to low to be considered useful to monitor the food intake and the behaviour of a person. By considering the two experiments the main observation with respect to this last aspect is that, when the food class to be recognized is represented in the training, the food classification performance is higher (i.e., when images of food used for testing are visually similar to the once in the training, despite high geometric and photometric variabilities). Also, the combination of different features can contribute to have a better discrimination. Our conjecture for food vs non-food classification is that by considering a big representative food image dataset, where the food dishes appear in a appropriate scale (i.e., the food plate is the main or the only object, as usually occurs when a user snap a food during meals), and by considering appropriate image representation, the food vs non-food classification become a feasible task. One more consideration made from the outcome of the experiments is related to the description level to consider the task about of food vs non food classification. Sometime in literature this problem has been called food detection [19]. We believe that food detection and food vs non-food classification are two different tasks. As demonstrated by the second experiment, when images contain food but also background and other objects, the food vs non-food classification become more difficult. This is mainly because the whole image is considered during food
vs non-food classification. On the other hand, a food detector have to be able to localize where the food appears rather than classify the whole image (i.e., draw a bounding box in the part of the image in which the food appear discarding the other parts). The benchmark datasets used in our experiments (as well as the training and testing information needed to properly compare other approaches on the problem considered in this paper) are available at the following link: http://iplab.dmi.unict.it/madima2015/
4
Conclusion
Food understanding is an interesting challenge for the computer vision research community and it is demanded to build food intake monitoring systems. Although different progress have been done in recent years regarding multiclass food classification, food vs non-food classification is still the first problem to solve. We believe that this task is different from food detection where the main aim is to localize the region of the image containing pixels of food. In this work we focus our attention on the application of One Class Classification method to distinguish food images vs other classes. The motivation beyond the exploration of this method comes from the consideration that the non-food class is very difficult to be represented in a dataset if one consider a system that have to work for example on wearable glasses. The preliminary experiments presented in this paper gave us some hints for further research directions, such as for example the need to better define the food vs non-food problem considering the context where the system have to be employed. We guess that augmenting the food dataset, the one class classification approach can achieve better results. Further studies should also consider more complex approaches to extract features (e.g., in an unsupervised way with Deep Learning based approaches [19, 27]), and to combine and represent the images (e.g., using also spatial information) for the considered one class classification task.
References [1] F. Kong and J. Tan. Dietcam: Automatic dietary assessment with mobile camera phones. Pervasive and Mobile Computing, 8(1):147–163, 2012. [2] S. Kim, T. Schap, M. Bosch, R. Maciejewski, E. J. Delp, D. S. Ebert, and C. J. Boushey. Development of a mobile user interface for image-based dietary assessment. In International Conference on Mobile and Ubiquitous Multimedia, pages 13:1–13:7, 2010. [3] Feasibility testing of an automated image-capture method to aid dietary recall. [4] C. Xu, Y. He, N. Khannan, A. Parra, C. Boushey, and E. Delp. Image-based food volume estimation. In International Workshop on Multimedia for Cooking and Eating Activities, pages 75–80, 2013. [5] F. Zhu, M. Bosch, I. Woo, S. Kim, C. J. Boushey, D. S. Ebert, and E. J. Delp. The use of mobile devices in aiding dietary assessment and evaluation. Journal of Selected Topics Signal Processing, 4(4):756–766, 2010. [6] G. O’Loughlin, S. J. Cullen, A. McGoldrick, S. O’Connor, R. Blain, S. O’Malley, and G. D. Warrington. Using a wearable camera to increase the accuracy of dietary analysis. American Journal of Preventive Medicine, 44(3):297–301, 2013. [7] M.M. Anthimopoulos, L. Gianola, L. Scarnato, P. Diem, and S.G. Mougiakakou. A food recognition system for diabetic patients based on an optimized bag-offeatures model. IEEE Journal of Biomedical and Health Informatics, 18(4):1261– 1271, 2014.
[8] M. Puri, Z. Zhiwei, Y. Qian, A. Divakaran, and H. Sawhney. Recognition and volume estimation of food intake using a mobile device. In Workshop on Applications of Computer Vision, pages 1–8, 2009. [9] J. M. Fontana and E. Sazonon. Detection and characterization of food intake by wearable sensors. In Wearable Sensors, pages 591–616. 2014. [10] O. Beijbom, N. Joshi, D. Morris, S. Saponas, and S. Khullar. Menu-match: Restaurant-specific food logging from images. In IEEE Winter Conference on Applications of Computer Vision, pages 844–851, 2015. [11] G. M. Farinella, D. Allegra, and F. Stanco. A benchmark dataset to study the representation of food images. In International Workshop on Assistive Computer Vision and Robotics (ACVR) in conjunction with ECCV, 2014. [12] A. R. Jim´enez, A. K. Jain, R. C. Ruz, and J. L. P. Rovira. Automatic fruit recognition: a survey and new results using range/attenuation images. Pattern Recognition, 32(10):1719–1736, 1999. [13] T. Joutou and K. Yanai. A food image recognition system with multiple kernel learning. In IEEE International Conference in Image Processing, pages 285–288, 2009. [14] D. Rav`ı, B. Lo, and G.F Yang. Real-time food intake classification and energy expenditure estimation on a mobile device. In Body Sensor Networks Conference, 2015. [15] Y. Matsuda, H. Hoashi, and K. Yanai. Recognition of multiple-food images by detecting candidate regions. In IEEE International Conference on Multimedia and Expo, pages 25–30, 2012. [16] Y. Matsuda and K. Yanai. Multiple-food recognition considering co-occurrence employing manifold ranking. In International Conference on Pattern Recognition, pages 2017–2020, 2012. [17] M. Chen, K. Dhingra, W. Wu, L. Yang, R. Sukthankar, and J. Yang. Pfid: Pittsburgh fast-food image dataset. In IEEE International Conference on Image Processing, 2009. [18] K. Kitamura, T. Yamasaki, and K. Aizawa. Foodlog: Capture, analysis and retrieval of personal food images via web. In Proceedings of the Workshop on Multimedia for Cooking and Eating Activities, pages 23–30, 2009. [19] H. Kagaya, K. Aizawa, and M. Ogawa. Food detection and recognition using convolutional neural network. In Proceedings of the ACM International Conference on Multimedia, pages 1085–1088, 2014. [20] S. S. Khan and M. G. Madden. A survey of recent trends in one class classification. In Irish Conference on Artificial Intelligence and Cognitive Science, pages 188– 197, 2010. [21] B. Sch¨ olkopf, J. C. Platt, J. C. Shawe-Taylor, A. J. Smola, and R. C. Williamson. Estimating the support of a high-dimensional distribution. Neural Computation, 13(7):1443–1471, 2001. [22] D. G. Lowe. Object recognition from local scale-invariant features. In IEEE International Conference on Computer Vision, volume 2, pages 1150–1157, 1999. [23] D. G. Lowe. Distinctive image features from scale-invariant keypoints. International Journal of Computer Vision, 60(2):91–110, 2004. [24] X. Qi, R. Xiao, J. Guo, and L. Zhang. Pairwise rotation invariant co-occurrence local binary pattern. In European Conference on Computer Vision, volume 7577, pages 158–171, 2012. [25] G. M. Farinella, M. Moltisanti, and S. Battiato. Classifying food images represented as bag of textons. In IEEE International Conference on Image Processing, pages 5212 – 5216, 2014. [26] Chih-Chung Chang and Chih-Jen Lin. LIBSVM: a library for support vector machines, 2001. [27] Y. LeCun, Y. Bengio, and G. Hinton. Deep learning. Nature, 512, 2015.