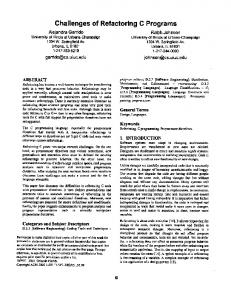
Languages such as Java, C++ and C# have become languages of choice in many domains due to their object oriented nature. Object oriented programs are rich ...
On the Object Orientedness of C++ programs in SPEC CPU 2006 Ciji Isen and Lizy John Department of Electrical and Computer Engineering University of Texas at Austin {isen,ljohn}@ece.utexas.edu
1. Introduction Languages such as Java, C++ and C# have become languages of choice in many domains due to their object oriented nature. Object oriented programs are rich with features that reduce the programmer effort and increase manageability of code by encouraging modularity. One key feature that helps in this is polymorphism. Modern languages include dynamically-dispatched function calls (i.e. virtual functions) to support polymorphism. The targets of these functions are not known until run-time because they depend on the dynamic type of the object on which the function is called. The instruction set architecture uses indirect branches and calls to implement these function calls. In general it is expected that object oriented programs will lead to an increase in control flow, particularly in the percent of indirect branches which are considered difficult to predict by past research [6, 10, 11]. Over the years SPEC CPU benchmark suites have included more and more C++ programs. In SPEC CPU 2006, there are three C++ integer benchmarks and four floating-point C++ benchmarks (a total of 7 benchmarks). In comparison SPEC CPU2000 has only one C++ benchmark - 252.eon. In this context we consider two questions of interest: 1) How object oriented are the C++ programs in SPEC CPU 2006? How do they compare to other object oriented benchmarks? 2) How different is the control flow of C++ programs in SPEC CPU2006 compared to the rest of the suite? Not all C++ programs have similar degree of object oriented nature. The multitude of code standards and ambiguities in the standard makes inclusion of C++ code in the benchmarks difficult. This fact is highlighted by Wong [8] who analyzed the C++ benchmarks in SPEC CPU 2006 at the source code level. The analysis gives a good overview of the programs covering the code composition, construction and libraries used. It highlights the fact that SPEC CPU2006 has not taken the lowest common denominator of C++ style for ease of portability but rather has tried to include a spectrum of C++ code ranging from basic inheritance to generic programming to template programming. Table 1 summarizes the C++ programs in SPEC CPU2006. The study observes that 473.astar, 444.namd and 450.soplex are light in its use of object oriented features. While Wong [8] commented on the object orientedness of the benchmark no quantifiable metrics are used. To address the first question we raised previously, we will use complexity of the code as a means to measure and compare the object oriented nature of SPEC CPU’s C++ programs and other object oriented programs. We will measure the code complexity, code structure, objectoriented features, class hierarchies, etc using the popular Chidamber and Kemerer (C-K) metrics [2]. We will also measure these object oriented features for some of the Java benchmarks(SPEC jvm98 and SPEC jbb2000) and compare them to the C++ programs in SPEC CPU2006. Further more we analyze the impact the object oriented nature of C++ programs has on the control flow characteristics of the code. This should help us address the second question.
1
Benchmark 471.omnetpp
Files 155
Lines 47,910
Symbols 1,428
473.astar 483.xlanackbmk
20 1773
5,849 553,643
176 10,426
444.namd 447.dealII
33 452
5,322 198,649
410 4,801
450.soplex 453.povray
124 210
41,435 155,170
195 6,761
Comments It will encourage the OS to speed up malloc and may encourage optimizers to perform malloc optimization. It makes very little use of C++ features A large e-business app that also uses STL with very large data input set. It will push most stack memory to the limit while encouraging malloc improvement. A good HPC benchmark but somewhat simple Uses Boost libraries and complex template techniques. Best representative of future C++ directions. Not very high on usage of C++ features. It is representative of C++ the way it is used currently. Has potential single hot spot in the noise function.
Table 1: Summary of C++ programs in SPEC CPU 2006[8] The rest of the paper is organized as follows. Section 2 will introduce our measurement and analysis methodology. Section 3 will analyze the C++ programs for their object oriented nature and go on to contrast them with other object oriented benchmarks (Java). The fourth section deals with the analysis of what difference we observe in the control flow due to object oriented programming. Our concluding discussion is present in section 5.
2. Methodology 2.1 Measurements In this study we use the 12 integer and 17 floating point programs of the SPEC CPU 2006[9] benchmark suite. We also use two Java benchmarks, SPEC jvm98 and SPECjbb 2000, to compare the object oriented nature of the C++ benchmarks. The performance and impact of control flow is measured using corresponding performance counter events on two different processors - a POWER5+ and Woodcrest microprocessor. Both POWER5+ and Woodcrest microprocessors provide on-chip logic to monitor processor related performance events. The POWER5+ Performance Monitor Unit (Unit) contains two dedicated registers that count instructions completed and total cycles as well as four programmable registers which can count more than 300 hardware events occurring in the processor or memory system. The Woodcrest architecture has a similar set of registers, two dedicated and two programmable registers. These registers can count various performance events such as cache misses, TLB misses, instruction types, branch miss-prediction etc. The perfex utility from the Perfctr tool is used to perform the counter measurements on Woodcrest. A tool from IBM was used for making the measurements on POWER5+. The Intel Woodcrest processor supports both 32 bit as well as 64bit binaries. The data we present for Woodcrest corresponds to the best runtime for each benchmark (hence is a mix of 64-bit and 32 bit applications). Except for gcc, gobmk, omnetpp, xalancbmk and soplex, all other programs were in the 64bit mode. The benchmarks for POWER5+ where compiled using Compilers: XL FORTRAN Enterprise Edition 10.01 for AIX and XL C/C++ Enterprise Edition 8.0 for AIX. The POWER5+ binaries where compiled using the flags: C/C++ -O5 -qlargepage -qipa=noobject D_ILS_MACROS -qalias=noansi -qalloca + PDF (-qpdf1/-qpdf2) FP - O5 -qlargepage qsmallstack=dynlenonheap -qalias=nostd + PDF (-qpdf1/-qpdf2). The OS used was AIX 5L V5.3 TL05.The benchmarks on Woodcrest where compiled using Intel’s compilers - Intel(R) C Compiler for 32-bit applications/ EM64T-based applications Version 9.1 and Intel(R) Fortran
2
Compiler for 32-bit applications/ EM64T-based applications, Version 9.1. The binaries where compiled using the flag: -xP -O3 -ipo -no-prec-div / -prof-gen -prof-use. Woodcrest was configured to run using SUSE LINUX 10.1 (X86-64).
2.2 Principal Component Analysis and Clustering In order to understand the similarity/dissimilarity between C++, non-C++ and Java programs, we use Principal Component Analysis (PCA) and clustering [4, 5]. PCA is a multivariate statistical technique that reduces a large N-dimensional space into a lower dimensional uncorrelated space with very little loss of information. In order to isolate the effect of varying ranges of each parameter, the data is first normalized to a unit normal distribution, i.e. a normal distribution with mean equal to zero and standard deviation equal to 1, for each variable. PCA helps to reduce the dimensionality of a data set while retaining most of the original information. PCA computes new variables, so-called principal components, which are linear combinations of the original variables, such that all the principal components are uncorrelated. PCA transforms p variables X1, X2,...., Xp into p principal components (PC) Z1,Z2,…,Zp such that: p
Zi = ∑j =0 aij X j This transformation has the property Var [Z1] ≥ Var [Z2] ≥…≥ Var [Zp] which means that Z1 contains the most information and Zp the least. Given this property of decreasing variance of the PCs, we can remove the components with the lower values of variance from the analysis. This reduces the dimensionality of the data set while controlling the amount of information that is lost. We use a standard technique (Kaiser Criterion) to choose PCs where only the top few PCs which have eigenvalues greater than or equal to one are retained. For details on PCA please refer to [3]. After PCA, the workload space is projected using the most important principal components, or linkage distance between the programs is computed.
3. How object oriented are the C++ programs in CPU2006? We will use complexity of the code as a means to measure and compare the object oriented nature of SPEC CPU’s C++ programs and other object oriented programs. We will measure the code complexity, code structure, object-oriented features, class hierarchies, etc using the popular Chidamber and Kemerer (C-K) metrics [2].
3.1 Code Complexity Metrics – C-K metric Chidamber and Kemerrer [2] proposed several object oriented programming metrics in order to quantify code complexity. These metrics include Depth of Inheritance tree, number of children, coupling between classes, etc. We use the software package ckjm [7] and CCCC[12] to measure these metrics. As in prior work [1], the libraries are excluded from the analysis as they are heavily duplicated across the benchmarks. These metrics are described in short as follows. WMC (Weighted Methods per Class): WMC for a given program is measured by adding complexity of a program’s methods. Ckjm assigns a complexity value of 1 to each method, and therefore the WMC value is equal to the number of declared methods in the loaded classes. Large
3
numbers thus show that a class provides a variety of different behaviors in the form of different methods/functions. DIT (Depth of Inheritance Tree): DIT provides for each class a measure of the inheritance levels from the top of the object hierarchy. In Java where all classes inherit object the minimum value of DIT is 1. NOC (Number of Children): NOC measures the number of immediate subclasses of the class. CBO (Coupling Between Objects): For a given class CBO measures the number of classes coupled to a given class. Classes may be coupled via method calls, field accesses, inheritance, arguments, return types, and exceptions. The metric measures code complexity in terms of interactions between objects and classes. RFC (Response for a Class): RFC measures the number of different methods that may execute when a method is invoked. Ckjm calculates a rough approximation to the response set by inspecting method calls within the class’s method bodies.
3.2 Object orientedness: C++ benchmarks in SPEC CPU 2006 We present the C-K metrics data for the C++ programs in SPEC CPU 2006 in Table 2. We can see that both astar and namd have low method per class count (WMC) - 85 and 48 respectively. It is interesting to note from Table 1 that they also have the lowest number of files in code, 20 & 33, compared to the others which have 100s of files. These two programs are low in other metrics like DIT, NOC, CBO and RFC. It seems that namd which has the lowest value for all the 5 metrics is the least object oriented of the 7 programs. Thus both namd and astar have very low object oriented nature. This seems to agree with the empirical observation made by Wong [8]. The benchmarks commented to be low in object orientedness by Wong [8] are marked by a darker background. Benchmarks SPEC cpu ’06 – C++
WMC
DIT
NOC
CBO
RFC
471.omnetpp 473.astar 483.xlanackbmk 444.namd 447.dealII 450.soplex 453.povray MIN MAX AVG
463 85 7219 48 1163 685 1743 48 7219 1629.43
28 0 3 0 6 1 0 0 28 5.43
24 0 3 0 6 1 0 0 24 4.86
106 50 3686 36 788 268 134 36 3686 724.00
569 135 10905 84 1951 953 1877 84 10905 2353.43
Table 2: C-K metrics for C++ programs in SPEC CPU 2006 To better analyze the data in Table 2 we visualize it using PCA. The first two principle components make up for 98% of the variance and scatter plot of the two PCs is constructed in Figure 1. We note that xalanckbmk and omnetpp are distinctly different from the other benchmarks. Four of the seven benchmarks are clustered together (marked by the red box in Fig 1). Although dealII is not as far removed from this cluster as xalanckbmk and omnetpp are, it is also not part of the cluster. Since the cluster includes both namd and astar the other two programs in the cluster, soplex and povray, could be considered to be similar to namd and astar in their object oriented nature i.e. low object orientedness.
4
Fig 1. PC scatter plot of C-K metrics for C++ programs in SPEC CPU 2006
3.3 Object orientedness: C++ benchmarks vs. Java benchmarks Benchmark
WMC
DIT
NOC
CBO
RFC
SPEC 201.compress
154
19
0
55
426
202.jess
614
97
1
632
1846
205.raytrace
330
33
3
117
743
209.db
152
12
0
42
454 3293
213.javac
1011
186
38
1175
222.mpegaudio
367
40
0
167
796
227.mtrt
332
33
3
117
743
228.jack
375
46
0
163
860
pseudojbb
541
35
0
254
1419
Min
152
12
0
42
426
Max
1011
186
38
1175
3293
Avg
430.67
55.67
5.00
302.44
1175.56
Table 3: C-K metrics for Java benchmarks It of interest to find out how the C++ benchmarks stack up against other common Java benchmarks in terms of object oriented features. To perform this comparison we collect C-K metrics for SPEC jvm98 as well as SPEC jbb2000. This data is presented in table 3. Among these benchmarks we see that 213.javac stands out with the highest value for all the 5 metrics. Among the C++ benchmarks presented in Table 2 we can see that xalancbmk has the highest value for 3 of the 5 metrics. It is difficult to compare these two sets (C++ and java benchmarks) purely based on the numbers and so we resort to visualizing it using PCA. The PCA scatter plot of two of the
5
principle components (PCs) that account for 90% of the variance is sketched in Figure 2. The C++ programs are represented by the dark circles while the java benchmarks are represented by the triangles. The PC plot shows xalancbmk and 213.javac as being distinct compared to the other benchmarks. All the other C++ and Java benchmarks are clustered together in the top right corner of the plot indicating the relative similarity between them. Over all we infer that the C++ programs in SPEC CPU 2006 are at least as object oriented as SPEC jvm98 and SPEC jbb2000 benchmarks. A similar analysis can be done for other benchmarks like the DaCapo java benchmark [1]. The DaCapo benchmark is known to be significantly more complex[1] compared to the other SPEC java benchmarks. In other words a PC scatter plot like Figure 2 with DaCapo and the other Java benchmarks would show the SPEC Java benchmarks being clustered together due to the larger complexity of DaCapo. Thus, due to the complexity of DaCapo, the SPEC C++ programs would be dwarfed and a comparison with it would not be very informative. So in this study we have not included such an analysis.
Fig 2. PC scatter plot of C-K metrics of Java benchmarks.
4. Control flow characteristics of C++ programs Various object oriented properties are expected to affect the programs impact on the microarchitecture by changing the control flow characteristics. In this section we use data collected from a Woodcrest processor to determine such an impact. First we consider the branch composition i.e. the type of branches, in C++ benchmarks compared to the others. Table 4 presents the percentage of branches and the type of branches. Branches are grouped as conditional branches (CND), function returns (RET), function calls (CALL) and indirect branches (IND). The most striking fact about the integer C++ benchmark is the lack of
6
significant difference in the percentage of branches compared to the non-C++ benchmarks. The non-C++ integer programs had an average of 18.34% branches while C++ integer programs have 21.13% branches. Among floating point benchmarks we see a stronger influence of the C++ nature of the code. Three out of the 4 C++ floating-point programs, dealII, soplex and povray, have a branch percentage higher than 14%. This is significantly higher than most of the other floating-point programs. The non-C++ FP programs have an average of 3.82% branches compared to the C++ FP programs with 13.2% branches.
Fig 3. (a) Integer - PC scatter plot of branch types. It is expected that object oriented programs would increase the percentage of function calls and indirect branches. We look for this behavior in the data we collected. In table 4 we see that the percentage of indirect branches is not significantly different for C++ benchmarks. 447.dealII is an exception with 7% of the branches being indirect branches. The percentage of returns and calls demonstrate a better distinction between C++ and non C++ programs in some of the cases. For example 483.xalancbmk has 6.5% and 6.3% return and call branches which is higher than the other non-C++ programs. Although some of the C++ programs have such a distinction there is a lack of consistency. Some of the C++ programs have a very low percentage of indirect branches, return branches and call branches. 471.omnetpp, 483.xalancbmk and 447.dealII have a higher percentage of return branches, call branches and indirect branches. This agrees well with our observation from Section 3.2 where these three programs where found to have the most object oriented behavior. Among the floating point C++ benchmarks the percentage of branch instructions is clearly higher than that of the other floating point programs. It seems object oriented nature has increased the amount of control flow activity in floating point programs using object oriented nature. The same observation doesn’t hold true for integer programs. This is probably because floating point programs are typically low in the percentage of branches and object oriented programming caused an increase in branch percentage to the level of integer
7
benchmarks. Although object oriented programming has increased branches such as calls, returns and indirect branches as a percentage of the number of branch instructions this increase is not as significant when compared to the total number of instructions. BENCHMARK
% Branch Inst
% RET Br per BR inst
% CALL Br
per Inst
per BR inst
per Inst
% CND Br per BR inst
per Inst
% IND Br per BR inst
per Inst
400.perlbench
23.27%
3.47%
0.81%
3.41%
0.79%
84.94%
19.76%
1.96%
0.46%
401.bzip2
15.29%
1.91%
0.29%
1.84%
0.28%
87.83%
13.43%
0.06%
0.01%
403.gcc
21.92%
3.53%
0.77%
3.99%
0.87%
85.60%
18.77%
0.84%
0.18%
429.mcf
19.23%
0.20%
0.04%
0.20%
0.04%
94.36%
18.15%
0.00%
0.00%
445.gobmk
20.75%
2.50%
0.52%
2.78%
0.58%
87.72%
18.20%
0.04%
0.01%
456.hmmer
8.37%
0.32%
0.03%
0.31%
0.03%
98.69%
8.26%
0.30%
0.03%
458.sjeng
21.41%
2.83%
0.61%
2.87%
0.62%
83.89%
17.96%
3.03%
0.65%
462.libquantum
27.26%
0.19%
0.05%
0.20%
0.05%
95.73%
26.10%
0.19%
0.05%
7.54%
2.84%
0.21%
2.88%
0.22%
88.12%
6.65%
0.73%
0.05%
18.34%
1.98%
0.37%
2.05%
0.39%
89.65%
16.36%
0.79%
0.16%
464.h264ref Avg INT – C++ 471.omnetpp
20.68%
5.64%
1.17%
5.60%
1.16%
81.62%
16.88%
1.47%
0.30%
473.astar
17.07%
0.04%
0.01%
0.04%
0.01%
96.84%
16.53%
0.01%
0.00%
483.xalancbmk
25.65%
6.43%
1.65%
6.34%
1.63%
82.62%
21.19%
3.74%
0.96%
Avg
21.13%
4.04%
0.94%
3.99%
0.93%
87.03%
18.20%
1.74%
0.42%
FP 410.bwaves
0.70%
2.50%
0.02%
2.50%
0.02%
92.70%
0.65%
0.00%
0.00%
416.gamess
7.90%
1.00%
0.08%
1.00%
0.08%
92.30%
7.29%
2.00%
0.16%
433.milc
1.50%
1.40%
0.02%
1.50%
0.02%
92.30%
1.38%
2.10%
0.03%
434.zeusmp
4.00%
0.00%
0.00%
0.00%
0.00%
99.80%
3.99%
0.00%
0.00%
435.gromacs
3.40%
0.30%
0.01%
0.30%
0.01%
89.20%
3.03%
0.00%
0.00%
436.cactusADM
0.20%
0.10%
0.00%
0.10%
0.00%
96.70%
0.19%
0.20%
0.00%
437.leslie3d
3.20%
0.00%
0.00%
0.00%
0.00%
94.90%
3.04%
0.00%
0.00% 0.00%
454.calculix
4.60%
0.30%
0.01%
0.30%
0.01%
96.00%
4.42%
0.10%
459.GemsFDTD
1.50%
5.90%
0.09%
5.90%
0.09%
84.60%
1.27%
0.10%
0.00%
465.tonto
5.90%
3.50%
0.21%
3.50%
0.21%
87.10%
5.14%
0.40%
0.02%
470.lbm
0.90%
0.00%
0.00%
0.00%
0.00%
96.60%
0.87%
0.00%
0.00%
481.wrf
5.70%
2.10%
0.12%
2.10%
0.12%
91.80%
5.23%
0.00%
0.00%
10.20%
0.60%
0.06%
0.60%
0.06%
95.60%
9.75%
0.10%
0.01%
3.82%
1.36%
0.05%
1.37%
0.05%
93.05%
3.56%
0.38%
0.02%
444.namd
4.90%
0.00%
0.00%
0.00%
0.00%
98.00%
4.80%
0.00%
0.00%
447.dealII
17.20%
5.30%
0.91%
4.90%
0.84%
73.40%
12.62%
7.70%
1.32%
450.soplex
16.40%
0.80%
0.13%
0.80%
0.13%
94.30%
15.47%
0.10%
0.02%
453.povray
14.30%
2.30%
0.33%
2.40%
0.34%
86.30%
12.34%
0.90%
0.13%
Avg
13.20%
2.10%
0.34%
2.03%
0.33%
88.00%
11.31%
2.18%
0.37%
482.sphinx3 Avg FP – C++
Table 4: Branch types in SPEC CPU 2006 programs To better illustrate the comparison we use Principle Component Analysis and project the reduced dimension space in Figures 3 a. & 3 b. Only branch type percentages computed at a per instruction basis is included in the PCA analysis used for the plot. In Fig 3 a. we note that all the integer benchmarks are spread around. Most of the Integer C++ benchmarks have non C++ benchmarks in the vicinity. In Fig 3 a. 483.xalancbmk is the C++ program most distinct in branch
8
composition. Among floating point programs (Fig 3 b.) dealII stands out distinctly. Soplex and povray too demonstrate sufficient difference compared to the others but not as much as dealII. The distinction in dealII can be attributed to multiple reasons – the percentage of branches, percentage of calls, returns as well as indirect branches. dealII has the highest percentage of indirect branches – 7.7% of the branches which is 1.32% of the instructions. With 5.3% and 4.9% of the branches (0.91% and 0.84% of instructions) being RET and CALL branches respectively, dealII tops the percentage of RET and CALL branches too. On average non-C++ and C++ programs in Floating point benchmarks are different. For example the average percentage of branches for non-C++ FP programs is 3.82% while the same is 13.20% for C++ FP programs. We see the same difference different types of branches including indirect branches – 0.28% for nonC++ vs. 2.18% for C++.
Fig 3. (b) FP - PC scatter plot of branch types. Table 5 presents the branch misprediction statistics for the SPEC CPU 2006 benchmarks measured on Woodcrest. Similar measurement made on Power 5+ is included in the Appendix as Table A-1. The benchmarks are grouped as a permutation of INT vs. FP and non-C++ vs. C++. The aspect of note is the difference between floating point C++ and floating point non-C++ programs. This trend is inline with the branch type characteristics observed before. For better clarity we use PCA on this data after accounting for the branch percentage i.e. the misprediction is computed on the total number of instructions. Figure 4 (a&b) contains this PCA plot. It can be clearly seen that among Integer benchmarks both C++ and non-C++ programs are mixed together in space. On the other hand the C++ floating-point benchmarks povray, soplex and dealII are all distant enough from the cluster of non-C++ programs. 482.sphinx is seen close to dealII and we find from the data in table 5 that it has a high percentage of branches (10.2%) and various mispredictions.
9
% Branch Inst BENCHMARK
% misprediction Branch
RET Br
400.perlbench
23.27%
0.38%
1.29%
CALL Br 7.49%
CND Br 1.58%
IND Br 15.14%
not taken 0.88%
Taken 2.98%
401.bzip2
15.29%
0.78%
13.72%
0.00%
5.46%
0.14%
4.61%
5.57%
403.gcc
21.92%
0.56%
4.74%
0.14%
2.77%
14.91%
1.82%
3.46%
429.mcf
19.23%
1.12%
2.98%
0.00%
5.75%
0.27%
4.36%
7.93%
445.gobmk
20.75%
2.25%
11.41%
0.11%
12.11%
21.64%
8.82%
13.66%
456.hmmer
8.37%
0.88%
13.29%
0.00%
10.53%
0.11%
8.56%
12.99%
458.sjeng
21.41%
1.41%
9.31%
6.66%
6.81%
24.37%
4.22%
10.45%
462.libquantum
27.26%
1.36%
0.00%
0.00%
4.92%
0.00%
7.65%
3.74%
464.h264ref
7.54%
0.16%
4.68%
0.10%
2.33%
1.12%
2.98%
1.67%
18.34%
0.99%
6.82%
1.61%
5.81%
8.63%
4.88%
6.94%
471.omnetpp
20.68%
0.51%
3.42%
0.13%
2.99%
0.55%
1.69%
3.83%
473.astar
17.07%
2.42%
7.60%
0.00%
13.62%
0.15%
13.28%
15.22%
Avg INT – C++
483.xalancbmk
25.65%
0.32%
7.63%
0.62%
0.86%
1.94%
0.56%
2.08%
Avg
21.13%
1.08%
6.22%
0.25%
5.82%
0.88%
5.18%
7.04%
FP 410.bwaves
0.70%
1.30%
0.00%
0.00%
1.40%
46.70%
14.00%
0.00%
416.gamess
7.90%
1.60%
0.90%
0.00%
1.60%
7.30%
1.90%
1.30%
433.milc
1.50%
0.00%
0.00%
0.00%
0.00%
0.00%
0.20%
0.00%
434.zeusmp
4.00%
1.30%
0.30%
0.00%
1.30%
16.10%
1.70%
1.00%
435.gromacs
3.40%
6.20%
0.30%
0.00%
7.10%
0.40%
6.60%
6.60%
436.cactusADM
0.20%
0.50%
3.80%
1.80%
0.60%
0.60%
3.60%
0.10%
437.leslie3d
3.20%
0.60%
4.10%
0.60%
0.60%
5.90%
2.90%
0.10%
454.calculix
4.60%
2.50%
4.30%
0.00%
2.60%
4.30%
2.80%
2.50%
459.GemsFDTD
1.50%
1.90%
0.10%
0.00%
2.30%
11.70%
8.30%
0.70%
465.tonto
5.90%
1.70%
1.00%
0.00%
1.90%
0.30%
2.60%
1.30%
470.lbm
0.90%
0.40%
0.20%
0.00%
0.50%
0.00%
1.20%
0.10% 0.50%
481.wrf 482.sphinx3 Avg
5.70%
1.40%
0.30%
0.00%
1.50%
1.20%
4.80%
10.20%
3.80%
7.80%
0.00%
4.10%
1.40%
3.90%
4.10%
3.82%
1.78%
1.78%
0.18%
1.96%
7.38%
4.19%
1.41%
FP – C++ 444.namd
4.90%
4.80%
0.40%
0.00%
4.50%
21.30%
5.80%
4.50%
447.dealII
17.20%
3.00%
0.80%
0.00%
4.00%
0.50%
3.90%
2.60%
450.soplex
16.40%
5.60%
0.70%
0.00%
5.70%
2.20%
8.30%
4.40%
453.povray
14.30%
4.30%
3.00%
13.00%
3.90%
36.00%
2.60%
6.10%
Avg
13.20%
4.43%
1.23%
3.25%
4.53%
15.00%
5.15%
4.40%
Table 5: misprediction characteristics of SPEC CPU 2006
10
Fig 4. (a) Integer - PC scatter plot of branch misprediction.
Fig 4. (a) FP - PC scatter plot of branch misprediction.
11
5. Conclusion Object oriented programming has gained in popularity due to their features that reduce the programmer effort and increase manageability of code. From prior studies it is expected that object oriented programs would increase the percentage of function calls and indirect branches. The presence of seven C++ programs in the SPEC CPU 2006 suite gives us a chance to study these programs for their object oriented nature and the impact C++ code style has had on control flow. We use C-K metrics to measure the object oriented nature of the C++ code and find that some of the C++ programs are much more object oriented than others. Xlanckbmk, dealII and omnetpp exhibit strong object oriented characteristics. To find out how object oriented these C++ programs are compared to other object oriented language benchmarks we compare them with SPEC jvm98 and SPEC jbb2000. In comparing them we find that the C++ programs in SPEC CPU 2006 are not any worse off than the java programs. This is a very encouraging sign. Our study also attempts to find the impact object oriented nature of the code has on control flow characteristics of the code. We find that the change in control flow behavior depends on the amount of object oreintedness of the code. The change in control flow due to object oriented coding is pronounced among floating point benchmarks compared to integer benchmarks.
6. Acknowledgements We acknowledge the help of Alex Mericas, V. R. Indukuru and M.L. Pesantez in providing part of the data. The authors are supported in part by NSF grants 0429806 & 0702694, the IBM Systems and Technology Division, IBM CAS Program, and AMD.
7. References [1] Blackburn, S.M., et. al, "The DaCapo Benchmarks: Java Benchmarking Development and Analysis," The ACM SIGPLAN Conference on Object Oriented Programming Systems, Languages and Applications (OOPSLA), 2006. [2] Chidamber, S. R. and Kemerer, C. F. "A Metrics Suite for Object Oriented Design," IEEE Trans. Softw. Eng., vol. 20, pp. 476-493, 1994. [3] G. Dunteman, Principal Components Analysis, Sage Publications, 1989. [4] Eeckhout, L., Georges, A., and Bosschere, K. D., "How Java programs interact with virtual machines at the microarchitectural level," presented at OOPSLA '03: Proceedings of the 18th annual ACM SIGPLAN conference on Object-oriented programing, systems, languages, and applications, Anaheim, California, USA, 2003. [5] Eeckhout, L., Vandierendonck, H., and Bosschere, K. D., "Workload Design: Selecting Representative Program-Input Pairs," presented at PACT '02: Proceedings of the 2002 International Conference on Parallel Architectures and Compilation Techniques, Washington, DC, USA, 2002. [6] Kim, H., Joao, J. A., Mutlu, O., Lee, C. J., Patt, Y. N., and Cohn, R. “VPC prediction: reducing the cost of indirect branches via hardware-based dynamic devirtualization.” In Proceedings of the 34th Annual international Symposium on Computer Architecture (ISCA '07).
12
[7] Spinellis, Diomidis. Tool writing: A forgotten art?. IEEE Software, 22(4), July/August 2005 http://www.spinellis.gr/sw/ckjm/. [8] Wong, M. 2007. C++ benchmarks in SPEC CPU2006. SIGARCH Comput. Archit. News 35, 1 (Mar. 2007), 77-83. [9] SPEC. http://www.spec.org/ [10] Tang, D.-C.D., Maynard, A.M.G., John, L.K. Contrasting branch characteristics and branch predictor performanceof C++ and C programs, IEEE Performance, Computing, and Communications Conference. pp 275-283. February 1999. [11] Calder, B., Grunwald, D. and Zorn, B. “Quantifying Behavioral Differences Between C and C++ Programs” Journal of Programming Languages, Vol 2, Num 4, 1994. [12] CCCC (C and C++ Code Counter). http://cccc.sourceforge.net/
Appendix % Branch Inst BENCHMARK 400.perlbench 401.bzip2 403.gcc 429.mcf 445.gobmk 458.sjeng 462.libquantum 464.h264ref Avg INT – C++ 471.omnetpp 473.astar 483.xalancbmk Avg FP 410.bwaves 416.gamess 433.milc 434.zeusmp 435.gromacs 436.cactusADM 437.leslie3d 454.calculix 459.GemsFDTD 465.tonto 470.lbm 481.wrf 482.sphinx3 Avg FP – C++ 444.namd 447.dealII 450.soplex 453.povray Avg
% misprediction Conditional Br Target Address prediction 3.69% 2.41% 7.18% 0.00% 3.67% 0.52% 5.62% 0.02% 11.62% 0.34% 8.19% 2.29% 3.28% 0.00% 4.80% 0.29% 6.00% 0.73%
18.15% 15.31% 19.24% 17.05% 16.25% 17.87% 21.34% 7.22% 16.55%
Branch 6.10% 7.18% 4.18% 5.64% 11.96% 10.48% 3.28% 5.10% 6.74%
19.45% 13.08% 20.43% 17.65%
5.42% 15.16% 1.74% 7.44%
3.92% 15.16% 1.14% 6.74%
1.50% 0.00% 0.60% 0.70%
0.74% 7.62% 2.67% 2.06% 3.65% 0.24% 1.42% 4.21% 1.88% 5.88% 1.47% 4.11% 7.53% 3.34%
2.80% 9.47% 0.44% 4.24% 8.77% 2.14% 2.28% 6.12% 2.82% 9.79% 0.90% 4.29% 10.73% 4.98%
2.80% 8.88% 0.44% 4.24% 8.76% 1.10% 2.28% 5.93% 2.80% 8.75% 0.90% 4.26% 10.71% 4.76%
0.00% 0.59% 0.00% 0.00% 0.01% 1.03% 0.00% 0.19% 0.02% 1.04% 0.00% 0.03% 0.02% 0.23%
5.24% 14.68% 14.91% 11.74% 11.64%
6.98% 8.14% 6.37% 6.21% 6.92%
6.97% 7.54% 6.27% 4.96% 6.44%
0.01% 0.59% 0.10% 1.25% 0.49%
Table A-1: misprediction characteristics of SPEC CPU 2006 on P5+
13