analysis in financial markets. A considerable amount of work has provided
support for the view that technical trading rules are capable of producing
valuable ...
Economics Letters 69 (2000) 89–94 www.elsevier.com / locate / econbase
On the profitability of technical trading rules based on artificial neural networks: Evidence from the Madrid stock market a a ´ ´ ´ Fernando Fernandez-Rodrıguez , Christian Gonzalez-Martel , b, ´ Sosvilla-Rivero * Simon a
b
Universidad de Las Palmas de Gran Canaria, Las Palmas, Canary Islands, Spain FEDEA and Universidad Complutense de Madrid, Jorge Juan 46, 28001 Madrid, Spain Received 21 June 1999; accepted 3 March 2000
Abstract In this paper we investigate the profitability of a simple technical trading rule based on Artificial Neural Networks (ANNs). Our results, based on applying this investment strategy to the General Index of the Madrid Stock Market, suggest that, in absence of trading costs, the technical trading rule is always superior to a buy-and-hold strategy for both ‘‘bear’’ market and ‘‘stable’’ market episodes. On the other hand, we find that the buy-and-hold strategy generates higher returns than the trading rule based on ANN only for a ‘‘bull’’ market subperiod. 2000 Elsevier Science S.A. All rights reserved. Keywords: Technical trading rules; Neural network models; Security markets JEL classification: G10; G14; C53
1. Introduction In recent years, there has been increasing interest in testing for predictable components in stock prices (see, Fama, 1991, for a review). The existence of patterns in asset prices has been exploited to ´ ´ improve stock-market forecastability using different techniques (see, e.g., Fernandez-Rodrıguez et al., 1997). One of the approaches that have been tried to improve the ability of forecasting security markets is the Artificial Neural Networks (ANNs) (see Van Eyden, 1995, for a review and Genc¸ay, 1998a, for an application). These ANNs rely on their powerful pattern recognition properties to *Corresponding author. Tel.: 134-91-435-0401; fax: 134-91-577-9575. E-mail address:
[email protected] (S. Sosvilla-Rivero). 0165-1765 / 00 / $ – see front matter PII: S0165-1765( 00 )00270-6
2000 Elsevier Science S.A. All rights reserved.
´ ´ et al. / Economics Letters 69 (2000) 89 – 94 F. Fernandez-Rodrıguez
90
produce short-term predictions of the time series, therefore avoiding the need to specify an explicit econometric model to represent the time series. On the other hand, another important line of research has evaluated the relevance of technical analysis in financial markets. A considerable amount of work has provided support for the view that technical trading rules are capable of producing valuable economic signals in both stock markets and foreign exchange markets. Regarding stock markets, Brock et al. (1992) used bootstrap simulations of various null asset pricing models and found that simple technical trading rule profits cannot be explained away by the popular statistical models of stock index returns. Later, Genc¸ay and Stengos (1997, 1998) found predictive power of simple technical trading rules in forecasting the current returns using feedforward network and NN regressions, while (Genc¸ay, 1998a and 1998b) found evidence of nonlinear predictability in stock market returns by using the past buy and sell signals of the moving average rules. As for foreign exchange markets, LeBaron (1992 and 1998) followed the bootstrap methodology to demonstrate the statistical significance of the technical trading rules against several parametric null models of exchange rates, while LeBaron (1999) and Sosvilla-Rivero et al. (1999) discovered that excess returns from extrapolative technical trading rules in foreign exchange markets are high during periods of central bank intervention. Finally, Genc¸ay (1999), using feedforward network and NN regressions, found statistically significant forecast improvements for the current returns over the random walk model of foreign exchange returns. The aim of this paper is to investigate the profitability of using artificial neural networks in security markets. To that end, the ANNs predictions are transformed into a simple trading strategy, whose profitability is evaluated against a simple buy-and-hold strategy. We have applied this investment strategy to the General Index of the Madrid Stock Market, using data for the 2 January 1966–12 October 1997 period (6931 observations). The paper is organised as follows. Section 2 presents the model used to generate predictions. The empirical results are shown in Section 3. Finally, Section 4 provides some concluding remarks.
2. The model ANNs models simulate parallel computational structure with highly interconnected simple units, called neurons. The simplest ANN model is the feedforward network, where information is passed from the point of entry (at the so-called ‘‘input layer’’), assigned a weight and passed to a further layer of hidden neurons. A further set of weights can be assigned to this hidden information, and so on, until reaching the final layer of the system (the ‘‘output layer’’) which represents the forecast (see Kuan and White, 1994). In this paper, we use the following feedback network
S
O a FSb 1O b r DD. 4
yt 5 G a 0 1
j 51
9
j
ji t 2i
0j
i 51
We follow Genc¸ay (1999) and consider nine inputs (corresponding with the returns in the previous 9 days: r t21 , r t22 , . . . ,r t 29 ). Nevertheless, the results are robust to the choice of the number of inputs, since other values for this parameter around nine gave similar qualitative results. In addition there is one hidden layer with four units and one output layer with a single neuron ( y). Any hidden layer unit
´ ´ et al. / Economics Letters 69 (2000) 89 – 94 F. Fernandez-Rodrıguez
91
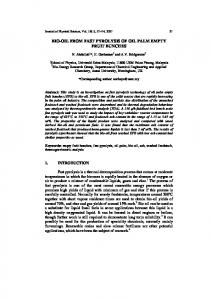
receives the weighted sum of all inputs and a bias term and produces an output signal through the hidden transfer function (F ), where b ji is the weight of its connection from the ith input unit to the jth hidden layer unit. In the same way, the output unit receives the weighted sum of the output signals of the hidden layer, and produces a signal through the output transfer function (G), where a j is the weight of the connection from the jth hidden layer unit. The final output will be a value in the (21, 11) interval. A value greater than 0 will be used as a buy signal, while a value lesser than 0 will be used as a sell signal. The values of the weights are determined by an iterative learning process and their transformation at each successive layer determined by a specific kind of transfer function. Regarding the training process, the most widely used is error backpropagation, a recursive gradient descent method that minimises the sum of squared errors of the system by moving down the gradient error curve. As for the transformation functions, F will be a logarithmic function and G a hyperbolic tangent function. Since stock market prices present a tendency to generate alternating episodes of generally rising or generally falling prices (so-called ‘‘bull’’ and ‘‘bear’’ markets), we have examined the performance of the ANN in three different subperiods: (I) 10 / 2 / / 91 to 10 / 2 / 92, (II) 7 / 14 / 94 to 7 / 13 / 95 and (III) 10 / 23 / 96 to 10 / 15 / 97. As shown in Fig. 1, subperiod I corresponds to a downwards trend, subperiod II presents a relative stable episode, and III exhibits an upwards movement in the index. For each subsample, the ANN model, using all previous observations in the learning process, produces forecasts 250 days ahead (a year of price data in daily frequency), long enough to reduce the effects of data snooping.
Fig. 1. The general index of Madrid stock exchange.
´ ´ et al. / Economics Letters 69 (2000) 89 – 94 F. Fernandez-Rodrıguez
92
3. Empirical results In order to evaluate the forecast accuracy of the ANN predictors, we first compute both the percentage of correct predictions and the Pesaran and Timmermann’s (1992) non-parametric test proportion of correctly predicted signs. To assess the economic significance of the ANN predictors as a simple technical trading strategy, we consider the estimated total return of such strategy: n 1 r 11
Rˆ t 5
O
yˆ t r t
t5n 11
where r is the out-of-sample horizon and yˆ t the recommended position which takes either a value of 21 (for a short position) or 11 (for a long position), and n is the number of observations. Note that we are not considering transaction costs. Given that in a random-walk market no mechanical trading rule would consistently outperform a buy-and-hold policy, we compare both strategies. The returns on a simple buy-and-hold strategy are given by:
S D
Pt 1 r R b 5 log ]] Pt
where r indicates the holding period, and Pt and Pt1 r are prices of the security at time t and t 1 r respectively. In addition to total returns, we also consider other two profitability measures: the ideal profit and the Sharpe ratio. The ideal profit measures the returns of the trading system against a perfect predictor and is calculated by: n 1 r 11
O yˆ r R 5 ]]]. O ur u t t
i
t 5n 11 n 1 r 11
t
t 5n 11
As can be seen, R I 5 1 if the indicator variable yˆ t takes the correct trading position for all observations in the sample. If all trade positions are wrong, then the value of this measure is R I 5 2 1. An R I 5 0 value is considered as a benchmark to evaluate the performance of an investment strategy. Regarding the Sharpe ratio, it is simply the mean return of the trading strategy divided by its standard deviation:
mRˆ T SR 5 ]]. sRˆ T The higher the Sharpe ratio, the higher the return and the lower the volatility. The results for all these tests are reported in Table 1. As can be seen, the sign predictions for the recommended positions range in the 54–58%, indicates a performance better than a random walk directional forecast. Furthermore, the Pesaran-Timmermann tests are significant at the 1% level for the subperiods II and III. Regarding total returns, the trading rule based on the ANN dominate the
´ ´ et al. / Economics Letters 69 (2000) 89 – 94 F. Fernandez-Rodrıguez
93
Table 1 Out-of-sample tests Tests
Subperiod I (bear market)
Subperiod II (stable market)
Subperiod III (bull market)
Sign predictions Pesaran and Timmermann Total return Ideal profit ratio Sharpe ratio Buy and hold return
0.54 0.97 0.48 0.25 0.19 20.40
0.57 2.24* 0.27 0.17 0.13 0.0019
0.58 2.26* 0.29 0.14 0.11 0.44
*
Significant at the 1% level.
buy-and-hold strategy in subperiods I (48% vs. 240%) and II (27% vs. 0.19%), while the opposite is truth for subperiod III (29% vs. 44%). The Sharpe ratio is relatively higher in the bear market subperiod (0.19) than in the remainder subperiods (0.13 and 0.11). Consistently, the ideal profit is high in subperiod I (0.25) and remains in similar order in the other two subperiods, being always greater than zero.
4. Concluding remarks In this paper we have investigated the profitability of simple technical trading rule based on ANN models. Our results, based on applying this investment strategy to the General Index of the Madrid Stock Market, suggest that, in absence of trading costs, the technical trading rule is always superior to a buy-and-hold strategy for both ‘‘bear’’ markets and ‘‘stable’’ market episodes. On the other hand, we found that the buy-and-hold strategy generates higher returns than the trading rule based on ANN for a subperiod presenting upwards trend (‘‘bull’’ markets). These results are in line with those ´ ´ presented in Fernandez-Rodrıguez et al. (1999) when applying nonlinear predictors to the Nikkei Index.
Acknowledgements The authors wish to thank an anonymous referee for helpful comments and suggestions and Intermoney for providing us with the data set. Financial support from the Spanish Ministry of Education, through DGICYT Project PB94-0425, is also gratefully acknowledged.
References Brock, W., Lakonish, J., LeBaron, B., 1992. Simple technical rules and the stochastic properties of stock returns. Journal of Finance 47, 1731–1764. Fama, E.F., 1991. Efficient capital markets: II. Journal of Finance 46, 575–1617.
94
´ ´ et al. / Economics Letters 69 (2000) 89 – 94 F. Fernandez-Rodrıguez
´ ´ ´ Artiles, M.D., 1997. Using nearest-neighbour predictors to forecast the Fernandez-Rodrıguez, F., Sosvilla-Rivero, S., Garcıa ´ Spanish stock markets. Investigaciones Economicas 21, 75–91. ´ ´ ´ Artiles, M.D., 1999. Nearest Neighbour forecast for the Nikkey index. Fernandez-Rodrıguez, F., Sosvilla-Rivero, S., Garcıa Japan and the World Economy 11, 395–413. Genc¸ay, R., 1998a. Optimization of technical trading strategies and the profitability in security markets. Economics Letters 59, 249–254. Genc¸ay, R., 1998b. The predictability of security returns with simple technical trading rules. Journal of Empirical Finance 5, 347–359. Genc¸ay, R., 1999. Linear, non-linear and essential foreign exchange rate prediction with some simple technical trading rules. Journal of International Economics 47, 91–107. Genc¸ay, R., Stengos, T., 1997. Technical trading rules and the size of the risk premium in security returns. Studies in Nonlinear Dynamics and Econometrics 2, 23–34. Genc¸ay, R., Stengos, T., 1998. Moving average rules, volume and predictability of security returns with feedforward networks. Journal of Forecasting 17, 401–414. Kuan, C.M., White, H., 1994. Artificial neural networks: An econometric perspective. Econometric Reviews 13, 1–91. LeBaron, B., 1992. Do moving average rule results imply nonlinearities in foreign exchange markets? Working Paper 9222, SSRI, University of Wisconsin-Madison. LeBaron, B., 1998. Technical trading rules and regime shifts in foreign exchange. In: Acar, E., Satchell, S. (Eds.), Advanced Trading Rules. Butterworth-Heinemann, London, pp. 5–40. LeBaron, B., 1999. Technical trading rule profitability and foreign exchange intervention. Journal of International Economics 49, 125–143. Pesaran, M.H., Timmermann, A., 1992. A simple nonparametric test of predictive performance. Journal of Business and Economic Statistics 10, 461–465. ´ ´ ´ Sosvilla-Rivero, S., Andrada-Felix, J., Fernandez-Rodrıguez, F., 1999. Further evidence on technical analysis and profitability of foreign exchange intervention. Working Paper 99-01, FEDEA. Van Eyden, R.J., 1995. The Application of Neural Networks in the Forecasting of Share Prices. Finance and Technology Publishing, Haymarket, VA.