of attacks in the NSL-KDD dataset. Satisfactory results are obtained based on several performance metrics. Akilandeswari. V. et al. [16] have used a Probabilistic ...
(IJACSA) International Journal of Advanced Computer Science and Applications, Vol. 8, No. 4, 2017
DoS Detection Method based on Artificial Neural Networks Mohamed Idhammad
Karim Afdel
Mustapha Belouch
LabSIV, Department of Computer Science, FSA, Ibn Zohr University, Agadir, Morocco
LabSIV, Department of Computer Science, FSA, Ibn Zohr University, Agadir, Morocco
LAMAI, Department of Computer Science, FSTG, Cadi Ayyad University, Marrakesh, Morocco
Abstract—DoS attack tools have become increasingly sophisticated challenging the existing detection systems to continually improve their performances. In this paper we present a victimend DoS detection method based on Artificial Neural Networks (ANN). In the proposed method a Feed-forward Neural Network (FNN) is optimized to accurately detect DoS attack with minimum resources usage. The proposed method consists of the following three major steps: (1) Collection of the incoming network traffic, (2) selection of relevant features for DoS detection using an unsupervised Correlation-based Feature Selection (CFS) method, (3) classification of the incoming network traffic into DoS traffic or normal traffic. Various experiments were conducted to evaluate the performance of the proposed method using two public datasets namely UNSW-NB15 and NSL-KDD. The obtained results are satisfactory when compared to the state-of-the-art DoS detection methods. Keywords—DoS detection; Artificial Neural Networks; Feedforward Neural Networks; Network traffic classification; Feature selection
I.
I NTRODUCTION
DoS attack is a rapidly growing problem that continues to threat web services’ availability in our days. It aims mainly to deprive legitimate users from Internet services [1]. Despite the important evolution of the information security technologies, the attack continues to challenge the existing defense systems [2]. According to [3] there are four implementation schemes of DoS defense systems: Source-end, intermediate, distributed and victim-end. Considering the difficulties of source-end, intermediate and distributed defense systems discussed in [3], we designed the proposed DoS detection method as a victim-end solution. The victim-end DoS defense systems are deployed in the victim’s infrastructure, which allows efficient analysis of the incoming network traffic to the victim. Although, victim-end defense systems are the most practically applicable, they require evolution and application of sophisticated and intelligent techniques. However, the more sophisticated the victim-end defense systems become, the more they consume significant amounts of computational, storage and networking resources of the victims. Therefore, the ideal DoS defense system seem to be a victim-end defense system that can detect the attack accurately, in less period of time and with low computational cost. In this paper we present a DoS detection method based on Artificial Neural Networks (ANN) [4], [5]. The proposed method is a victim-end solution in which a Feed-forward Neural Network (FNN) [6], [7] is
used to classify the incoming network traffic into DoS or normal. The simplicity of the proposed method design which consists of three layers (input, hidden and output layers) allows to detect DoS attack with minimum resources usage. The proposed method constitutes of three modules. The network traffic collector module used to collect the incoming network traffic to the victim’s routers. The data pre-processing module responsible of normalizing the network traffic data and selecting relevant features. The detection module classifies the incoming network traffic into DoS traffic or normal traffic using an ANN classifier. Several optimizations are applied to the adopted ANN in order to improve the performance of the proposed method. These optimizations include selection of the optimum topology parameters and the optimum training algorithm, weight initialization function and activation function that yield better DoS detection performance. Kim K. J. et al. [8] have presented many optimization techniques that can improve the performance of a neural network for classification tasks. To improve the processing time and detection performance of the proposed method relevant features are selected using a Correlation-based Feature Selection method [9], [10]. The proposed method was evaluated on two datasets namely NSL-KDD [11] and UNSW-NB15 [12], [13]. Compared to the state-of-the-art the obtained results are satisfactory. The contributions of this paper can be summarized by the following points: •
Optimization of a single ANN classifier to accurately detect the DoS traffic in different network protocols, rather than using a specific classifier for each network protocol which is costly in computation and time.
•
Adoption of an unsupervised CFS method for selecting relevant features of DoS attack with low computational cost.
The reminder of this paper is organized as follows. Section II highlights state-of-the-art DoS detection methods which are based on machine learning approaches. An overview of the DoS attack is given in section III. Section IV introduces the feature selection method used in this paper. Section V presents a detailed explanation of the proposed DoS detection method. The conducted experiments are given in section VI. The obtained results, the results discussion and the conducted comparisons are detailed in section VII. Finally, section VIII draws the conclusion and outlines future works.
www.ijacsa.thesai.org
465 | P a g e
(IJACSA) International Journal of Advanced Computer Science and Applications, Vol. 8, No. 4, 2017 II.
R ELATED W ORKS
Several previous methods have been developed to enhance the DoS detection time and accuracy by using Machine Learning approaches. Siaterlis C. et al. [14] have proposed a DoS detection method based on Multi-Layer Perceptron (MLP). The authors use multiple metrics to successfully detect flooding attacks and classify them as incoming or outgoing attacks. The MLP is trained with metrics coming from different types of passive measurements of network which allows to enhance the DoS detection performances. Similarly, Bhupendra Ingre and Anamika Yadav [15] have used an ANN to detect various type of attacks in the NSL-KDD dataset. Satisfactory results are obtained based on several performance metrics. Akilandeswari V. et al. [16] have used a Probabilistic Neural Network to discriminate Flash Crowd Event from DoS attacks. The method achieves high DoS detection accuracy with lower false positives rate. Adel Ammar and Khaled Al-Shalfan [17] have used feature selection method based on HSV to enhance the performance of neural network for intrusion detection. Alan S. et al. [18] have proposed a DoS Detection Mechanism based on ANN (DDMA). The authors used three different topologies of the MLP for detecting three types of DoS attacks based on the background protocol used to perform each attack namely TCP, UDP and ICMP. The mechanism detect accurately known and unknown, zero day, DoS attacks. The main drawbacks of DDMA are its large resource requirement and its limitation on only the TCP, UDP and ICMP protocols. The majority of the DoS defense systems in the literature are hybrid systems and combine two or more ML approaches to detect the attack which often overwhelms resources of the victim. Furthermore, the early detection of DoS attack is the main drawback of the existing DoS detection systems. Therefore, the need of a new DoS detection method that can detect the attack accurately with low computational and time costs. III.
D O S ATTACK
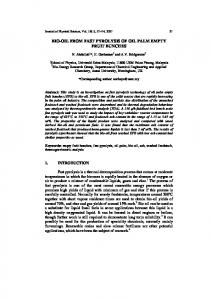
Flooding the victim with a large number of network packets or repeatedly sending to it corrupted or infected packets are the most common techniques used to perform the DoS attack [3]. There are two categories of DoS attack namely Direct DoS attack and Reflection-based DoS [19]. In the Direct DoS attack the attacker uses the zombie hosts to flood directly the victim host with a large number of network packets. Within a short time interval the victim is crippled causing a deny of services. Figure 1 illustrates the Direct DoS attack. Whereas, in
Fig. 1.
Direct DoS attack
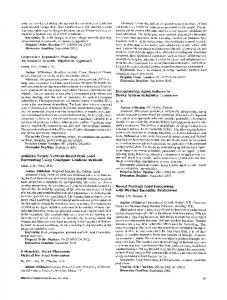
the Reflection-based DoS attack the attacker uses the zombie hosts to take control over a set of compromised hosts called Reflectors. The latter are used to forward a massive amount of
attack traffic to the victim host, as illustrated in figure 2. The principal role of the Reflectors in this attack is to reflect the Botmasters commands and hide his IP address. Understanding
Fig. 2.
Reflection-based DoS attack
how DoS attack works is a necessary step towards the design of appropriate DoS attack detection systems. In both types of DoS attack, the computers infected by the same Bot conduct the same behavior. This behavioral similarity leads to a correlation or even a redundancy in the network traffic data of the Reflectors belonging to the same Botnet. On the other hand, the relevant features in the network traffic dataset of Reflectors that belong to the same Botnet have the same variations over the time. Based on this distinction of the DoS traffic and the legitimate traffic, one can easily classify them. IV.
F EATURE S ELECTION
Feature Selection (FS) is an important issue in machine learning. It aims at selecting optimal subset of relevant features from the original dataset. Removing trivial and redundant features enhances the performances of the learning algorithm and the modeling of the phenomena under analysis. However, FS is usually skipped and the features are selected without a proper justification [20]. There are mainly three categories of feature selection approaches. Wrapper approach [20], [21] uses a predetermined machine learning algorithm to select the new features subset. Where the classification performance is used as the evaluation criterion. Embedded approach performs feature selection in the process of training and are usually specific to the machine learning algorithm [20]. Filter approach [20], [21] depends on the general characteristics of data to select the new set of features. The features are ranked based on certain statistical criteria, where the features with highest ranking values are selected. Filter methods include Consistency-based Feature Selection (CNF) [22] and Correlation-based Feature Selection (CFS) [23]. In the CNF relevant features are selected based on their contribution to enhance the learning algorithm’ accuracy. In spite of the important improvement in the accuracy of the classifiers that CNF brings, it consumes important computational resources and the selection takes more time. Whereas, in CFS relevant features are selected based on their correlation to the output class which does not requires high computational and time cost to improve the classifier performances. Hence, it is more appropriate for the DoS attack detection problem. The CFS method used in this paper is based on the Pearson Correlation Coefficient (PCC). A definition of the PCC is given in the following section.
www.ijacsa.thesai.org
466 | P a g e
(IJACSA) International Journal of Advanced Computer Science and Applications, Vol. 8, No. 4, 2017 A. Pearson correlation coefficient
C. Dataset
The Pearson correlation coefficient (ρ), better known as the correlation coefficient, is a measure of dependence or similarity between two random variables [24]. ρ summarizes the relationship between two variables that have a straight line or linear relationship with each other. The Pearson correlation coefficient ρ can be defined as follows. Suppose that there are two variables X and Y , each having n values x1 ,x2 , . . . , xn and y1 , y2 , . . . , yn respectively. The Pearson’s coefficient ρ is computed according to the following formula:
The UNSW-NB15 dataset contains nine types of modern attacks and new patterns of normal traffic. It has 49 features split into five groups namely Flow features, Basic features, Content features, Time features and Additional generated features. This dataset contains a total number of 257,705 records labeled whether by an attack type label or a normal label. A number of 16,353 records correspond to the DDoS attack. For efficient evaluation of the proposed method, normal and DDoS records are filtered from UNSW-NB15. The resulted subset consists of 109,370 records of DDoS and normal traffic. The training and testing sets constitute respectively of 60% and 40% of the subset. Three major reasons motivated us to use the UNSW-NB15 dataset. The dataset contains modern normal and attack traffic, it is well structured and comprehensible and it is more complex than other previous datasets which makes it a good benchmark to evaluate our method. The NSL-KDD dataset contains four types of attacks namely DoS, Probe, R2L and U2R. It has 41 features divided to three groups: Basic features, Traffic features and Content features. This dataset contains a total number of 148,517 records in both training and testing sets. We selected this dataset for two main reasons. First, it is widely used for IDSs’ benchmarking in the literature. Also, it overcomes some of the inherent problems of its predecessors KDD Cup’99 and DARPA’98 [11], such as records redundancy and duplication. To use the UNSWNB15 dataset in the learning of the proposed method, we perform the following preprocessing tasks. First we drop the 14 additional generated features from the dataset. Second, as we previously mentioned in section III, the DoS attack is mainly based on Reflectors. Where a Reflector is a legitimate computer controlled by the attacker, which use his IP address to perform the DoS. Hence, in the DoS attack the IP address do not contain relevant information to classify its traffic. The source and destination IP features are then dropped from the dataset. This allows to generate a reduced dataset of 33 features. Finally, the CFS method is used to select relevant features form the generated dataset. The final dataset is reduced from 33 features to 6 relevant features showed in table 1.
cov(X, Y ) ρ= p σ 2 (X)σ 2 (Y )
(1)
Where cov(X, Y ) is the covariance between X and Y , and σ is the standard deviation. Let the mean of X be x¯i and the mean of Y be y¯i . The estimation of the Pearson correlation coefficient ρ is given by: P (xi − x¯i )(yi − y¯i ) ρ = qP i (2) P ¯i )2 j (yi − y¯i )2 i (xi − x The value of ρ lies between -1 and 1. ρ = −1 means perfect negative correlation, as one variable increases the other decreases. ρ = 1 means perfect positive correlation. ρ = 0 means no linear correlation between the two variables. Thus, features redundancy can be detected by correlation analysis. The features which are strongly correlated positively represent a redundant information. B. CFS method The CFS method used in this paper constitutes of two main steps. We already know that a feature is highly correlated to to another feature as ρ between them go near to 1. In the first step, for each pair of features Xi and Xj in the dataset we compute the Pearson’s coefficient ρij in order to detect redundant features subset. According the formulate (1), ρij between Xi and Xj is defined as follows: cov(Xi , Xj ) σ 2 (Xi )σ 2 (Xj )
ρij = p
(3)
The final dataset constitutes of 31,283 records of DoS and normal traffic. The records are labeled as 1 to designate a DoS record and 0 to designate normal record. V.
ANN- BASED D O S D ETECTION M ETHOD
A. Framework of the detection method We consider only whether the upper triangular matrix ρij(i=1,2,...,j,j+1,...,n) ,or the lower triangular matrix ρij(j=1,2,...,i,i+1,...,n) . The features Xi and Xj corresponding to ρij > δ are considered redundant, only one of them is selected to the new dataset of relevant features. Where, δ is the PCC threshold, its optimum value is δ = 0.4 which is determined empirically (see section VII-B). In the second step, for each feature we create a list of its correlated features. The features correlated with highest number of other features are considered relevant and they are selected first for the new dataset. This because they contain more information about their correlated features. The latter are dropped from the ρij matrix. At the end a list of high relevant features is constructed.
The basic framework of the proposed DoS detection method consists of the following four modules: Network traffic collector module: is a program implemented in the edge network routers of the victim. This module collects the incoming network packets to the victims routers. For this purpose we use Tshark [25], other sniffer tools can be used such as Tcpdum [26]. Data preprocessing module is responsible of normalizing values of features and selecting relevnt features for DoS detection. Generally, values of attributes in a network traffic dataset are not distributed uniformly. It is important to maintain a uniform distribution of each attribute values before starting the learning process. For this purpose we use the MinMax
www.ijacsa.thesai.org
467 | P a g e
(IJACSA) International Journal of Advanced Computer Science and Applications, Vol. 8, No. 4, 2017 method. In MinMax the values of features are scaled to the range [0, 1] as follows: xnew = i
xi − min(X) max(X) − min(X)
(4)
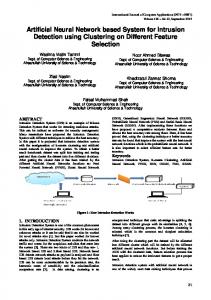
Where X is a relevant feature, xi is a possible value of X within the current time window and xnew is the normalized i value. The module selects relevant features for DoS detection from UNSW-NB15 [12], [13] or NSL-KDD [11] datasets using the method detailed in IV-B. DoS detection module: responsible of the classification of the incoming network traffic to the victim’s routers. This module is based on a three layers ANN, more details about this module are given in V-B6. The proposed DoS detection method follows a specific process that consists of three main steps illustrated in figure 3. Step I
Incoming network collector
Public dataset
Dataset of relevant features
Learning of the MLP
Step II DoS detection using the MLP
4) Weights initialization function: The weights initialization function has a significant effect on the training process of a neural network. Weights should be chosen randomly but in such a way that the activation function is primarily activated in its linear region. Extremely large or small weights causes the saturation of the activation function in small gradients and makes the learning slow. Whereas, intermediate weights produce enough large gradients, hence the learning process proceed quickly [27]. In order to achieve this, we used the LeCun’s uniform initialization function [28], in which the weights are drawn from a uniform distribution with mean zero and standard deviation defined as follows:
Dataset of results
Step III Extraction of the source IP addresses of the DoS attack Updating firewall rules and deny the DoS attack sources
Fig. 3.
DoS detection process
B. Network traffic classification This section introduces the adopted MLP to classify DoS traffic and normal traffic. Moreover, we present here the optimization techniques applied to the adopted MLP in order to improve the DoS detection performances and time of the proposed method. These techniques include the topology of the MLP, the learning algorithm, the weights initialization function, the activation function and the cost function. First let us give an overview of the MLP. 1) Multi-layer perceptron: A Multi-Layer Perceptron (MLP) is a feed-forward neural network which constitutes of one or more hidden layers of neurons, computational units, linked by weighted arcs often called synapses. Consider a MLP in which the activation Zi of the ith unit is a non-linear function. Each hidden unit of the MLP computes its input data according to the following models [4], [5]: Zi = f (ai ) X ai = wij zi + bi
2) Topology of the adopted MLP: The MLP topology used is related to the subset of relevant features of the input dataset. According to the relevant features subsets obtained in the section VI-B, we designed our MLP of 6 input units for the UNSW-NB15 dataset and 5 input units for the NSLKDD dataset. For both datasets one output unit is used. The discrimination of the DoS traffic from normal traffic does not requires many hidden layers. Therefore, for this purpose we used the single hidden layer MLP. The number of units in the hidden layer is crucial for optimal learning and better performances of the MLP. Large number of hidden units causes the over-fitting problem. Whereas, a small number of the hidden units causes the under-fitting problem [4], [5]. In our case, based on the empirical results in section VII-C, the optimum number of hidden units of the MLP that produces best classification performances in less period of time is 7 for the UNSW-NB15 dataset and 6 for the NSL-KDD dataset. 3) Learning algorithm: Backpropagation is a very popular neural network learning algorithm because it is conceptually simple, computationally efficient, and because it often works [27]. In our case we trained the backpropagation algorithm using the mini-batch stochastic gradient descent (SGD) algorithm, which is much faster and which allows to the learning algorithm to avoid local minimums [26].
Feature selection
New dataset
Where ai is given by a weighted linear sum of the outputs of other units, wij is the synaptic weight from unit i to unit j, and bi is a bias associated with unit i.
(5)
σm = m−1/2
(7)
Where m is the number of the connections feeding into the neuron. 5) Activation function: In this paper we used the standard logistic function as the activation function of the adopted MLP [29], [28]. The standard logistic function or softmax is a generalized case of the logistic regression where the labels were binary: y(i) ∈ {0, 1}. The Softmax allows us to handle y(i) ∈ {1, . . . , K}, where K is the number of classes. Let {(x(1), y(1)), . . . , (x(m), y(m))} be a training set of m labeled examples. Where x(i) are the input features and y(i) represents the labels. In the logistic regression the labels are binary y(i) ∈ {0, 1}. Whereas, in the standard logistic function the labels are multi-class y(i) ∈ {1, 2, . . . , K}. The standard logistic function is defined as follows:
(6)
j
www.ijacsa.thesai.org
hθ (x) =
1 1 + exp(−θ> x)
(8) 468 | P a g e
(IJACSA) International Journal of Advanced Computer Science and Applications, Vol. 8, No. 4, 2017 Where θ represents the model parameters which are trained to minimize the cost function. 6) Cost function: In [29] Xavier G. and Yoshua B. found that the standard logistic function coupled with the Crossentropy cost function worked much better for classification problems than the quadratic cost which was traditionally used to train feed-forward neural networks. Hence, we adopted the Cross-entropy as our cost function which is defined as follows: "m # X (i) (i) (i) (i) J(θ) = − y log hθ (x ) + (1 − y ) log (1 − hθ (x )) i=1
(9)
Where θ is the model parameters and hθ () represents the activation function. VI.
E XPERIMENTS
In this section we aim to assess the performances of the proposed DoS detection method and to illustrate the impact of the optimization techniques on the MLP performances. First, let us refer to the proposed method as ANN-based DoS Detection Method (ADDM). The performances of ADDM were compared with an unoptimized MLP (u-MLP) that we developed for this purpose. Both methods ADDM and uMLP are trained and tested using the dataset of relevant features obtained in section VI-B. Two more experiments were performed in order to find the optimum PCC threshold value and the optimum number of hidden units of the ADDM. Further comparisons of ADDM performances were conducted with the NSL-ANN [15], the HSV-ANN [17], the DDMA [18] and the ANN [13]. The hardware used in our experiments is a core i3 2.4 GH and 6 GB of memory running under Debian 8 x64. ADDM is implemented using two Python frameworks namely Keras [30] and Theano [31].
False Alarm Rate (FAR): The false alarm rate is the average ratio of the misclassified to classified records either normal or abnormal as denoted in the following equation: F AR =
Accuracy: percentage of the traffic records that are correctly classified by the ADDM. Accuracy = 100 ∗
TP + TN TP + TN + TN + FN
(10)
Sensitivity or True Positive Rate (TPR): Sensitivity =
TP TP + FN
(11)
Specificity or True Negative Rate (TNR): Specif icity =
TN FP + TN
(12)
(13)
P where F P R = F PF+T N is the false positive rate and FN F N R = F N +T P is the false negative rate.
Processing time: DoS detection time depends on two time metrics: training time and testing time. ROC and AUC curves: Receiver Operator Characteristic (ROC) and Area Under ROC (AUC) curves are commonly used to present results for binary decision problems in machine learning. The ROC curve shows how the number of correctly classified positive examples varies with the number of incorrectly classified negative examples. The AUC value represents the accuracy of the classifier. B. Data pre-processing The values of each attributes in the UNSW-NB15 and NSLKDD datasets are not distributed uniformly. It is important to maintain a uniform distribution of each input attribute in the datasets before starting the training process of the MLP. For this purpose the MinMax method, as described in section V-A, is applied to the datasets. Then, the feature selection method presented in section ?? is applied to both the UNSW-NB15 and the NSL-KDD datasets. Table I shows the final subsets of relevant features used in the experiment. TABLE I.
A. Performance metrics The main purpose of the ADDM is to classify the captured network flow data as either positive or negative which correspond respectively to DoS traffic and normal traffic. The confusion matrix has four categories: True positives (TP) are examples correctly labeled as positives. False positives (FP) refer to negative examples incorrectly labeled as positive. True negatives (TN) correspond to negatives correctly labeled as negative. Finally, false negatives (FN) refer to positive examples incorrectly labeled as negative. The experimental results of the ADDM are evaluated using the following performance metrics:
FPR + FNR 2
R ELEVANT F EATURES S ELECTED FOR DD O S D ETECTION Dataset
CFS subset
UNSW-NB15
F7,F10,F11,F12,F18,F32
NSL-KDD
F6,F11,F19,F23,F26
VII.
R ESULTS AND D ISCUSSION
A. DoS detection performances In order to evaluate the performances of the ADDM and u-MLP both datasets UNSW-NB15 and NSL-KDD are used. The obtained testing results are compared with the findings in the related works [15], [17], [18], [13]. Table 2 summarizes the obtained results and the performed comparisons. It is obvious that the ADDM has the highest testing accuracy rates in the shortest period of time: 97.1% on UNSW-NB15 in 0.46s and 99.2% on NSL-KDD in 0.35s. Whereas, the uMLP achieved 79.2 on UNSW-NB15 in 3.05s and 83.5% on NSL-KDD in 2.16s.The remain DoS detection accuracy rates of DDMA, NSL-ANN, HSV-ANN and ANN are respectively 98%, 81.2%, 92% and 81.34%. The applied optimizations techniques on the ADDM have improved significantly the DoS detection accuracy rate. The shortest DoS detection time intervals are 0.46s and 0.35s which correspond to the ADDM. The feature selection phase has enabled the ADDM to reduce drastically the DoS detection time. Overall, these experimental results agree well with our expectation, i.e., the optimization techniques applied on the ADDM improve the DoS detection
www.ijacsa.thesai.org
469 | P a g e
(IJACSA) International Journal of Advanced Computer Science and Applications, Vol. 8, No. 4, 2017 TABLE II.
T HE T ESTING P ERFORMANCES OF THE ADDM C OMPARED WITH U -MLP, DDMA[18], NSL-ANN[15], HSV-ANN[17] AND ANN[13]
Method
Testing accuracy rate (%)
Testing time (s)
Dataset
Sensitivity Specificity FAR (%) (%) (%)
ADDM
97.1 99.2
0.46 0.35
UNSW-NB15 NSL-KDD
97 99
100 100
0.06 0.02
u-MLP
79.2 83.5
3.05 2.16
UNSW-NB15 NSL-KDD
82 90
87 93
0.14 0.11
DDMA
98
NA
Local dataset
96
100
NA
NSL-ANN
81.2
NA
NSL-KDD
0.96
0.70
0.32
HSVANN
92
NA
KDDCup 99
NA
NA
0.15
ANN
81.34
NA
UNSW-NB15
NA
NA
21.13
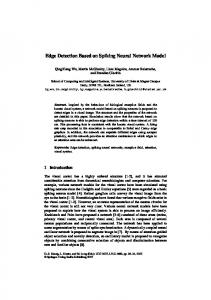
From a set of redundant features only one feature is selected. This implies selection of different distributions of features for each value of δ. In order to determine the preference value of δ which corresponds to the optimum dataset that produces high accuracy rate, for each dataset the ADDM was fitted with the obtained subsets corresponding to each value of δ. The threshold value that corresponds to the highest accuracy rate of ADDM is then selected. Figure 5 summarizes the conducted experiment results to select the optimum value of δ, it shows the ROC curves of the ADDM fitted with different feature subsets for each value of δ. It is obvious that the value δ = 0.4 corresponds to the highest accuracy rate of ADDM. A dataset of relevant features is then selected, as shown in table 1 section VI-B. ADDM ROC curve for different PCC Threshold values 1.0
1.0
True Positive Rate
0.8
True Positive Rate
0.8
0.6
0.6
0.4
0.4
ADDM ROC on NSL-KDD (AUC=0.992) ADDM ROC on UNSW-NB15 (AUC=0.971) 0.0 0.0
ADDM ROC - delta = 0.2 (AUC = 0.988) ADDM ROC - delta = 0.4 (AUC = 0.997) ADDM ROC - delta = 0.6 (AUC = 0.911) ADDM ROC - delta = 0.8 (AUC = 0.907)
0.2
0.2
0.2
0.4
0.6
0.8
0.0 0.0
1.0
0.2
False Positive Rate
0.4 0.6 False Positive Rate
0.8
1.0
(a) Fig. 5.
1.0
ADDM ROC curves correspond to different PCC threshold values
True Positive Rate
0.8
0.6
C. Finding the optimam number of hidden units
0.4
TABLE III. ADDM T RAINING AND T ESTING P ERFORMANCES AGAINST THE N UMBER OF H IDDEN U NITS OF THE MLP
0.2
u-MLP ROC on NSL-KDD (AUC=0.835) u-MLP ROC on UNSW-NB15 (AUC=0.792) 0.0 0.0
0.2
0.6
0.4
0.8
Number of hidden units of the MLP
1.0
3
4
5
6
7
8
9
10
0.88
092
0.94
0.95
0.97
0.96
0.95
0.95
Avg of loss
0.058
0.057
0.054
0.051
0.047
0.048
0.050
0.052
Train time(s)
2.511
2.855
3.201
3.016
3.128
3.035
3.253
3.647
Test time(s)
0.461
0.479
0.473
0.484
0.466
0.471
0.766
0.798
Fig. 4. ROC curves summarizing the DoS detection performances of ADDM (a) and u-MLP (b).
performances and the processing time. The ROC curve of the ADDM and the u-MLP are plotted in figures 4(a) and 4(b) respectively. The experimental results obtained in the testing phase are used to plot the ROC curves in order to better understand the trade-of between the TPR and the FPR of the ADDM and the u-MLP. Figures 4(a) and 4(b) depict that the ADDM has high true positive rate with fewer false alarms. Whereas, the u-MLP has lower true positive rate and high false alarm rate that exceeds 15%. The ADDM acquired the highest AUC values. B. Optimum PCC Threshold Selection Feature selection aims at selecting a set of relevant features from the original dataset. Eliminating the redundancy allows to reduce the dataset dimension, which improves the ADDM processing time. While, using relevant features improves the ADDM accuracy. The PCC threshold value ρ is used to find high correlated features that contain redundant information.
UNSW-NB15
(b)
Avg of acc
NSL-KDD
False Positive Rate
Avg of acc
0.92
0.96
0.97
0.99
0.98
0.98
0.96
0.95
Avg of loss
0.034
0.029
0.024
0.023
0.25
0.026
0.032
0.045
Train time(s)
1.82
1.91
2.03
2.16
2.25
2.37
2.53
2.72
Test time(s)
0.35
0.38
0.42
0.51
0.56
0.62
0.73
0.88
Here, we aim to explain the process used to find the optimum number of hidden units which produces high performances of the ADDM in less period of time. This is not known in advance, and must be determined by experiment. To tackle this problem for each dataset ADDM was fitted with the subsets of relevant features that corresponds to the PCC threshold δ = 0.4 as mentioned in the previous section. Eight numbers of hidden units are considered to collect the average of accuracy, the average of loss, the training time and the testing time of the ADDM. The numbers of hidden units used are 3, 4, 5, 6, 7, 8, 9, and 10. Table 3 summarizes the obtained results for each number of hidden units. As shown in table 3, the lower periods of training and testing time of the ADDM
www.ijacsa.thesai.org
470 | P a g e
(IJACSA) International Journal of Advanced Computer Science and Applications, Vol. 8, No. 4, 2017 corresponds to three hidden units. The ADDM training and testing time appear to fluctuate with the increase of the number of the hidden units. Whereas, the highest average of the testing accuracy and the lower average of loss are reached when seven hidden units are used. For these reasons, we used seven units in the hidden layer of the basic MLP of the ADDM. At the end, we concluded that the performances of the ADDM are sensitive to the parameters δ and the number of hidden units. VIII.
[11]
[12]
[13]
C ONCLUSION
In this paper we have presented a detection method of the DoS attack based on ANN, named ADDM. A multi-layer perceptron was optimized to improves the detection accuracy and the detection time of the proposed method. For the experiments two public datasets are used, the UNSW-NB15 and the NSL-KDD. An unsupervised correlation-based feature selection method is used to select relevant features. Several experiments were conducted to evaluate the impact of the optimization techniques and the feature selection method on the ADDM performances.
[14]
[15]
[16]
[17]
ADDM was compared with an unoptimized MLP (u-MLP) and other methods in the literature. The experiment results are in accordance with the hypothesis that application of the optimization techniques improves the learning performances of the basic MLP of ADDM. Furthermore, we notice that the feature selection phase reduces drastically the dataset dimension which improved the training and detection time of the ADDM.
[18]
For future works we intend to upgrade the ADDM to detect accurately other network attacks. Also, we are working on integrating the ADDM in a real world implementation.
[21]
R EFERENCES
[23]
[1]
J. Mirkovic and P. Reiher, “A taxonomy of ddos attack and ddos defense mechanisms,” ACM SIGCOMM Computer Communication Review, vol. 34, no. 2, pp. 39–53, 2004. [2] V. Bukac and V. Matyas, “Analyzing traffic features of common standalone dos attack tools,” in International Conference on Security, Privacy, and Applied Cryptography Engineering. Springer, 2015, pp. 21–40. [3] C. Douligeris and A. Mitrokotsa, “Ddos attacks and defense mechanisms: classification and state-of-the-art,” Computer Networks, vol. 44, no. 5, pp. 643–666, 2004. [4] S. Bassis, A. Esposito, and F. C. Morabito, Advances in Neural Networks: Computational and Theoretical Issues. Springer, 2015, vol. 37. [5] S. Marsland, Machine learning: an algorithmic perspective. CRC press, 2015. [6] P. Flach, Machine learning: the art and science of algorithms that make sense of data. Cambridge University Press, 2012. [7] A. Brabazon, M. O’Neill, and S. McGarraghy, Natural computing algorithms. Springer, 2015. [8] K.-J. Kim and H. Ahn, “Simultaneous optimization of artificial neural networks for financial forecasting,” Applied Intelligence, vol. 36, no. 4, pp. 887–898, 2012. [9] F. Iglesias and T. Zseby, “Analysis of network traffic features for anomaly detection,” Machine Learning, vol. 101, no. 1-3, pp. 59–84, 2015. [10] H. F. Eid, A. E. Hassanien, T.-h. Kim, and S. Banerjee, “Linear correlation-based feature selection for network intrusion detection model,” in Advances in Security of Information and Communication Networks. Springer, 2013, pp. 240–248.
[19]
[20]
[22]
[24] [25]
[26]
[27] [28]
[29] [30] [31]
M. Tavallaee, E. Bagheri, W. Lu, and A. A. Ghorbani, “A detailed analysis of the kdd cup 99 data set,” in Computational Intelligence for Security and Defense Applications, 2009. CISDA 2009. IEEE Symposium on. IEEE, 2009, pp. 1–6. N. Moustafa and J. Slay, “Unsw-nb15: a comprehensive data set for network intrusion detection systems (unsw-nb15 network data set),” in Military Communications and Information Systems Conference (MilCIS), 2015. IEEE, 2015, pp. 1–6. ——, “The evaluation of network anomaly detection systems: Statistical analysis of the unsw-nb15 data set and the comparison with the kdd99 data set,” Information Security Journal: A Global Perspective, vol. 25, no. 1-3, pp. 18–31, 2016. C. Siaterlis and V. Maglaris, “Detecting incoming and outgoing ddos attacks at the edge using a single set of network characteristics,” in 10th IEEE Symposium on Computers and Communications (ISCC’05). IEEE, 2005, pp. 469–475. B. Ingre and A. Yadav, “Performance analysis of nsl-kdd dataset using ann,” in Signal Processing And Communication Engineering Systems (SPACES), 2015 International Conference on. IEEE, 2015, pp. 92–96. V. Akilandeswari and S. M. Shalinie, “Probabilistic neural network based attack traffic classification,” in 2012 Fourth International Conference on Advanced Computing (ICoAC). IEEE, 2012, pp. 1–8. A. Ammar and K. Al-Shalfan, “On attack-relevant ranking of network features,” International Journal of Advanced Computer Science & Applications, vol. 1, no. 6, pp. 229–236. A. Saied, R. E. Overill, and T. Radzik, “Detection of known and unknown ddos attacks using artificial neural networks,” Neurocomputing, vol. 172, pp. 385–393, 2016. S.-C. Lin and S.-S. Tseng, “Constructing detection knowledge for ddos intrusion tolerance,” Expert Systems with applications, vol. 27, no. 3, pp. 379–390, 2004. V. Bol´on-Canedo, N. S´anchez-Maro˜no, and A. Alonso-Betanzos, “A review of feature selection methods on synthetic data,” Knowledge and information systems, vol. 34, no. 3, pp. 483–519, 2013. G. Chandrashekar and F. Sahin, “A survey on feature selection methods,” Computers & Electrical Engineering, vol. 40, no. 1, pp. 16–28, 2014. M. Dash and H. Liu, “Consistency-based search in feature selection,” Artificial intelligence, vol. 151, no. 1-2, pp. 155–176, 2003. M. A. Hall, “Correlation-based feature selection for machine learning,” Ph.D. dissertation, The University of Waikato, 1999. W. H. Press, S. A. Teukolsky, W. T. Vetterling, and B. P. Flannery, Numerical recipes in C. Cambridge Univ Press, 1982, vol. 2. L. Bottou, “Large-scale machine learning with stochastic gradient descent,” in Proceedings of COMPSTAT’2010. Springer, 2010, pp. 177–186. D. R. Wilson and T. R. Martinez, “The general inefficiency of batch training for gradient descent learning,” Neural Networks, vol. 16, no. 10, pp. 1429–1451, 2003. G. B. Orr and K.-R. M¨uller, Neural networks: tricks of the trade. Springer, 2003. Y. A. LeCun, L. Bottou, G. B. Orr, and K.-R. M¨uller, “Efficient backprop,” in Neural networks: Tricks of the trade. Springer, 2012, pp. 9–48. X. Glorot and Y. Bengio, “Understanding the difficulty of training deep feedforward neural networks.” in Aistats, vol. 9, 2010, pp. 249–256. F. Chollet, “Keras,” 2015. J. Bergstra, O. Breuleux, F. Bastien, P. Lamblin, R. Pascanu, G. Desjardins, J. Turian, D. Warde-Farley, and Y. Bengio, “Theano: A cpu and gpu math compiler in python,” in Proc. 9th Python in Science Conf, 2010, pp. 1–7.
www.ijacsa.thesai.org
471 | P a g e