This paper demonstrates how to introduce computational fluid dynamics (CFD) to
under- ... projects, and beginning graduate students have used it in the fluid ...
On the Proper Use of Computational Fluid Dynamics for Senior Research Projects and Beginning Graduate Fluid Mechanics Courses Bruce A. Finlayson Rehnberg Professor of Chemical Engineering University of Washington Seattle, WA 98195-1750
[email protected]
Abstract This paper demonstrates how to introduce computational fluid dynamics (CFD) to undergraduates in a research setting and graduate students in a beginning fluid mechanics course. Of course the students must learn to use the CFD program, but FEMLAB™ has made that very easy. Thus, the burden is on the user and instructor to insure that the students have a way to validate their results. Shown here are the preliminary steps the author has used: • solving simple problems to compare with textbook examples; • learning to make the equations non-dimensional and report the results in a consistent, meaningful manner; • using mesh refinement to validate the numerics; • comparing results to published and known results. Also shown here are some of the remarkable results achieved: • pressure coefficients for slow flow to augment those for turbulent flow; • entry length and approach length correlations to enlarge the body of design information; • orifice calculations to correct errors in the literature; • calculations to help graduate students estimate (and then calculate) the impact of assump tions; • examination of patents in microfluidics.
Introduction Computational Fluid Dynamics (CFD) programs are getting better and better (i.e. easier to use) and it is important to teach students what they can do, and what they cannot do. This paper will describe experience using a CFD program that is particularly easy to use, FEMLAB™. Undergraduate chemical engineering students at the University of Washington have used this in senior research projects, and beginning graduate students have used it in the fluid mechanics course. When the material is presented sequentially, and the professor has some knowledge of CFD (to get out of tight spots), students can learn to solve the problem they want to solve, document that process, and assess the accuracy of their solution independent of any experiment. Because of the recent interest in microfluidics, most simulations are for laminar flow, at a variety of Reynolds numbers.
Undergraduate Research Projects The procedure for teaching students how to use CFD programs is described. An essential element of the process is to make the steps small and manageable, with the eventual goal clearly specified. A sample goals statement is given in Figure 1 for a beginning researcher and Figure 2 for someone who has worked with me in previous quarters. Figure 1. Predicting Pressure Drop across Orifices in Laminar Flow Ch.E. 499 Project for Febe Kusmanto, Sp, 2002 The goal is to predict the pressure drop across orifices when the flow is laminar. This project continues one started last spring. The published literature has a mistake in it (the student last year found this, with help from me). We want to prepare a good summary of what the data should look like, based on an old paper (which I have, from the Journal of Fluid Mechanics, JFM), and then do numerical calculations as a function of thickness of the orifice and Reynolds number to further validate our results. If done well, this could lead to a published paper. The beginning steps will be: 1. Learn to use pde toolbox on the PCs in 125 2. Run some example cases using FEMLAB in BNS 125 3.Learn to nondimensionalize the equations, and transfer between computer results, dimensionless results, and dimensional results. 4. Set up the problem in FEMLAB, for flow in a cylinder with an orifice of finite thickness. Solve it as a function of Reynolds number, for different thicknesses (from the paper). 5. Prepare correlations of the dimensionless pressure drop versus Reynolds number, for different geometries. Compare with the JFM paper and with the experimental data (and also with the bogus report.) 6. Write a final report, convert to PowerPoint presentation, prepare Web display.
The second step is to learn to use the program. The programs are demonstrated by the instructor, and a handout is given for the program pdetool™ (which operates on top of Matlab™ and was a precursor to FEMLAB™), as shown in Figure 3. With this demo and handout, all students, undergraduate and graduate, have been able to use the programs successfully, without instructor help.
Figure 2. Mixing of Miscible Fluids in Microfluidic Devices Ch.E. 499 Project for Marlina Lukman, Spring, 2002 The overall goal this quarter will be to study the mixing of miscible fluids in microfluidic devices. Conceptually, consider two different fluids coming in the two ports of a ‘T’. Then they flow down together through the stalk of the ‘T’. Since they are miscible, they will diffuse into each other. When the fluids have different viscosities, one must use a mixing rule to determine the viscosity as a function of concentration. We will do this and compare mixing with and without these mixing rules. This is an outline of the objectives/tasks: 1. For a ‘T’ mixer in planar geometry, solve for flow when the physical properties of the two fluids are the same. 2. Add diffusion to that. 3. Using correlations and books, develop a mixing rule for two chemicals. 4. Solve the problem when the viscosities and densities are a function of concentration. 5. As time permits, see how this mixing is enhanced as the Reynolds number changes, as the ratio of viscosities changes, as the density ratio changes. 6. Write a final report, convert to PowerPoint presentation, prepare Web display. Together we will have to decide what chemicals we want to use, and the best mixing rule.
Figure 3. Ch. E. 475 - Tutorial for using Matlab/PDE Toolbox to solve elliptic boundary value problems Open Matlab and give the command pdetool. (This only works if one has the professional version with pde toolbox. This is installed in BNS 125.) draw click on the square icon and draw a rectangle for the inner rectangle, do again to make a hole, use R1 – R2 double click on the object to set exact dimensions boundary mode - choose ∂Ω icon click on one boundary or shift click on all boundary segments with the same boundary condition double click on the last one, and set the boundary condition mesh click once on triangle icon click on divided triangle icon to refine the mesh
pde choose specification - to check the differential equation = click on = to solve the problem plot set parameters to choose the type of plot You can go back and refine the mesh (click the more refined mesh symbol) and resolve the problem. This gives you an indication of the accuracy of the solution. If you want detailed information about the solution, you must save the solution to the MATLAB command workspace (it is called u), and save the element information (it is called p e t). Save your work frequently!
Shown in Figures 4 and 5 are two problems that are assigned. The student is to solve them, make plots of them, and report back to the instructor. This exercise gives the student confidence, since they are able to solve the problems, although maybe the comparison to their textbook is difficult the first time. It also gets them ‘over the hump’ on how to access the program, use it, save their results, print figures, etc. A printed copy of the mesh is always required, to emphasize the importance of mesh refinement. Figure 4 involves geometries that are not quite square, and boundary conditions that are not uniform. Figure 5 involves cylindrical geometry.
Figure 4. Heat Transfer Problem
Figure 5. Flow in Capillary The next lesson that must be learned is how to make the equations nondimensional, and how to report results that others can use. My checklist is: • What velocity is 1.0 in the computer? • What distance is 1.0 in the computer? • What boundary conditions did you use? • What is the Reynolds number, and where did you use it (see below)? The Navier-Stokes equations are
ρ u • ∇ u = − ∇ p + µ ∇2 u To make them non-dimensional, we divide each quantity by a standard dimension, denoted by the subscript s.
u' =
u , us
p' =
p − p0 , ps
x' =
x , xs
∇' = xs ∇,
∇'2 = xs ∇ 2
The primed variables have no dimensions. The standard dimensions are constants, and hence carry through any differentiation operation. Substituting for u and p in the Navier-Stokes equations gives
2
ρ us ps µ us 2 u' • ∇ ' u' = − ∇ ' p' + ∇' u' 2 xs xs x s
There are now two versions for the next steps, the first one natural for laminar flow and the second one natural for turbulent flow. In version 1, for laminar flow
Divide by
µ us x2s
,
use
ps xs =1 µ us
ρ us xs 2 u' • ∇ ' u' = − ∇ ' p1 ' + ∇' u' µ Re =
ρ us xs µ us , ps = µ xs
and the equation is
2 Re u' • ∇ ' u' = − ∇ ' p1 ' + ∇' u' Here the pressure from the computer (the primed variable) is multiplied by the viscosity times the standard velocity and divided by the standard distance to obtain the real pressure in Pascals, e.g. The reason this form of nondimensionalization is useful for laminar flow (particularly for microfluidic flows) is that for small Reynolds number the whole solution is independent of Reynolds number, including the dimensionless pressure drop. (The actual transition where Reynolds must be taken into account depends upon you accuracy standards: Re ≤ 0.1 is good enough, Re = 1 may be, and Re = 10 has some effect of the Reynolds number.) In version 2, for turbulent flow ρ u2s Divide by , xs
use
u' • ∇ ' u' = − ∇ ' p2 '+ Re =
ps ρ u2s
=1
µ ∇'2 u' ρ us xs
ρ us xs 2 , ps = ρ us µ
and the equation is u' • ∇ ' u' = − ∇ ' p2 '+
1 2 ∇' u' Re
Here the pressure from the computer (the primed variable) is multiplied by the density times the standard velocity squared to obtain the real pressure in Pascals, e.g. The reason this form of the nondimensionalization is useful for turbulent flow is that at high Reynolds number the pressure is proportional to density times velocity squared, and thus the dimensionless pressure drop is a constant. (The actual transition where this is true, though, is an extremely high Reynolds number, say 106, but it is a useful rule of thumb.)
The equations in the computer are given as ρ u • ∇ u = − ∇ p + η ∇2 u Either ρ = Re and η = 1 or ρ = 1 and η =
1 Re
determines how p is converted to real numbers. A convenient way to differentiate between the computer variables and other formulations is to write the equations in the following form.
2
ρc uc • ∇ c u c = − ∇ c pc + ηc ∇ c uc The next lesson to be learned is how to present your results. Students are accustomed to calculating the Reynolds number based on the average velocity in a pipe and diameter of a pipe. What do you do if you make the standard distance the radius of the pipe, i.e. your computer geometry goes from zero at the centerline to 1.0 at the wall? Students need to learn how to take the computer results and change them into the conventions we all use. One example that is helpful in doing that is the following: suppose we have two pipes coming together to join and go down a single pipe. What is the Reynolds number? Obviously, how one presents this case is a matter of convention, since one can talk about the Reynolds number in each of three pipes. Once that problem is posed, students understand that the conditions must be specified very clearly. This brings back my checklist: • What velocity is 1.0 in the computer? (This is the standard velocity, and can be converted to words.) • What distance is 1.0 in the computer? (This is the standard distance, and can be converted to words.) • What boundary conditions did you use? (This helps define the problem.) • What is the Reynolds number, and where did you use it? (This determines how to go from the computer pressure to the real pressure.) In a group meeting, we go through some examples in which the computer conditions and results are given, and the students are asked to give the average velocity in m/s, the diameter in m, and the pressure (in Pascals) once enough information is given to do so. While I’ve never done so, it would be instructive to assign the problem of solving the same problem using the two different formulations and showing that the velocities are the same, the dimensionless pressure drops are different, but the pressure drop derived in Pascals is the same. Now the students are ready to solve 2D and 3D flow problems. The last topic to understand is mesh refinement. Early in the program, the instructor decided not to worry about explaining the finite element method, but to emphasize the fact that the results are an approximation which gets better the more elements there are. Consequently, students were asked to compute the same problem with different meshes and report how some aspect (like pressure drop)
changed. Now a PowerPoint presentation is given about the finite element method in order to give students a better idea of how the problem is solved; this does not go deeply into the details of the Galerkin method (which requires the divergence theorem and 2D/3D math). Typical mesh refinements from FEMLAB are shown in Figure 6.
Figure 6. Three meshes
Sample Results from Undergraduate Research Projects Results are shown here that were derived by undergraduate students: pressure coefficients in 2D/3D situations, pressure drops across orifices with finite width, entry and approach lengths in contraction flows, and flow and diffusion with a concentration-dependent viscosity. Shown in Figure 7 is a page from Bird, Stewart, Lightfoot [1]. It shows the viscous dissipation coefficient for pressure drop in turbulent flow. This coefficient is similar to the pressure coefficient described below. To calculate the overall pressure drop for turbulent flow in a piping network, one combines the pressure drop for flow through straight pipe with the pressure drop through the bends, valves, and contractions, etc. Undergraduates working with me are developing the same information for laminar flow. Notice that the viscous dissipation coefficient naturally goes with the second form of nondimensionalization, since it is normalized with respect to velocity squared. Figure 8 shows how the pressure coefficient is defined in the two cases. Figure 9 shows how that coefficient will vary with Reynolds number in the two cases, the left one using as pressure standard the viscosity times velocity over distance, and the right one using one half the kinetic energy. (All these are for laminar flow). The pressure contours in a rounded corner (between flexible flat plates) is shown in Figure 10. The pressure loss is divided into three parts: the pressure drop in the straight pipe before the bend, the pressure drop in the straight pipe after the bend, and the pressure drop in the bend. The pressure drop in the bend is correlated with the parameters of the problem as shown in Figure 11. Three-dimensional cases can be done, too, but the computer network at the University of Washington is quite old, and slow. Thus, it is important to be able to learn essential things on good
Figure 7. Friction Loss Factors, from BSL
At high Re : Ex : for 90o elbows At low Re :
∆P = K ρ 2/2 K = 0.75 ∆P = K µ /xs
non-dimensionlize: ∆P’ps = K µ /xs us’ choose ps = µ us /xs :
∆P’= K ’
Figure 8. Definition of Pressure Coefficient
3
10
2
Data Organized for Slow Flows
K2
K1
10
TextEnd
10
10
4
10
3
10
2
Data Organized for High Speed Flow
TextEnd 10
1
10
0
10
-1
1
0
10 10-3
10 -2
10 -1
10 0 Re
10 1
10 2
10 3
Slow Flow Correlation
10-3
10-2
10-1
100 Re
10 1
102
103
Fast Flow Correlation
Figure 9. Two correlations of the same pressure drop
Figure 10. Pressure Contours in Rounded Corner (due to Suwimol Kunaridtipol
∆p’ = ∆p’(total) - ∆p’(entry) - ∆p’(exit) = 99.7 - 36 - 36 = 27.7 ∆p’ = K ’, ’ = 1 K = 27.7 Figure 11. Pressure Coefficient of Rounded Corner (due to Suwimol Kunaridtipol
2D problems that contain the essence of the problem. Once one is ‘certified’, 3D problems can be solved. Shown in Figure 12 are some geometries that were studied in conjunction with a small, local start-up company. The flow came up from the bottom, went down a square channel, and exited up or down. To determine the pressure drop in each device, the flow elements shown in Figure 13 suffice. One example calculation is shown in Figure 14.
Figure 12. Flow Geometries
Figure 13. Flow Elements for Pressure Drop Calculations
Figure 14. Flow in 90 degree corner, square channel (due to Marlina Lukman)
Figure 15. Pressure contours in Flow through Orifice (due to Febe Kusamanto)
The next case is flow through an orifice when the thickness of the orifice is appreciable. Figure 15 shows the pressure profile from one simulation. An exact solution exists for slow flow, as shown in Figure 16. Essentially, the exact solution gives the value of K1 in the correlation above it. The exact solution shows that the thickness of the orifice matters, even in slow flow. A comparison of calculated results with experimental ones is shown in Figure 17, and clearly the curve depends upon the thickness, L, in both the calculations and experiment. The experimental data [2] found that the pressure drop depended on the thickness, but misinterpreted the theory [3] at slow flow. Hasagawa, et al.reported the theory had no dependence on thickness. They also did calculations with another CFD program, FIDAP, and found no dependence on thickness either. Both results contradicted their data, and this discrepancy is widely reported to indicate that the Navier-Stokes equations are not valid when the capillary is small, with a diameter in the range of a few microns. The calculations reported here, which agree quite nicely with the experiments and theory [3], refute that contention. Being able to make the equations nondimensional and interpret the computer results is obviously an important skill.
K1 2 ∆p = K + 2 2 Re ρU 2 ∆p 64 L 12 π 2 = Re D + Re ρU
Figure 16. Exact Solution for Pressure Drop for Flow Through an Orifice
Figure 17. Pressure Coefficient for Orifice Flow (due to Febe Kusamanto)
Figure 18. Centerline Velocity for 4:1 Contraction in Cylinder (due to Trevor Plaisted) The next example is one for entry length in a 4:1 cylindrical contraction. The velocity starts to rearrange upstream, as shown in Figure 18, and this rearrangement occurs further upstream at low Reynolds number. Thus, it is important to correlate that ‘approach length’. Then if one looks at the contraction, the flow has partially rearranged as it enters the small section. Thus, it makes no sense to use an entry length correlation obtained by assuming the velocity profile is flat at entrance to the small pipe. The correlation is of the same form, with different constants.
Xe = 0.278 + 0.0968 Re D
Figure 19. Diffusion as a Function of Peclet Number (due to Marlina Lukman)
H
c¯ = 2
∫−H. , H u dy ∫−H.
H
c u dy
2
σ
∫ −H =
2 (c − c¯) u dy H
∫−H u dy
2
σ = 0 is good mixing, σ = 0.25 is bad mixing The final example is one involving diffusion and mixing. The question was posed: what happens when two miscible liquids come together. How is the diffusion and mixing affected when the viscosity depends upon concentration? Typical cases are shown in Figure 19 and show the effect of Peclet number. In order to quantify the mixing, we used the following definitions. The results are shown in Figure 20. Notice that the viscosity depends upon the concentration, and this is easy to achieve in FEMLAB. One merely types the formula shown in a GUI box. It was surprising to us that the variance was so similar under different conditions.
Figure 20. Variance for Mixing of Miscible Liquids (due to Marlina Lukman)
Beginning Graduate Fluid Mechanics The learning curve is the same for graduate students, but it is traversed more rapidly with less detailed help. Here we describe the experience using a CFD program in a beginning fluid mechanics class. The goal was to expand the students’ horizons beyond the simple cases described in their textbook, which were solved analytically. Thus, two projects were assigned. The first project used the geometry shown as a prop. (Figure 21 and 22) The problem was reduced to a two-dimensional problem so that the student groups could work efficiently using the old, slow PCs provided by the
Figure 21. Three D View of Object
Figure 22. Side View of Object
University of Washington. The project assignment is described in Figure 23. Figure 23. Ch.E. 530 - Fluid Mechanics and Transport - Projects - Winter, 2002 Text: Analysis of Transport Phenomena, William M. Deen, Oxford Univ. Press, 1998; required. Course Web Page: http://courses.washington.edu/che530/ Course List Process (send a message to entire class)
[email protected] Project One. Your team is to analyze the fluid flow in the device shown. Your final report and presentation should include quantitative estimates (before you do the finite element calculations) of: entry length in region A entry length in region B temperature rise if the device is adiabatic how long it takes to reach steady state after a disturbance or change of conditions pressure drop from inlet to exit If half of the inlet is red (left half, c = 0) and half is yellow (right half, c = 1), what will be the concentration distribution coming out? Use a diffusivity of 3.4 x 10⁻⁶ cm2/sec. After making these quantitative estimates, solve the problem(s) in FEMLAB and compare the quantitative predictions with the calculations. Do the same thing without making the no-slip assumption on the solid walls. How do the solutions differ?
The students estimated these phenomena using the classical, analytic solutions for simple cases, and then the full 2D situations were calculated including all the phenomena to test their ability to estimate or bound the effects. After mistakes were corrected, the students found that they could in fact estimate the importance of all these phenomena. This is a useful skill for their graduate work, since it shows them that they do not have to model everything and can focus on what matters most, and sometimes they can eliminate certain phenomena using simple, analytical cases. FEMLAB™ has the convenient feature of being able to integrate algebraic formula over the domain or boundaries; what is especially nice is the ability to just type in the formula and get the result immediately. Thus, the viscous dissipation can be integrated over the domain provided they can copy the formula from their book to the computer. In fact, any expression can be integrated over the domain or a boundary. Once the student teams understood what was possible with CFD, the second project was assigned: model an aspect of a patent in the microfluidic field. In this project, students looked at diffusion and mixing (including Taylor-Aris diffusion), did transient problems, and prepared movies of the transient problems. The second project assignment is in Figure 24. Figure 24. Project Two. For the patent you were assigned, design a flow problem illustrating some aspect of the patent. Schedule for projects: March 1: present a written and oral report on Project One, given above. Feb. 26: propose the problem for Project Two. Mar. 13, 15: oral presentations of Project Two; written report due Mar. 15.
Typical patents are shown in Figures 25-28. The students were asked to read the patent and suggest a problem to solve; this was discussed with the instructor to insure a reasonable problem that could be solved in the time available.
Figure 25
Figure 26 Figure 25
Figure 27
Figure 28
Figure 29. Optical Detection Device
Figure 29. Optical Detection Device
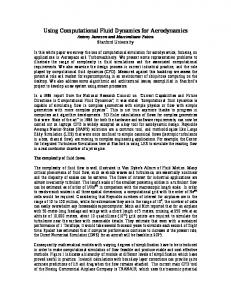
Figure 30. Flow Profile in Optical Detection Device A sample problem statement and results are shown in Figure 29 and 30. Whenever students are asked to use CFD, they are always cautioned to look carefully at their results to insure that there aren’t any artifacts (in addition to doing mesh refinement). This group noticed something unusual. Figure 31 shows three concentration plots. The students noticed that when the diffusivity became smaller, the concentration plots became highly irregular (the color imitates a flower!). At this point the instructor could teach them (and the class) about numerical dispersion, the need for mesh refinement, and the criterion for eliminating the bogus oscillations when no numerical dispersion is added, and when some is added. The group did get high marks for noticing the effect, even if they didn’t initially know what to do. They then looked at design questions, like varying the pathlength, as illustrated in Figure 32.
FEMLAB Choices: Diffusivity
Concentration
Effect of Diffusivity (mm 2 /s) on Concentratio n
1 0.9 0.8 0.7 0.6 0.5 0.4 0.3 0.2 0.1 0 -0.1 -0.2
1.00E-03 1.00E-04 1.00E-05 1.00E-06
0
0.5
1
1.5
2
2.5
3
3.5
4
4.5
Time (s)
•Mesh: Unrefined Figure 31. Concentration Solutions for Different Diffusivities
Varying Pathlength
Concentration
Effect of Varying Pathlength 1 0.9 0.8 0.7 0.6 0.5 0.4 0.3 0.2 0.1 0
.5 1 1.5 2
0
0.5
1
1. 5
2
2.5
3
Time (s)
Figure 32. Signal for Different Pathlengths
3. 5
4
Part 1-Theoretical model no diffusion, full-slip, steady sta vθ = r. ω where r = R2 – x vθ = (x + R1) ω ω constant: R2
d
∫v 0
0
dx = ∫ ωrdr R1
Mass conservation Figure 33. Due to Kevin Dornfeld, Alex Holland, Daniel Ramrus, Sylvie Theas
Another group modeled flow in a serpentine. In order to approximate some aspects of electro-osmotic flow, we assumed that perfect slip occurred at the boundary. The program FEMLAB allowed the students to specify that the normal velocity on a boundary was zero. This group also noticed an anomaly. At the exact corner, there seemed to be fluid leaving the device (see Figure 33). The instructor named this a pin-hole leak. After some consternation, and consultation with the support personnel, we discovered the reason: when the finite element method is used on a curved surface in some formulations, the normal to the surface is calculated at Gauss points, but not in between. The end result is that small errors in the normal to a curved surface can lead to small velocities ‘through the surface’. This group also got high marks for noticing an anomaly. Naturally, the students were interested in seeing what happened to a slug of material going through their device, and they did transient simulations as well.
Student Interest and Benefits Students showed great interest in using CFD. The color pictures are great motivators, and successful completion of the projects give students a real sense of accomplishment. The importance of validation was emphasized over and over so that they leave with that important lesson. The most important lesson required the continuing reinforcement of the necessity to solve the right problem with known accuracy, and to convince their instructor of that accuracy.
References 1. Bird, R. B., Stewart, W. E., and Lightfoot, E. N., Transport Phenomena, Wiley (1960). 2. Hasagawa, T., Suganuma, M., Watanabe, H., “Anomaly of excess pressure drops of the flow through very small orifices,” Phys. Fluids 9 1-3 (1997). 3. Dagan, Z., Weinbaum, S. and Pfeffer, R., “An infinite-series solution for the creeping motion through an orifice of finite length,” J. Fluid Mech. 115 505-523 (1982).