On the Reliability and Intuitiveness of Aggregated Search Metrics Ke Zhou
Mounia Lalmas
Tetsuya Sakai
University of Glasgow Glasgow, United Kingdom
Yahoo! Labs Barcelona, Spain
Waseda University Tokyo, Japan
[email protected] [email protected] [email protected] Ronan Cummins Joemon M. Jose University of Greenwich London, United Kingdom
University of Glasgow Glasgow, United Kingdom
[email protected]
[email protected]
ABSTRACT Aggregating search results from a variety of diverse verticals such as news, images, videos and Wikipedia into a single interface is a popular web search presentation paradigm. Although several aggregated search (AS) metrics have been proposed to evaluate AS result pages, their properties remain poorly understood. In this paper, we compare the properties of existing AS metrics under the assumptions that (1) queries may have multiple preferred verticals; (2) the likelihood of each vertical preference is available; and (3) the topical relevance assessments of results returned from each vertical is available. We compare a wide range of AS metrics on two test collections. Our main criteria of comparison are (1) discriminative power, which represents the reliability of a metric in comparing the performance of systems, and (2) intuitiveness, which represents how well a metric captures the various key aspects to be measured (i.e. various aspects of a user’s perception of AS result pages). Our study shows that the AS metrics that capture key AS components (e.g., vertical selection) have several advantages over other metrics. This work sheds new lights on the further developments and applications of AS metrics. Categories and Subject Descriptors: H.3.3 [Information Search and Retrieval] Keywords: aggregated search; evaluation; metric; diversity; reliability; discriminative power; intuitiveness
1.
INTRODUCTION
Search engines operating verticals dedicated to specific media types or genres (e.g. news, image, blogs) commonly present results from several verticals dispersed throughout the standard “general web” results, for example by adding image results to the ten blue links for the query “car”. This Permission to make digital or hard copies of all or part of this work for personal or classroom use is granted without fee provided that copies are not made or distributed for profit or commercial advantage and that copies bear this notice and the full citation on the first page. Copyrights for components of this work owned by others than ACM must be honored. Abstracting with credit is permitted. To copy otherwise, or republish, to post on servers or to redistribute to lists, requires prior specific permission and/or a fee. Request permissions from
[email protected]. CIKM’13, Oct. 27–Nov. 1, 2013, San Francisco, CA, USA. Copyright 2013 ACM 978-1-4503-2263-8/13/10 ...$15.00. http://dx.doi.org/10.1145/2505515.2505691.
search paradigm, known as aggregated search [4], has three main challenges: vertical selection (VS), item selection (IS) and result presentation (RP). Vertical selection deals with deciding which verticals are implicitly intended by a query. Item selection deals with selecting a subset of items from each vertical to present on the aggregated page. Result presentation deals with organising and embedding the various types of results on the result page. The most common presentation strategy is to merge the results into one ranked list of blocks, and is now the ‘de facto’ standard. Evaluating aggregated search (AS) is challenging as there are a variety of compounding factors. Consider the query “yoga poses” which suggests that a visual element in the result page would be interesting to many users. Some users may prefer an AS page because they prefer a specific vertical (e.g. image). Other users may desire results that are vertically diverse (VD) (e.g. items from image, blog and discussion). These two scenarios relate to VS performance in AS. Users may prefer result sets that are composed mostly of topically relevant items; this relates to IS performance. Finally, users may prefer to see relevant items from selected verticals towards the top of the result page; this is dealt with by RP. Any combination of those factors (and the corresponding components of AS) can influence a user’s perceived quality of the AS result page. Although various approaches and metrics have been proposed to evaluate AS systems, either each component in isolation [4, 3] or as a whole [15, 27], no work exists that aims to comprehensively understand them. In particular, in [27], a series of AS metrics were proposed, studied, and applied to a number of AS approaches. The aim therein was to model all, or a subset, of the four AS compounding factors discussed above, VS, IS, RP and VD. The main differences between these metrics are the way they model each factor and combine them. However, how well the metrics capture and combine those factors remain poorly understood. In other words, how these metrics behave, i.e. their reliability and intuitiveness, when evaluating AS performance has not been studied. This is the aim of this paper. We investigate the reliability and the intuitiveness of AS metrics. We focus on how the metrics reflect the four AS compounding factors, VS, IS, RP and VD. By reliability, we mean the ability of a metric to detect “actual” performance differences as opposed to those observed by chance,
and by intuitiveness, we mean the ability to capture any property deemed important in a metric. In this paper, reliability is measured using discriminative power [17]. We use the randomised Tukey’s Honestly Significant Differences test [7] because, as shown by [21], this test is less likely to find significant differences that are not “actual”. For intuitiveness, we quantitatively measure the preference agreements using the concordance [21] of a given AS metric with a “basic” single-component metric for each of the four AS factors. Finally, to gain further understanding, we examine AS metrics’ ability to capture the combination of key components. The contribution of our work is three-fold: (a) Our work is the first endeavour to study the reliability and intuitiveness of AS metrics; (b) We present an examination of an extensive set of metrics, including a comprehensive set of adapted diversity metrics; and (c) We use two AS test collections to carry out our investigation. Section 2 discusses previous work. We describe the metrics investigated in this study in Section 3, which also contains the description of our “meta-evaluation” methodology. Details of the test collections and experimental setup are provided in Section 4. Section 5 reports our experimental results. We conclude and discuss future work in Section 6.
2.
PREVIOUS WORK
Section 2.1 reviews both traditional and diversity metrics used in IR. Section 2.2 provides an overview of existing work on evaluating AS, either by measuring the performance of key components in isolation or as a whole. Finally, Section 2.3 summarises methodologies that have been used to compare metrics.
2.1 IR Metrics 2.1.1 Traditional Metrics Traditional IR evaluation is based on topical relevance, qrel(q, d), between a query q and a document d. Traditional IR metrics ignore the document type (e.g. vertical) and measure the quality of a ranked list l by modelling the gain G@l of a user reading all documents in that list l. For instance, P @k assumes that after reading the top k results in l, a user’s gain G@k solely depends on the number of relevant documents within the top k results. Although this metric is simple and widely used, it does not take into account the ranking position, and furthermore, assumes that relevance is a binary judgement. To incorporate graded relevance and to take a more fine-grained user model into account, nDCG@l was proposed [11]. By diminishing the impact of lower ranked relevant documents, nDCG@l measures the performance of l by cumulating the diminished gain for each position r. A function g(r) is defined to measure the gain of reading a document. The more relevant the document is, the higher the gain to the user. Finally, the metric score is normalized by an ideal ranked list l∗ , obtained by ranking all relevant documents in descending order of their relevance. Pl g(r)/ log(r + 1) nDCG@l = Plr=1 (1) ∗ ∗ (r)/ log(r + 1) g r=1 Other metrics have been proposed (e.g. RBP [13], ERR [8]); the major difference between nDCG and them is the assumed user model and how g(r) is defined.
2.1.2 Diversity Metrics To consider rewarding topical diversity in ranked lists, a set of diversity metrics have been proposed recently; these include α-nDCG [9], IA-nDCG [1] and D#-nDCG [16]. αnDCG extends nDCG to account for diversity by discounting the gains that accrue according to the intent (subtopic) previously encountered in the ranked list. The noveltybiased gain N G(r) is defined as: X Ji (r)(1 − α)Ci (r−1) (2) N G(r) = i
where Ji (r) = 1 if a document atPrank r is relevant to the ith intent and 0 otherwise; Ci (r) = rk=1 Ji (k) is the number of documents observed within the top r results that contained the ith intent. The strength of the novelty-biased discount is controlled by α. Agrawal et al. [1] apply a traditional measure to each subtopic independently and then combined each value to give the expected value of the measure across all intents. This assumes that for a query q with several intents i, the probability of each intent P (i|q) is available. For example, nDCG for a given intent i (nDCGi ) is computed first, and then the intent-aware IA-nDCG is computed as: X P (i|q)nDCGi @l (3) IA-nDCG@l = i
D-nDCG [16], by analogy to g(r) within nDCG, calculates a global gain GG(r) at rank r given various intents: GG(r) =
X
P (i|q)gi (r)
(4)
i
gi (r) is the gain value for a document at rank r for intent i. Intent recall I-rec [24], i.e. number of intents covered by a ranked list, can be boosted with the following measure: D#-nDCG@l = γI-rec + (1 − γ)D-nDCG@l
(5)
γ controls the trade-off between relevance and diversity. These metrics were proposed to evaluate the diversity of ranked lists over subtopics, and have been recently adapted to measure AS performance [27]. We discuss these adaptations next.
2.2 AS Metrics Current AS metrics measure either each AS component (VS, IS, RP) in isolation or as a whole. An AS page P is composed of a set of blocks {B1 , B2 , ...Bn }, where each block Bi consists of a set of items {Ii1 , Ii2 , ...Iim }. An item can be a “general web” page or a vertical result. Vertical selection (VS) has been studied in [4, 12, 26, 28], where the aim is to measure the quality of the set of selected verticals, compared with an annotated set obtained by collecting manual labels from assessors [4, 26, 28] or derived from user interaction data [12]. The quality is mostly evaluated with standard measures of precision, recall and fmeasure [4, 26] using a binary annotated set. Recently, risk has also been incorporated into risk-aware VS metrics [28]. Recent attempts to evaluate the utility of the whole AS page [3, 15, 27] consider the four key factors VS, VD, IS, RP together. For example, [15] evaluate the utility of a page based on a user engagement metric (CTR) when user interaction data is available. Others [5] evaluate the utility of the page by asking annotators to make assessments based
on a number of criteria (relevance, diversity) for each page. Although those works comprehensively evaluate AS pages, it remains costly to gather assessments for all AS pages. Arguello et al. [3] collected pairwise preferences on vertical block-pairs from users, and then measured the AS page quality by calculating the distance between the page in question and the ideal (reference) page; the shorter the distance, the better the page. The ideal reference page is obtained by using a voting method for aggregating all pairwise block preference data into a single ranking. Zhou et al. [27] followed the Cranfield paradigm and proposed an evaluation framework for measuring AS page quality using two types of assessments, item topical-relevance and vertical-orientation, gathered independently. Topicalrelevance assessment qrel(q, d) specifies the topical relevance between a document and a query, whereas vertical-orientation orient(vi , q) is the fraction of users that prefer a page to contain items from the vertical vi rather than “general web” results for a query q. An example is ASDCG (P ), a metric defined as the expected gain G(Bi ) of reading each block Bi on page P divided by the expected effort E(Bi ) spent, normalized by the score ASDCG (P ∗ ) of an ideal page P ∗ : P|P | P|P | ( i=1 1/ log(Bi )G(Bi ))/( j=1 1/ log(Bj )E(Bj )) ASDCG (P ) = P|P ∗ | P|P ∗ | ( i=1 1/ log(Bi )G(Bi ))/( j=1 1/ log(Bj )E(Bj )) (6)
The gain G(Bi ) combines vertical-orientation orient(vi , q) and topical-relevance qrel(q, Iik ), relating the quality of the block in an independent manner: G(Bi ) = g(orient(vi , q), α) ×
|Bi | X
qrel(q, Iik )
(7)
k=1
where the function g() is used so that the relative gain of the vertical can be altered using a tuning parameter α. The effort of examining a block E(Bi ) is defined as the accumulative effort of reading all the items within it, that is P|Bi | E(Bi ) = k=1 E(Iik ) where the effort E(Iik ) is assumed to depend on the media type of the item. Several existing diversity metrics were adapted to evaluate AS in [27] by treating subtopics as verticals and subtopic importance as vertical-orientation as follows: (i) replacing subtopic importance with orient(vi , q); (ii) substituting the user model for ranks to a model that applies to blocks; and finally (iii) normalising according to the ideal AS page. All AS metrics model and combine factors of AS (VS, VD, IS, RP) differently. In this paper, we use a subset of them for in-depth analysis of their properties.
2.3 Comparing Metrics To date, and to our knowledge, no existing studies comparing the reliability and usefulness of metrics in the context of AS have been reported. However, this current study is similar to the work by Sakai et al. [16, 21] and Clarke et al. [10] that compare diversity metrics. We therefore follow a similar methodology. For example, we also use discriminative power [7] to evaluate AS metrics. The novelty of our contribution lies in the insight that our study brings to the AS area, rather than the more usual linear ranked-list approach. Furthermore, the comprehensive examination on how AS metrics capture and measure the different AS components is both novel and timely.
Discriminative power is not the only way to evaluate an evaluation metric. Indeed, highly discriminative metrics, while desirable, may not necessarily measure everything that we may want measured. Recently, Sakai [21] proposed the intuitiveness test1 for this exact purpose. The intuitiveness test compares a metric of interest with a simple golden standard metric that captures the most important properties that the metric should satisfy. In our study, we apply the intuitiveness test within the context of AS and define four golden standard metrics, respectively, for the four AS factors VS, VD, IS, RP. This allows us to investigate how AS metrics capture the key desirable properties of AS. We should add that other approaches, especially those relying on human subjects (for instance to assess a metric’s predictive power), are important. For example, by employing Mechanical Turk users, Zhou et al. [27] and Sanderson et al. [19], respectively, examined the predictive power of AS metrics and IR metrics. For example, if a metric prefers one AS page or ranked list over another, does the user also prefer the same page/list? One finding in both works was that AS metrics and IR metrics agree reasonably well with human preferences. Although informative from a user perspective, compared to our study, these studies do not give us much insight into how reliable metrics are at ranking systems, or how well the metrics capture key AS components.
3. EVALUATING EVALUATION METRICS We first summarize the AS metrics tested in this study in Section 3.1. Sections 3.2 and 3.3 describe the two methods comparing the “goodness” of AS metrics, using discriminative power and an intuitiveness test, respectively.
3.1 AS Metrics As discussed in Section 2, various AS metrics have been proposed to evaluate key components of AS systems, either in isolation or as a whole. We select a subset of existing AS metrics, listed in Table 1. Some metrics incorporate all four factors (VS, IS, RP, VD) (e.g. ASDCG ) whereas others relate to a subset (e.g. α-nDCG). For metrics concerned with the same subset of factors, the way these factors are incorporated can vary. For example, ASDCG and ASRBP mainly vary on their assumed user browsing model so that they give different diminishing returns for documents at later ranks. We also include simple metrics that capture one AS factor (detailed in Section 3.3). The selected metrics allow us to investigate all four factors, both individually and when combined, as well as the various categories (traditional IR metrics, adapted diversity metrics, AS metrics and simple single-component metrics) to which they belong. Some metrics possess parameters that can be tuned to (de)emphasize a factor (e.g. α in α-nDCG rewards VD differently). In this work, we leave the tuning of these parameters as future work and use standard parameter settings for each metric (we follow settings from previous work [27]). We briefly explain the differences between the selected metrics (Section 2 has full details). In short, both nDCG and P @10 ignore the vertical type and only consider IS (and RP for nDCG). Without considering the intent likelihood P (i|q), α-nDCG rewards VD by diminishing redundant relevant documents. Although incorporating P (i|q), IA-nDCG considers each intent independently, and was shown 1
This was later renamed as the concordance test [18].
foreach pair of runs (r1 , r2 ) do count(r1 , r2 ) = 0; for b = 1 to B do create matrix X ∗b whose row t is a permutation of row t of X for every t ∈ T ; ∗b max∗b = maxi x ¯∗b = mini x ¯∗b i ; min i where ∗b xi is the mean of i-th column vector of X ∗b ; foreach pair of runs (r1 , r2 ) do if max∗b − min∗b > |¯ x(r1 ) − x ¯(r2 )| then where x ¯(ri ) is the mean of column vector for ri in X count(r1 , r2 ) + +; foreach pair of runs (r1 , r2 ) do ASL(r1 , r2 ) = count(r1 , r2 )/B; Algorithm 1: Obtaining the Achieved Significance Level with the two-sided, randomised Tukey’s HSD given a performance value matrix X whose rows represent topics and columns represent runs.
Table 1: Metrics Tested in this Paper. Metric
VS
nDCG[11] P @10 α-nDCG [9] IA-nDCG [1] D#-nDCG [16] ASDCG [27] ASRBP [27] ASERR [27] precv [26] mean-prec [27] Spearman-corr recv [26]
X X X X X X
IS
RP
X X X X X X X X
X X X X X X X
VD
Category Traditional
X X X X X X
Adapted Diversity AS
Single component
X X X
to be biased in rewarding relevant documents with high intent (with a lower emphasis on VD) [10]. Comparatively speaking, for each rank, D-nDCG and D#-nDCG accumulate the global gain for all intents, and have been proven to reward VD more. The differences between them is that D#-nDCG explicitly boosts VD by linearly combining DnDCG with I-rec. ASDCG , ASRBP , ASERR reward all four components of AS, but differ in the assumed user browsing model (which affects RP).
foreach pair of runs (r1 , r2 ) with a significant difference at α do δα (r1 , r2 ) = |mean(r1 ) − mean(r2 )| ; δα = mini,j δα (r1 , r2 ) ; Algorithm 2: Estimating the performance δ required for obtaining a significant difference at α with the randomised Tukey’s HSD test.
3.2 Discriminative Power Given a test collection and a set of runs, the discriminative power of a metric is measured by conducting a statistical significance test for every pair of runs, and then counting the number of significant differences. In this paper, we use the randomised version of Tukey’s Honestly Significant Differences (HSD) test [7]. This test takes the entire set of runs into account when judging the significance of each run pair. This test is more conservative (compared to e.g. bootstrap test [17]), and hence less likely to lead to significant differences that are not “real”. We choose this test because of its reliance on modern computational power instead of statistical assumptions. The main idea behind Tukey’s HSD is that if the largest mean difference observed is not significant, then none of the other differences should be significant either. Given a set of runs, the null hypothesis H0 is “there is no difference between any of the systems”. We perform randomised Tukey’s HSD as shown in Algorithm 1 (taken from [7]). From a given matrix X whose element at (row i, column j) represents the performance of the j th run for the ith topic, we create B new matrices X b by permuting each row at random; then, for every run pair, we compare the performance δ of this run pair with the largest performance δ observed within X b . Finally, for each run pair, we obtain the Achieved Significance Level (ASL or p-value), which represents how likely this would be under H0 (null hypothesis). As in any other significance test, H0 is rejected if ASL < α. Using the results of the randomised Tukey’s HSD test, we also estimate the performance δ required to achieve a statistical significance at α for a given topic set size as shown in Algorithm 2: we take the smallest observed δ from all the run pairs that were found to be significantly different.
3.3 Intuitiveness We now discuss the concordance test that examine the intuitiveness of metrics. AS metrics aim to balance four key AS factors (VS, IS, RP and VD) when assessing perfor-
mance. Inevitably, they tend to be complex, making it particularly difficult to determine if a metric is “measuring what we want to measure”. To address this, Sakai [21] proposed a method for quantifying “which metric is more intuitive”, and this has been applied to measuring intuitiveness for diversity IR metrics. We now apply his approach to AS. The concordance test algorithm [21] is shown in Algorithm 3. The algorithm computes relative concordance scores for a pair of metrics M1 and M2 and a gold standard metric MGS . The latter represents a basic property that a candidate metric should satisfy. For our study, we consider four simple metrics as our gold standards, one for each AS factor. Note that these gold standards are simple and some of them (e.g. VS, VD, IS) are set retrieval metrics based on binary relevance. Since different AS metrics employ different position-based discounting and different ways to define graded topical relevance, the gold standards should be as agnostic to these differences as possible. Their purpose is to separate out and test the important properties of the more complex AS metrics. The four gold standard metrics are: • Simple VS metric: vertical precision precv . • Simple VD metric: vertical recall recv . • Simple IS metric: mean precision mean-prec of vertical result items. • Simple RP metric: Spearman’s rank correlation corr with “perfect” AS reference page. For a vertical vi and query q, we consider the vertical to be relevant if orient(vi , q) is greater than 0.5.2 Note that the 2
We set the threshold to 0.5, as an assessor majority preference of 50% is a suitable percentage since the assessments are neither too noisy (25%) or stringent (100%). In addition, the relevant vertical set obtained from this simple thresholding approach is similar to that obtained from Arguello et al.’s voting approach [3] (where more relevance assessments are needed).
Disagreements = 0; Correct1 = 0; Correct2 = 0; foreach pair of runs (r1 , r2 ) do foreach topic t do δM1 = M1 (t, r1 ) − M1 (t, r2 ); δM2 = M2 (t, r1 ) − M2 (t, r2 ); δMGS = MGS (t, r1 ) − MGS (t, r2 ); if (δM1 ×δM2 )< 0 then // M1 and M2 disagree Disagreements + +; v if δM1 ×δMGS ≥ 0 then // M1 and MGS
Table 2: Verticals Used in this Paper.
agree
Correct1 + +; if δM2 ×δMGS ≥ 0 then // M2 and MGS agree Correct2 + +; Intuitive(M1 |M2 , M GS ) = Correct1 /Disagreements; Intuitive(M2 |M1 , M GS ) = Correct2 /Disagreements; Algorithm 3: Computing the concordance of metrics M1 and M2 based on preference agreement with golden standard metric MGS .
vertical recall recv can also be referred to as I-rec (intent recall). Moreover, the simple RP metric corr is similar to Arguello et al. voting approach [3]. However, rather than assigning a higher weight to higher positions in the page, corr calculates the correlation by weighting each position equally. The steps conducting the concordance test are as follows: We first obtain all pairs of AS systems/pages for which M1 and M2 disagree with each other. Then, out of these disagreements, we count how often each metric agrees with the gold standard metric. In this way, we can discuss which of the two metrics is the most “intuitive”. Moreover, we can argue that an ideal metric should be consistent with all four gold standards; we therefore add one additional step by counting how often the metric agrees with a subset of or all four gold standards.
4.
DATA AND SYSTEM RUNS
To provide findings not tailored to one data set, and hence generalisable, our experiments are conducted on the two test collections described in Section 4.1. The methodology employed to simulate AS systems is presented in Section 4.2.
4.1 Test collections An AS test collection consists of a number of verticals, each populated by items of that vertical type, a set of topics expressing information needs relating to one or more verticals, and assessments indicating both the topical-relevance of the items and the perceived user-oriented usefulness of their associated verticals to each of the topics. The first test collection is an AS test collection [25] created by reusing an existing web collection, ClueWeb09. The verticals were created either by classifying items in the web collections into different genres (e.g. blog, news) or by adding items from existing multimedia collections (e.g. image, video). The topics and topical-relevance assessments of the items across the verticals were obtained by reusing the assessments developed in two TREC evaluation tasks (TREC Web Track and Million-Query Track). The verticals used are listed in Table 2, and correspond to real-world usage of verticals by commercial search engines. The second AS test collection [14] is a new dataset used
Vertical
Document
Type
Image Video Recipe News Books Blog Answer Shopping Discussion Scholar Reference/Wiki General web
online images online videos recipe page news articles book review page blog articles answers to questions product shopping page discussion thread from forums research technical report encyclopedic entries standard web pages
media genre
in the TREC FedWeb track 2013.3 The collection contains search result pages from 108 web search engines (e.g. Google, Yahoo!, YouTube and Wikipedia). For each engine, several query-based samplings were provided for vertical selection. Relevance judgements were collected by judging both the snippet created by the engine, and the actual document content for the results returned by the engines for a set of queries (reused TREC Web Track 2010 queries). To use the same verticals listed in Table 2, we manually mapped the 108 search engines into them. This was straightforward since the engine categories used were similar to those in Table 2. The vertical-orientation information of each topic from the first test collection was obtained by providing the vertical names (with a description of their characteristics) and asking a set of assessors to make pairwise preference assessments, comparing each vertical in turn to the reference “general web” vertical (“is adding results from this vertical likely to improve the quality of the ten blue links?”) [26]. Note that since the two test collections contain the same set of topics (reused from TREC Web Track 2010), the vertical-orientation information from the first collection could be used for the second collection. Some details and statistics of the two test collections are shown in Table 3.
4.2 Simulating AS System Runs For each topic, we simulate a set of aggregated search pages/systems. We assume that a page consists of ten “general web” blocks (one “general web” page is a block) and up to three vertical blocks dispersed throughout those ten blocks (where each vertical block consists of a fixed number of three items). Recall that there are three key components of an aggregated search system that can be varied: (i) Vertical Selection (VS) (ii) Item Selection (IS) and (iii) Result Presentation (RP). We generate pages by simulating an AS system in which the three components vary in quality. We simulate four different state-of-the-art VS strategies, namely ReDDE [23], CRCS(e) [22], click-through [2] and vertical-intent [2]. Deriving from sampled vertical representation, ReDDE and CRCS(e) model each verticals average document score in a full-dataset retrieval (all sources together). By contrast, click-through and vertical-intent use, respectively, users’ click-through data and issued queries from a search engine log (AOL-log). Similar to [2], we model VS as a classification task and, for each single VS approach (e.g. ReDDE), the output is n independent prediction probability scores (one per vertical, n is the number of verticals). Assuming four vertical positions (ToP, MoP, BoP, None) 3
https://sites.google.com/site/trecfedweb/
Table 3: Test Collection Information.
Documents Topics
Intents Runs
(a) classified ClueWeb09 Category B (“VertWeb11”) [25] ClueWeb09 Cat B (approximately 50 million documents) a subset of 56 topics (pertaining various vertical intents) is used in our experiments, selected from 320 topics (reused TREC 2009-2010 Web Track and TREC 2008-2009 MillionQuery Track topics) 12 vertical intents (with an average of 1.83 relevant verticals per topic) 36 simulated AS systems
on the page, each candidate vertical prediction is compared with three threshold parameters γ1−3 (one for each position) to assign the corresponding embedding position. A given vertical is assigned to the highest position for which the vertical prediction probability is greater than or equal to all thresholds below it, and the verticals within the same position are ordered by descending order of prediction probability. Using similar techniques in [3], we obtained a separate development set to tune the three threshold parameters. For IS we simulate three potentially different levels of relevance. These are Perfect, BM25, and TF. Perfect selects all items in the vertical that are topically relevant. BM25 and TF select the top three ranked items from the rankings provided by the BM25 and a simple TF (term-frequency) weighting, respectively, with the PageRank score as a prior for both BM25 and TF. For RP, we simulate three different result presentation approaches: Perfect, Random and Bad. Perfect places the vertical blocks on the page so that gain could potentially be maximised, i.e. all the relevant items are placed before nonrelevant items. However, if these items are part of a vertical, we position the highest orientated vertical first. Random randomly disperses the vertical blocks on the page while maintaining the position of the “general web” blocks. Bad reverses the perfectly presented page. By varying the quality of each of the three key components, we can vary the quality of the result pages created by an aggregated search system in a more controlled way. For each topic, we can create 36 (4 × 3 × 3) system runs.4 2 Therefore, for the discriminative power test, we have C36 (630) system pairs. Using this approach we can create a near ideal aggregated page for a query by using Perfect VS, Perfect IS, and Perfect RP. This is a greedy approach to the problem and is used as our method of normalisation.
5.
EXPERIMENTS
We experiment with both the discriminative power (Section 5.1) and the intuitiveness (Section 5.2) of AS metrics.
5.1 Disciminative Power Using the two AS test collections (VertWeb11 and FedWeb13), we evaluated two sets of metrics in terms of their discriminative power. The first set consists of metrics that evaluate only a subset of the AS components, namely, nDCG, P @10 (Traditional Metrics), precv , recv , mean-prec and corr (Single-Component Metrics as described in Section 3.3). The second set includes the (recently proposed) AS metrics [27] ASDCG , ASRBP , ASERR and adapted diversity metrics α-nDCG, IA-nDCG and D#-nDCG. Note that we 4 Certain combinations of VS, IS, and RP do not create unique simulated pages.
(b) TREC 2013 FedWeb Track Data (“FedWeb13”) [14] Documents sampled from 108 heterogeneous search engines 50 topics (TREC 2010 Web Track) that cover multiinterpretations or multiple facets.
12 vertical intents manually classified for 108 search engines 36 simulated AS systems
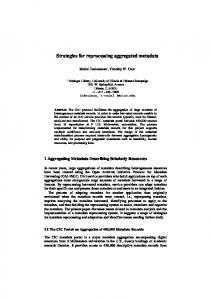
used the standard parameter settings (e.g. setting α = 0.5 for α-nDCG, etc.). We leave the appropriate tuning of the metrics’ parameters for future work. Figures 1 and 2 show the ASL (Achieved Significance Level) curves of some selected AS metrics, using the randomised Tukey’s HSD on FedWeb13 and VertWeb11 collections, respectively. Part (a) in each figure (higher part) shows the results with the first set of metrics (traditional IR and AS component-based metrics). Part (b) (lower part) shows the results for the second set of metrics (AS and adapted diversity metrics). The most discriminative metrics are those closer to the origin in the figures. Table 4 cuts those two figures in half vertically at α = 0.05 to quantify the discriminative power and the performance δ required to achieve statistical significance for a given number of topics (56 for VertWeb11 and 50 for FedWeb13). For example, the left side of Table 4 (a) shows that the discriminative power of the component-based metrics mean-prec according to the Tukey’s HSD test at α = 0.05 is 125/630 = 19.8% (125 significantly different run pairs were found) and the δ required for achieving statistical significance is around 0.12. Let “M1 ∈ M2 ” denotes the relationship “M2 outperforms M1 in terms of discriminative power.” First, by comparing the different component-based metrics in terms of discriminative power as shown in Part (a) (higher) of Figures 1 and 2, and the left side of Table 4 (a) and (b), the following trends can be observed: precv ∈ recv ∈ (mean-prec, P @10) ∈ (nDCG, corr). We summarise our findings below: • Single-component metrics perform comparatively well in discriminating AS systems. The RP metric corr appears to be the most consistently discriminative metrics of all the single-component metrics for our data sets, achieving a discriminative power comparable to traditional IR metrics (e.g. P @10 or nDCG). • The VS metric precv is the least discriminative singlecomponent metric for evaluating AS pages. After a close examination, we found that since most of AS pages only present a few verticals (mostly 1 or 2), the possible values of precv are quite limited across pages and therefore cannot discriminative. • For the traditional IR metrics, nDCG performs consistently better than P @10 and other single-component metrics. It is not surprising that nDCG performs better than P @10 since it incorporates both ranking position and graded relevance assessments. However, it is interesting to observe that, without considering the rank-based discount, corr is able to discriminate AS systems comparably to nDCG in the VertWeb11 collection.
Table 4: Discriminative power / performance δ of metrics (single-component and AS metrics) based on the randomised Tukey’s HSD test at α = 0.05 on the FedWeb13 and VertWeb11 collections. precv recv mean-prec corr nDCG P @10
0.0% 8.3% 19.8% 20.8% 24.1% 8.6%
(a) FedWeb13 N/A α-nDCG 0.09 IA-nDCG 0.12 D#-nDCG 0.11 ASDCG 0.10 ASRBP 0.13 ASERR
15.9% 0.0% 12.5% 22.4% 15.9% 28.1%
0.08 N/A 0.07 0.10 0.05 0.09
precv recv mean-prec corr nDCG P @10
0.0% 7.9% 13.0% 20.4% 20.5% 14.9%
(b) VertWeb11 N/A α-nDCG 0.10 IA-nDCG 0.12 D#-nDCG 0.10 ASDCG 0.13 ASRBP 0.10 ASERR
14.5% 0.0% 12.1% 23.8% 15.3% 27.7%
0.08 N/A 0.07 0.12 0.05 0.09
Figure 1: FedWeb13 Discriminative Power Evaluation: ASL curves based on the randomised Tukey’s HSD. y-axis: ASL (i.e., p-value); x-axis: run pairs sorted by ASL.
Figure 2: VertWeb11 Discriminative Power Evaluation: ASL curves based on the randomised Tukey’s HSD. y-axis: ASL (i.e., p-value); x-axis: run pairs sorted by ASL.
Next, as shown in Part (b) (lower) in Figures 1 and 2, and the right side of Table 4 (a) and (b), we compare the different AS metrics in terms of their discriminative power. We see that IA-nDCG ∈ D#-nDCG ∈ (ASRBP , α-nDCG) ∈ ASDCG ∈ ASERR . Our findings are summarised below:
tive, and this can be observed for both datasets. IAnDCG’s failure might be explained by its top-heavy characteristic (it heavily rewards highly oriented vertical results), whereas D#-nDCG’s discrimination might be affected by the less discriminating recv that it incorporates.
• AS-metrics (e.g. ASERR ) are generally more discriminative than other adapted diversity metrics. This is not surprising since AS-metrics incorporates effort of reading different types of items and hence might be more powerful/discriminative in controlling the reward trade-off between vertical orientation and topical relevance. • ASERR outperforms ASDCG and ASRBP in terms of discriminative power. When considering graded relevance assessments, this might suggest that metrics considering inter-dependency of relevance among documents can be more discriminating than those that only discounted over positions. • IA-nDCG and D#-nDCG are the least discrimina-
• Generally, different AS metrics are more discriminative than both single-component metrics and traditional IR metrics, although with the exception of corr and nDCG being more discriminative than e.g. D#nDCG.
5.2 Intuitiveness Highly discriminative metrics, while desirable, may not necessarily measure what we expect them to measure. The aim of this section is to answer the question: how do the different AS metrics differ from one another, and which ones are more intuitive than others for the purpose of evaluating search result aggregation? We answer this question by conducting a concordance test.
Table 5 shows the “intuitiveness” scores for a variety of AS metrics, computed using the preference agreement algorithm shown in Algorithm 3. As specified in Table 1, our tested AS metrics include a variety of adapted diversity metrics, existing AS metrics and a set of single-component AS metrics. We select a subset of them (α-nDCG, IA-nDCG, ASDCG , D#-nDCG) representing different frameworks in modelling AS evaluation. In addition, to provide insights on the effectiveness of different user models (e.g. position-based discount model, cascade model) that are used for AS evaluation, we also include ASDCG , ASRBP and ASERR and investigate their ability to capture different key AS components. Due to space limitation, we only show results in Table 5 for the FedWeb13 collection as the results are similar for both test collections. Note that as we have 36 ∗ 35/2 = 630 run pairs, we have 50 ∗ 630 = 31500 pairs of aggregated search pages for the tests. As we are testing intuitiveness with respect to four AS factors (VS, IS, RP and VD), Part (a) of Table 5 uses the precision of returned vertical set precv as the gold-standard, representing how the AS metrics favour aggregated pages that select majority-preferred (relevant) verticals. Part (b) uses the recall of verticals recv as the gold-standard, representing how AS metrics favour search results with a more diverse sets of verticals. Part (c) computes the intuitiveness scores by showing how AS metrics favour a returned set containing a large number of relevant documents, as measured by the mean of precision for each vertical results. Finally, Part (d) measures the “goodness” of AS systems embedding vertical results into “general web” results, where we use the Spearman Rank Correlation between the AS page of interest and the reference AS page (“perfect” page) as the measure. For example, Table 5 (a) shows that if we compare α-nDCG and IA-nDCG in terms of the component VS (the ability to select relevant verticals), there are 10222 disagreements, and that whereas the intuitive score for α-nDCG is only 0.742, that for IA-nDCG is 0.792. This means that, given a pair of AS pages for which α-nDCG and IA-nDCG disagree with each other, IA-nDCG is more likely to agree with precv on the vertical preference than α-nDCG. Let “M1 > M2 ” denotes the relationship “M1 statistically significantly outperforms M2 in terms of concordance with a given gold-standard metric.” As we assume that the simple single-component metrics discussed here can properly reflect the performance of each component, when comparing different frameworks (α-nDCG, IA-nDCG, D#-nDCG and ASDCG ) for capturing individual key AS component, several trends can be observed from Table 5:5 • Concordance with precv (pure vertical orientation): IA-nDCG > ASRBP > ASDCG > D#-nDCG > ASERR , α-nDCG; • Concordance with recv (pure vertical diversity): D#-nDCG > IA-nDCG > ASDCG , ASRBP , ASERR > α-nDCG; • Concordance with mean-prec (pure item topical relevance): ASRBP , D#-nDCG > ASDCG > IA-nDCG > ASERR > α-nDCG; 5
In general, note that pairwise statistical significance is not transitive. However, it turns out that our results do not violate transitivity.
• Concordance with corr (presentation): α-nDCG > ASERR > ASDCG > ASRBP > D#-nDCG > IA-nDCG. The above translate to the following observations. The intent-aware (IA) metric [1] and recently proposed AS-metric evaluation framework [27] work best for rewarding selecting relevant verticals based on the intuitiveness score. The D# and IA frameworks favour rewarding vertical diversity (promoting diverse set of results from different verticals). It is not surprising that the D# framework behaves similarly to recv since D# boosts diversity by incorporating I-rec into it. The D# and AS metrics tend to reward result page with more topically relevant items whereas ASRBP works best, compared to other user models. The α-nDCG and ASERR metrics consistently perform worst with respect to vertical orientation (VS), vertical diversity (VD) and topical relevance (IS). Finally, the α-nDCG and ASERR metrics are better correlated with result presentation (RP) evaluation. A closer examination shows that this can be explained by the fact that the cascade model can better discriminate the small relevance “exchanges” (differences) at the top or bottom of the search result page. To investigate how the above metrics accurately combine the various AS components, we conduct a further concordance test to answer the following question: how often does a given metric agree with a set of components at the same time? For space limitation, we only report results (Part (e) to (g) in Table 5) relating to the component combinations capturing the most crucial aspects of AS, namely VS+IS (orientation and relevance), VS+IS+VD (orientation, relevance and diversity) and VS+IS+RP+VD (ultimate utility). Our findings are as follows: • Concordance with precv AND mean-prec (vertical orientation and topical relevance): ASRBP > D#-nDCG > ASDCG , IA-nDCG > ASERR > α-nDCG; • Concordance with precv AND recv AND mean-prec (vertical orientation, topical relevance and diversity): D#-nDCG > ASRBP , IA-nDCG > ASDCG > ASERR > α-nDCG; • Concordance with all: ASRBP > D#-nDCG > ASDCG , IA-nDCG > ASERR > α-nDCG. We therefore find that D#-nDCG and ASRBP performs best when combining components whereas the D# metric captures better vertical diversity (VD) and ASRBP models better vertical orientation and relevance (VS, IS). Moreover, we quantitatively show the advantages of metrics that capture key components of AS (e.g. VS) over those that do not (e.g. α-nDCG). Further investigations are needed to better understand why certain combination approaches work better than others.
6. CONCLUSIONS In this paper, we measured the performance of AS metrics based on both their discriminative power and intuitiveness. To our knowledge, this is the first study to extensively examine properties of metrics in the context of AS. We used an extensive set of existing AS metrics and adapted diversity metrics and test them across two AS test collections. Our main findings are:
• In terms of discriminative power, for the four AS components, RP (corr) is the most discriminative feature (metric) for evaluation, followed by IS (mean-prec), VD (recv ) and VS (precv ). In addition, the AS-metrics (e.g. ASERR , ASDCG ) and α-nDCG are the most discriminative metrics, and superior to D#-nDCG and IA-nDCG. • In terms of intuitiveness for single AS factor (concordance with single-component metric), we observe that IA-nDCG is superior to other AS metrics and therefore may be the most intuitive metric for vertical orientation (VS). In addition, D#-nDCG is superior to other AS metrics in terms of vertical diversity (VD) and may therefore be the most intuitive metric for that feature of aggregation. Furthermore, ASRBP and D#nDCG are the most intuitive metrics for vertical topical relevance (IS). Finally, α-nDCG is the most intuitive metric for result presentation (RP). • In terms of intuitiveness for the combination of factors (concordance with multiple single-component metrics), we find that ASRBP is the most intuitive metric to emphasise both vertical orientation and vertical topical relevance (VS+IS). In addition, D#-nDCG is the most intuitive metric for vertical orientation, vertical topical relevance and vertical diversity (VS+IS+VD). Finally, ASRBP is the most intuitive metric to emphasise all AS components (VS+IS+VD+RP). In terms of both discriminative power and intuitiveness, we demonstrated that the AS-metrics (especially ASRBP ) are the most powerful metrics to evaluate aggregated search. In addition, our work presents a framework to conduct a metaevaluation for aggregated search using test collections. This is relatively inexpensive to conduct, compared with previous work involving human subjects for annotating preference of large amount of AS page pairs [27]. Our results have several implications: (1) compared with homogeneous federated search, aggregation over heterogeneous sources might require more refined evaluation measures that not only capture item topical relevance, but also vertical orientation, in order to better model and discriminate system performances; (2) a more principled framework to incorporate and combine key factors (VS, VD, IS, RP) of AS could provide better insights in understanding evaluation results. Future work will include a thorough testing of AS metrics by tuning parameters within various metrics to (de)emphasise some of the key factors, and a comparison with meta-evaluation results from human subjects to test the reliability of our approach and results. Acknowledgments This work was partially supported by the EU LiMoSINe project (288024).
7.
REFERENCES
[1] R. Agrawal, S. Gollapudi, A. Halverson, and S. Ieong. Diversifying search results. WSDM, 2009. [2] J. Arguello, F. Diaz, and J. Callan. Learning to aggregate vertical results into web search results. In CIKM, pages 201–210, 2011. [3] J. Arguello, F. Diaz, J. Callan, and B. Carterette. A methodology for evaluating aggregated search results. In ECIR’11, pages 141–152, Berlin, Heidelberg, 2011. Springer-Verlag.
[4] J. Arguello, F. Diaz, J. Callan, and J.-F. Crespo. Sources of evidence for vertical selection. In SIGIR ’09, pages 315–322, New York, NY, USA, 2009. ACM. [5] P. Bailey, N. Craswell, R. W. White, L. Chen, A. Satyanarayana, and S. M. M. Tahaghoghi. Evaluating whole-page relevance. In SIGIR, pages 767–768, 2010. [6] J. P. Callan, Z. Lu, and W. B. Croft. Searching distributed collections with inference networks. In SIGIR ’95, pages 21–28, New York, NY, USA, 1995. ACM. [7] B. Carterette. Multiple Testing in Statistical Analysis of Systems-Based Information Retrieval Experiments. TOIS, 30)1), 2012. [8] O. Chapelle, D. Metlzer, Y. Zhang, and P. Grinspan. Expected reciprocal rank for graded relevance. In CIKM ’09, pages 621–630, New York, NY, USA, 2009. ACM. [9] C. L. Clarke, M. Kolla, G. V. Cormack, O. Vechtomova, A. Ashkan, S. B¨ uttcher, and I. MacKinnon. Novelty and diversity in information retrieval evaluation. In SIGIR ’08, pages 659–666, New York, NY, USA, 2008. ACM. [10] C. L. Clarke, N. Craswell, I. Soboroff, and A. Ashkan. A comparative analysis of cascade measures for novelty and diversity. In Proceedings of ACM WSDM 2011, 2011. [11] K. J¨ arvelin and J. Kek¨ al¨ ainen. Cumulated gain-based evaluation of ir techniques. ACM Trans. Inf. Syst., 20:422–446, October 2002. [12] X. Li, Y.-Y. Wang, and A. Acero. Learning query intent from regularized click graphs. In SIGIR, 2008. [13] A. Moffat and J. Zobel. Rank-biased precision for measurement of retrieval effectiveness. ACM Trans. Inf. Syst., 27:2:1–2:27, December 2008. [14] D. Nguyen, T. Demeester, D. Trieschnigg, and D. Hiemstra. Federated Search in the Wild, The Combined Power of over a Hundred Search Engines In CIKM 2012, 2012. [15] A. K. Ponnuswami, K. Pattabiraman, Q. Wu, R. Gilad-Bachrach, and T. Kanungo. On composition of a federated web search result page: using online users to provide pairwise preference for heterogeneous verticals. In WSDM ’11, pages 715–724, New York, NY, USA, 2011. ACM. [16] T. Sakai and R. Song. Evaluating diversified search results using per-intent graded relevance. In SIGIR, pages 1043–1052, 2011. [17] T. Sakai. Evaluating evaluation metrics based on the bootstrap. In Proceedings of ACM SIGIR 2006, pages 525-532, 2006. [18] T. Sakai and R. Song. Diversified Search Evaluation: Lessons from the NTCIR-9 INTENT Task In Information Retrieval, 2013. [19] M. Sanderson, M. L. Paramita, P. Clough, and E. Kanoulas. Do user preferences and evaluation measures line up? In SIGIR, pages 555–562, 2010. [20] R. L. T. Santos, C. Macdonald, and I. Ounis. Aggregated search result diversification. In Proceedings of the 3rd International Conference on the Theory of Information Retrieval, pages 250–261, Bertinoro, Italy, 2011. Springer. [21] T. Sakai. Evaluation with informational and navigational intents. In WWW, 499-508, 2012. [22] M. Shokouhi. Central-Rank-Based Collection Selection in Uncooperative Distributed Information Retrieval. ECIR, pages 160-172, 2007. [23] L. Si and J. Callan. Relevant document distribution estimation method for resource selection. In Proceedings of the 26th annual international ACM SIGIR conference on Research and development in information retrieval, pages 298-305, 2003. [24] C. Zhai, W. Cohen and J. Lafferty. Beyond independent relevance: Methods and evaluation metrics for subtopic retrieval. In Proceedings of ACM SIGIR 2003, pages 10-17, 2003. [25] K. Zhou, R. Cummins, M. Lalmas, and J. Jose. Evaluating large-scale distributed vertical search. In LSDS-IR workshop in CIKM11, 2011. [26] K. Zhou, R. Cummins, M. Halvey, M. Lalmas and J. Jose. Assessing and Predicting Vertical Intent for Web Queries. In ECIR 2012., Barcelona, Spain, 1-5 April 2012. [27] K. Zhou, R. Cummins, M. Lalmas and J.M. Jose. Evaluating aggregated search pages. In SIGIR, 115-124, 2012. [28] K. Zhou, R. Cummins, M. Lalmas, and J. M. Jose. Evaluating reward and risk for vertical selection. CIKM 2012: Pages 2631-2634.
Table 5: Concordance test results with the TREC FedWeb13 Track data (50 topics; 36 simulated runs). Statistically significant differences with the sign test are indicated by △(α = 0.05) and N(α = 0.01). (a). (VS) gold standard: vertical selection precision (precv ) IA-nDCG D#-nDCG ASDCG α-nDCG 0.742/0.792△ 0.755/0.783△ 0.763/0.784△ (10222) (9882) (8857) IA-nDCG 0.798/0.713N 0.797/0.696N (6105) (6521) D#-nDCG 0.747/0.770△ (5664) ASDCG ASRBP
-
-
(b). (VD) gold standard: vertical recall (recv ) IA-nDCG D#-nDCG α-nDCG 0.616/0.875N 0.605/0.881N (10222) (9882) IA-nDCG 0.672/0.747N (6105) D#-nDCG -
-
ASDCG
-
-
ASDCG 0.660/0.831N (8857) 0.871/0.531N (6521) 0.917/0.442N (5664) -
ASRBP
-
-
-
ASRBP 0.758/0.788△ (9155) 0.775/0.715N (7595) 0.751/0.759 (6262) 0.728/0.784△ (3230) -
ASERR 0.769/0.783 (10586) 0.802/0.715N (8764) 0.781/0.754△ (8453) 0.771/0.754 (5351) 0.775/0.742△ (8309)
ASRBP 0.664/0.831N (9155) 0.863/0.571N (7595) 0.920/0.493N (6262) 0.726/0.735 (3230) -
ASERR 0.653/0.828N (10586) 0.847/0.605N (8764) 0.874/0.568N (8453) 0.742/0.761 (5351) 0.732/0.741 (8309)
(c). (IS) gold standard: mean precision of vertical retrieved items (mean-prec) IA-nDCG D#-nDCG ASDCG ASRBP α-nDCG 0.358/0.838N 0.314/0.883N 0.331/0.867N 0.312/0.892N (10222) (9882) (8857) (9155) IA-nDCG 0.430/0.779N 0.526/0.665N 0.466/0.750N (6105) (6521) (7595) D#-nDCG 0.686/0.470N 0.598/0.603 (5664) (6262) ASDCG 0.412/0.801N (3230) ASRBP (d). (RP) gold standard: Spearman Correlation IA-nDCG D#-nDCG α-nDCG 0.640/0.504N 0.625/0.527N (10222) (9882) IA-nDCG 0.469/0.640N (6105) D#-nDCG -
with “perfect” AS page (corr) ASDCG ASRBP 0.618/0.537N 0.620/0.535N (8857) (9155) 0.438/0.657N 0.466/0.640N (6521) (7595) 0.511/0.587N 0.538/0.585△ (5664) (6262) 0.585/0.543△ (3230) -
ASERR 0.408/0.791N (10586) 0.738/0.454N (8764) 0.843/0.292N (8453) 0.897/0.255N (5351) 0.857/0.293N (8309)
ASERR 0.601/0.544△ (10586) 0.463/0.673N (8764) 0.515/0.617N (8453) ASDCG 0.553/0.632N (5351) ASRBP 0.544/0.611N (8309) (e). (VS+IS) gold standard: vertical selection precision AND vertical item mean precision (precv +mean-prec) IA-nDCG D#-nDCG ASDCG ASRBP ASERR α-nDCG 0.253/0.656N 0.237/0.689N 0.256/0.677N 0.236/0.701N 0.317/0.616N (10222) (9882) (8857) (9155) (10586) IA-nDCG 0.351/0.541N 0.424/0.443 0.352/0.524N 0.598/0.301N (6105) (6521) (7595) (8764) D#-nDCG 0.531/0.348N 0.431/0.454△ 0.661/0.213N (5664) (6262) (8453) ASDCG 0.267/0.632N 0.700/0.188N (3230) (5351) ASRBP 0.672/0.200N (8309) (f). (VS+IS+VD) gold standard: vertical selection precision AND vertical item mean precision AND vertical recall (precv +mean-prec+recv ) IA-nDCG D#-nDCG ASDCG ASRBP ASERR α-nDCG 0.195/0.593N 0.180/0.619N 0.218/0.594N 0.203/0.612N 0.267/0.545N (10222) (9882) (8857) (9155) (10586) IA-nDCG 0.257/0.421N 0.392/0.271N 0.327/0.347 0.541/0.205N (6105) (6521) (7595) (8764) D#-nDCG 0.495/0.179N 0.410/0.273N 0.596/0.128N (5664) (6262) (8453) ASDCG 0.237/0.527N 0.576/0.172N (3230) (5351) ASRBP 0.552/0.179N (8309) (g). (VS+IS+RP+VD) golden standard: ALL single-component metrics (precv +mean-prec+recv +corr) IA-nDCG D#-nDCG ASDCG ASRBP ASERR α-nDCG 0.131/0.350N 0.117/0.368N 0.139/0.361N 0.128/0.369N 0.164/0.332N (10222) (9882) (8857) (9155) (10586) IA-nDCG 0.128/0.263N 0.194/0.183 0.166/0.235N 0.287/0.137N (6105) (6521) (7595) (8764) D#-nDCG 0.248/0.090N 0.162/0.211△ 0.324/0.071N (5664) (6262) (8453) ASDCG 0.131/0.315N 0.345/0.113N (3230) (5351) ASRBP 0.326/0.104N (8309)