IEEE TRANSACTIONS ON SMART GRID, VOL. 3, NO. 2, JUNE 2012
887
On the Transient Behavior of Large-Scale Distribution Networks During Automatic Feeder Reconfiguration Vitaly Spitsa, Member, IEEE, Xuanchang Ran, Reynaldo Salcedo, Student Member, IEEE, Juan F. Martinez, Member, IEEE, Resk Ebrahem Uosef, Member, IEEE, Francisco de León, Senior Member, IEEE, Dariusz Czarkowski, Member, IEEE, and Zivan Zabar, Senior Member, IEEE
Abstract—The paper presents an in-depth analysis of the automatic reconfiguration and self-healing principles of the next generation (3G) smart grid of a real metropolitan distribution network. The large network is to be divided dynamically and remotely controlled into three smaller subnetworks to further increase the reliability of electrical power distribution secondary networks. When one subsection is experiencing difficulties, there is no longer the need to de-energize the entire network. A time-domain (EMTP) model has been developed and validated by comparing simulations with recordings of actual transient events. Different switching and fault scenarios are investigated using this model. Analysis of the results provides important conclusions on equipment rating, relay protection coordination, voltage regulation, switching and operation strategies which are discussed in the paper. A subset of these results is presented for illustration. This extensive study of a complex urban network suggests that: 1) before implementation of smart grid principles, it would be prudent to supplement steady-state analysis with time-domain analysis to avoid problems, such as installation of improperly rated equipment, and improper relay-protection coordination; and 2) EMTP-type programs may be used to conduct the time-domain analysis, despite the enormous number of elements contained in an urban network. Index Terms—Distribution automation, power distribution, power system modeling, smart grid, switching transients, time-domain analysis.
I. INTRODUCTION
P
ERMANENTLY increasing power demand, growing requirements for electrical power quality and reliability, necessity of cost reduction, and physical space limitations in large metropolitan areas are some of the reasons why distribution companies need to modernize their networks by implementing new smart grid concepts [1]. Traditional radial distribution networks cannot provide the required level of reliability in large cities, especially in their downtown areas [2]. Therefore, spot network and secondary grid configurations are used there [3], [4]. The secondary grid networks offer the highest reliability of power supply at the cost of (perhaps excessive) redundancy. Manuscript received June 22, 2011; revised October 04, 2011; accepted January 24, 2012. Date of current version May 21, 2012. Paper no. TSG-002172011. V. Spitsa, X. Ran, R. Salcedo, F. de León, D. Czarkowski, and Z. Zabar are with the Department of Electrical and Computer Engineering, Polytechnic Institute of New York University, Brooklyn, NY 11201 USA (e-mail:
[email protected];
[email protected];
[email protected];
[email protected];
[email protected];
[email protected]). J. F. Martinez and R. E. Uosef are with the Consolidated Edison Inc., New York, NY 10003 USA (e-mail:
[email protected];
[email protected]). Digital Object Identifier 10.1109/TSG.2012.2186319
One of the main principles in the smart grid philosophy is the ability of the distribution network to self-heal after disturbance events [5], [6]. The implementation of this principle with the existing infrastructure and architecture requires sectionalizing the distribution network and the installation of additional switching devices and metering equipment. Moreover, the development of two-way communication links and advanced algorithms for fault location detection for automatic switching and control are becoming necessary. In a real distribution network, any mistake in the design and/or implementation of new operational techniques may lead to very serious economic and/or social consequences. Therefore, the smart grid concepts must be thoroughly studied using extensive computer simulations with highly accurate models. In the past, reconfigurable systems were investigated by means of steady-state analyses [7]–[9]. Nowadays, however, there is a growing understanding that time-domain simulations are to be performed in order to ensure the correct operation of large, complex distribution networks under different fault and switching conditions [10]. A number of power system software programs are capable of performing a transient analysis [11], [12]. Some of their practical applications for electrical distribution networks can be found in [13]–[18]. Special attention has been paid to the investigation of the dynamic behavior of networks equipped with distributed generators. However, the size of the studied systems is relatively small. This paper presents the design verification and practical implementation of the above mentioned smart grid principle in a real-life large-scale distribution network of Consolidated Edison Inc. of New York. To ensure the correct and safe operation of this network that has thousands of elements, comprehensive transient analyses have been conducted for numerous switching and fault scenarios using the EMTP-RV [19]. For this purpose, very detailed three-phase time-domain models are generated and implemented in the EMTP as described in [20], [21]. A very large text file, the netlist, is produced containing the models for all circuit components, the dynamics of all controllers, and the switching strategies. Simulation results consist of thousands of recorded variables including the status of switching devices, voltages and currents at different locations of the networks. These results are processed automatically using MATLAB [22] to detect power quality problems, undesirable operation of the relay protection, and to verify the correctness of the equipment selection. The automatic self-healing principle of the smart grid presented in this paper is aimed to further improve service reliability and to be a solution to a number of problems recognized in modern urban distribution networks, namely: Low equip-
1949-3053/$31.00 © 2012 IEEE
888
IEEE TRANSACTIONS ON SMART GRID, VOL. 3, NO. 2, JUNE 2012
ment utilization, high cost of redundant elements, cascading phenomena, unobservability of certain faults, anomalies due to the tremendous complexity of the network, and difficulties in fault location [4], [23]. Although the idea of network reconfiguration is not new and seems to be an obvious solution, the present paper discovers phenomena in the large-scale distribution networks that have special significance when implementing the smart grid principles in the metropolitan areas. The main contribution of this paper is that it reveals a complex series of events that may lead to equipment failure and malfunction of the reconfigurable smart grids. The paper shows the importance of using detailed three-phase time-domain simulations for the smart grid design. Additionally, the paper presents the largest dynamical model of any distribution network reported so far in the literature. In fact, its size surpasses the size of the largest EMTP model representing an entire power system [24]. The present paper also intends to make the power engineering community aware that the modern transient analysis programs (EMTP-type) are already capable of simulating very large networks in PC computers. The paper is organized as follows. Section II introduces typical configurations of distribution networks. A description of the network used for the implementation of the smart grid principle is given in Section III. The principle itself is described in Section IV. Modeling and simulation highlights are given in Section V. The time-domain simulation results of different fault and switching scenarios are accompanied by the detailed analysis in Section VI. Finally, the concluding remarks of the paper are presented in Section VII. II. TYPICAL DISTRIBUTION NETWORK CONFIGURATIONS Configurations of modern distribution networks can be classified into three major types [3]: • radial networks; • spot networks; • secondary grid (area) networks. These types are depicted schematically in Fig. 1. The radial network has found wide application due to its simplicity and relatively low cost. The feeders of the radial network leave a substation and distribute electrical power in the designated area without any additional connections to any other points of supply. This configuration is especially popular in rural areas where long feeders supply isolated loads. The simplicity of radial networks comes on account of their reliability. To make the radial networks more reliable, damaged parts of the feeders can be isolated and alternative power supplies can be connected by means of mid-feeder and tie switches installed in more advanced systems. Operation of the switches can be manual or automatic, local or from a remote control center. However, even this enhancement cannot provide the required level of reliability in large metropolitan areas. The interconnected configurations such as spot and secondary grid networks are used there. The spot network has secondary terminals of the distribution transformers connected together to a single bus. At the same time, their primary terminals are supplied from different feeders or power sources. This arrangement is widely used in urban areas, especially when it is needed to ensure
Fig. 1. Typical configurations of distribution networks. (a) Radial network. (b) Spot network. (c) Secondary grid network.
reliable delivery of electrical power to some particular facilities, for example, hospitals. Downtown areas of large cities are characterized by high power demands, increased customer density and, at the same time, by high prices of real estate and extreme scarcity of free space. In addition, since most of the financial and commercial businesses are located in these areas, the requirements of uninterruptable power supply and good power quality are especially strict. To comply with these requirements, it is a common practice to build meshed networks instead of traditional radial or spot ones. The meshed networks are referred to in the literature as secondary grid networks, area networks or secondary networks. It should be noted that, in North America, word “secondary” is often omitted and term “network” is used for the secondary grids. In this configuration, the distribution transformers are supplied by different feeders from the same area substation. The low voltage part of the distribution network is a meshed grid with distributed loads. The complex real distribution network analyzed in this paper has elements of all three major configurations described above, with the majority of its loads connected in the secondary grid part. III. DESCRIPTION OF THE DISTRIBUTION NETWORK UNDER STUDY As mentioned previously, modern metropolitan distribution networks suffer from a number of problems imposed by their hardwired design. To resolve these problems, Con Edition’s 3G System of the Future Department has initiated a pilot project
SPITSA et al.: ON THE TRANSIENT BEHAVIOR OF LARGE-SCALE DISTRIBUTION NETWORKS
889
Fig. 2. Basic interconnection of elements in the Flushing network.
called “Advanced Distribution Operation with DER Integration.” The main objective of this project is to implement smart grid concepts [1], [5] in a very large distribution network. It requires addressing different topics starting from equipment design and ending at distributed generation allocation, plug-in electrical vehicle influence, smart metering, automatic operation, and control. Due to space limitation, this paper is focused only on obtaining reconfigurable system architecture with advanced automation and self-healing capabilities. At the present time, practical implementation of the reconfigurable smart grid is taking place in the Flushing network which supplies electrical power to the northern part of Queens in New York City. The Flushing network is a large-scale distribution network with a very complex configuration that is hard to visualize in its entirety. Therefore, only its basic interconnections are shown in Fig. 2. As can be seen in the figure, the secondary side of every distribution transformer in the network is equipped with a network protector [25]. This switching device ensures unidirectional active power flow from the feeders to the secondary grid. The network protector automatically trips when active power flows in the reverse direction, and recloses when conditions for forward active power flow are restored. It should be noted that this peculiarity of distribution networks becomes one of the most dominant factors affecting the smart grid design where a large number of distributed generators (DGs) and switching events are considered [3]. The Flushing network, at peak loading conditions, supplies over 400 MW through about 10 000 primary feeder sections. It has over 1000 transformers, about 7000 loads and more than 17 000 secondary grid sections. Detailed information about elements of the Flushing network and description of its peak and light loading conditions are presented in [20], [21]. According to the operational plan, this network will be subdivided into three subnetworks as shown in Fig. 3. Power demands of the subnetworks are given in Table I. The Flushing network has 30 feeders at 27 kV voltage level. Ten of them supply power to subnetwork A only (feeders 1–10 according to numeration of their breakers in Fig. 4). Twenty feeders continue to subnetwork B (feeders 11–30) and only eight feeders continue to subnetwork C. As can be seen in Fig. 2, the subdivision of the distribution network into
the subnetworks will be implemented by means of especially designed on-load (non-interrupting) subnetwork sectionalizing switches. There are 20 one-way subnetwork switches between subnetworks A and B at the 27 kV level. Separation of subnetworks B and C at the 27 kV level will be achieved using 6 one-way subnetwork sectionalizing switches and 2 multiway switches for increased network reliability. It should be noted that all the subnetworks are also interconnected at the voltage level of a 4 kV. Therefore, to achieve complete isolation of subnetworks B and C, corresponding 4 kV breakers should be opened together with the 27 kV sub-network sectionalizing switches. IV. RECONFIGURATION OF A SMART GRID The automatic reconfiguration of the described smart grid is aimed to provide increased reliability of the electrical power supply. Optimal operation and loss minimization criteria are not accounted for in the decision-making process. That is, the system is designed to identify a fault when it occurs, determine its location, isolate the damaged part of the distribution network and reconnect (when possible) the undamaged part to the power source through an alternative path. For example, let us assume that a three-phase short-circuit occurs on feeder 2 in subnetwork A (see Fig. 2). Using current and voltage measurements, this fault is identified and located. Feeder 2 is de-energized when the circuit breaker at its head trips, responding to the short-circuit currents, and all the network protectors along this feeder open due to the reverse power flow from the secondary grid. Then, the damaged part of the feeder is isolated by automatic opening of the subnetwork switch on the boundary between subnetworks A and B. Finally, the segments of feeder 2 in subnetworks B and C are re-energized when the normally open tie switch between feeders 1 and 2 closes. The above mentioned principle of the smart grid reconfiguration seems to be very simple. However, its practical implementation may face serious difficulties especially in the existing distribution networks. This is due to the fact that dozens of the switching and protective devices should operate in a properly coordinated manner while the network configuration changes.
890
IEEE TRANSACTIONS ON SMART GRID, VOL. 3, NO. 2, JUNE 2012
V. MODELING AND SIMULATION
Fig. 3. Implementation of smart grid concepts in the Flushing network. TABLE I POWER DEMANDS OF FLUSHING SUBNETWORKS
Implementation of the new smart grid concepts in a real network requires an intensive theoretical analysis and hundreds of transient simulations to be done first. To automate this process, a special software tool based on MATLAB and EMTP-RV has been developed. It creates three-phase time-domain models of the network for different operation scenarios, simulates them, performs the analysis of the obtained results and reports overcurrents, overvoltages, undervoltages; and the status of every switching device. The EMTP model for the Flushing network consists of over 2 million lines of data (network and control signals). Each time step requires the solution of a matrix equation of order larger than 100 000. Using an integration step of 50 s it takes about 16 h to solve a case with a simulation time of 650 ms in a PC computer with an Intel Core i7 CPU 975 processor operating at 3.33 GHz and installed RAM of 24 GB. A detailed description of the modeling process has been reported in [20] and [21]. The obtained EMTP models were validated in the following five ways: 1) Comparing steady-state solutions against load flow results calculated by the field-validated Poly Voltage Load (PVL) flow program for peak and light load conditions [26]. Differences in node voltages and section currents are very small. 2) Simulating some first contingencies. Similar good agreement between EMTP and PVL is obtained. 3) Evaluating several second contingencies. The results are consistent with PVL. 4) Comparing for many three-phase short circuits, results obtained with the EMTP with those from the PVL short-circuit computation facility. Very small differences occurred in all feeders for all cases. 5) Simulating, with the EMTP, a number of actual short-circuit events that had been recorded with the PQ Node [27]. The wave shapes of all the three-phase voltages and currents obtained from the simulation compared very well with the measurements. These results demonstrate that the EMTP model of the network is correct. The details can be found in [20] and [21]. VI. FAULT AND SWITCHING SCENARIOS
Success can be achieved only if the actual transients of the distribution network can be accurately reproduced with time-domain simulations at the design stage. Otherwise, there always exists a possibility that the true behavior of the network is overlooked and the developed switching strategies may not work properly or even harm the network. In the forthcoming sections a short review of the simulation approach used to investigate smart grid reconfiguration and some issues related to the required switching are given. Due to space limitation, the discussion is focused only on the following topics: • required speed of switching; • switching failures; • effect of backfeeding; • overcurrents and equipment malfunctioning.
As was mentioned previously, hundreds of simulations have been performed to analyze the performance of the proposed smart grid concepts. Here, four scenarios are presented to illustrate some of the challenges posed by the implementation of this new technology. Fig. 3 shows a simplified diagram of the network under analysis. The scenarios, corresponding to realistic, but critical situations include: 1) Isolation of subnetworks B and C after 4 contingencies; 2) isolation of subnetworks B and C with one switch stuck; 3) isolation of subnetworks B and C with two switches stuck; 4) auto-loop operation. A. Isolation of Subnetworks B and C After 4 Contingencies One of the main features required from the next generation of distribution networks is the ability to be reconfigured and to restore power supply to the maximum number of customers as soon as possible after a major fault. To investigate this issue, the following scenario is studied: Four sequential bolted threephase short-circuits occur in subnetwork B on feeders 12, 13, 16, and 17. The faults occur within a time interval of 6 cycles of the fundamental power frequency starting at cycle 2 for feeder 12
SPITSA et al.: ON THE TRANSIENT BEHAVIOR OF LARGE-SCALE DISTRIBUTION NETWORKS
891
TABLE II INSTANTANEOUS CURRENT SETTINGS OF RELAY PROTECTION
and ending 6 cycles later with feeder 17 (see Figs. 4–7). As a result, abnormally high currents flow in the corresponding feeders activating the instantaneous overcurrent protection devices and tripping their breakers (12, 13, 16, and 17) within 5–6 cycles. Peak values of the fault currents through the feeder breakers and instantaneous current settings of the relay protection are given in Table II. During the faults, there is reverse power flowing from the secondary grid to the fault locations through the network transformers of the faulted feeders. This phenomenon is called backfeed. A complete backfeed path includes also undamaged feeders and their transformers delivering power to the low-voltage grid in the forward direction. The reverse power flow is sensed by the network protectors [25] installed on the secondary side of the network transformers of the faulted feeders. As a result, these low-voltage network protectors trip on reverse power in about 6 cycles completely isolating the faults. It should be noted that, if one opens sectionalizing switches 2, 3, 6, and 7 (of the faulted feeders) between subnetworks A and B after the fault is isolated, feeder breakers 12, 13, 16, and 17 can be reclosed and a part of subnetwork A supplied by the disconnected feeders will be re-energized. This automatic operation has been simulated in a time interval from the 10th to 20th cycle. Finally, in the present switching scenario subnetworks B and C are de-energized. For this purpose, 4 kV breakers between subnetworks A and B are opened first (cycles 22–25 of the fundamental frequency). Then, sectionalizing switches 1, 3–5 and 8–20 between subnetworks A and B are opened as well. In summary, the present case includes 28 intentional switching events which can be produced remotely by an operator or artificial intelligence mechanism as a response to 4 three-phase short circuits. Additionally, there are dozens of network protectors and feeder breakers whose dynamics are represented, and which operate programmatically as per their settings. Some of the simulation results are given in Figs. 4–7. The currents flowing in the sectionalizing switch 9 between sub-networks A and B is shown in Fig. 4. It can be seen that these currents are almost unaffected by the four short-circuits at the beginning of the simulation. However, when the sectionalizing switches start opening to disconnect subnetworks B and C, sectionalizing switch 9 picks-up the load usually served by other feeders. As a result, significant currents flow. Phase voltages on the subnetwork B side of the sectionalizing switch 9 are shown in Fig. 5. It can be seen that during short-circuit conditions the voltage sags to about 85% of the prefault value. After the isolation of the faulted sections, the voltage is
Fig. 4. Currents in the last opening switch between subnetworks A and B (scenario A).
Fig. 5. Voltage on subnetwork B side of the last opening switch between subnetworks A and B (scenario A).
restored to 98% of its initial value. Finally, when subnetworks B and C are completely disconnected, the voltages decay exponentially with an increasing frequency due to discharge of the energy stored in feeder capacitances and network transformers. Subnetworks B and C are completely discharged in approximately 1.2 s. The currents in the circuit breaker of the first faulted feeder (feeder 13) are given in Fig. 6. They are equal to 427 A rms before the three-phase short-circuit occurred. When the fault occurs the currents increase to about 7.5 kA rms. The feeder breaker trips at approximately 120 ms. Then it is intentionally reclosed at 235 ms after the isolation of the fault. A short-duration capacitive inrush current can be observed right after the reclosing. It should be noted that, as a result of the fault, all the network protectors of the transformers connected to feeder 13 trip disconnecting the secondary grid. Therefore, the reclosing takes place at nonload conditions. It can be seen in Fig. 6 that energization of the network transformers under nonload conditions draws inrush currents having a first peak of 3686 A. This inrush current decreases from cycle to cycle. At the same time, the reclosing of the feeder breaker creates the conditions for the network protectors to close (automatically) in the undamaged part of the feeder (subnetwork A). The influence of the network protector reclosing on the currents in the circuit breaker can be observed in Fig. 6 starting from the time instant of 385 ms. Finally, phase currents in one of the healthy feeders (feeder 23) are shown in Fig. 7. These currents are equal to 369 A rms
892
Fig. 6. Currents in the feeder breaker of the first faulted feeder (scenario A).
IEEE TRANSACTIONS ON SMART GRID, VOL. 3, NO. 2, JUNE 2012
Fig. 8. Currents in the stuck sectionalizing switch #4 between subnetworks A and B (scenario B).
the practical implementation. In particular, there are important questions related to the reliability of communications, switching coordination, and synchronization. B. Isolation of Subnetworks B and C With One Switch Stuck
Fig. 7. Currents in the feeder breaker of one of the unfaulted feeders (scenario A).
before the three-phase short-circuits occurred on the adjacent feeders. During the fault, the currents became 2–3 times higher. A peak value of the phase C current reaches 1883 A. When the four short-circuits are isolated, the number of feeders supplying subnetworks B and C reduces. As a result, the individual loading of the healthy feeders increases with respect to the prefault operating conditions. The phase currents in feeder 23 after the isolation of all four short circuits reach values of almost 600 A rms. Opening of the subnetwork sectionalizing switches that starts at 500 ms leads to the complete isolation of subnetworks B and C. Thus, the currents through the feeder breaker supply the loads only in the subnetwork A. The phase currents at the final stage of the simulation are 133 A rms only. In addition to illustrating the operating logic during the process of the fault isolation and network reconfiguration, the importance of the simulation presented is that it reveals the importance of fast and coordinated switching. For example, one can see that the load redistribution as a result of the sequential opening of the switches produces very high currents in the remaining closed switches. These switches are not designed to interrupt fault currents. Therefore, if the rms values of the currents exceed the rated 600 A (for the investigated network), the operation of the switches is blocked by their protection mechanism. As a result, the energized feeders will become overloaded, perhaps causing tripping of the corresponding feeder breakers at the area substation. To a great extent, the results of the time-domain analysis of the operation of the 3G smart grid technologies, allowed discovering potential dangers that need to be addressed during
Secure operation of the distribution network must be ensured not only under normal operating conditions, but also when equipment fails. The present case consists of disconnecting subnetworks B and C from the area substation when one of the subnetwork sectionalizing switches does not open. This may happen due to electrical or mechanical problems in the switch itself or due to loss of communication. The 4 kV breakers between subnetworks A and B open from cycle 4 to cycle 7 (see Figs. 8 and 9). Then the 27 kV subnetwork sectionalizing switches between subnetworks A and B are commanded to open from cycles 10 to 14. It is assumed that switch 4 is stuck; i.e., only 19 switches out of 20 open. As a result, subnetworks B and C are not completely disconnected. The currents in the phases of the stuck sectionalizing switch are given in Fig. 8. As can be seen in the figure, the currents are equal to 308.5 A rms under normal operating conditions. Then, when the remaining 19 subnetwork sectionalizing switches open, the current in the stuck switch increases significantly since all the loads in subnetworks B and C are fed through the stuck switch. This is different from the normal operating conditions where the load is distributed among different feeders. The current of 1907 A rms in the stuck switch is over three times higher than the rated 600 A rms. This overloading can be also observed at the head of the feeder with the stuck sectionalizing switch (feeder 14). The currents in the feeder breaker are presented in Fig. 9. In this figure, the initial value of the current is equal to 441 A rms. After opening of 19 switches between subnetworks A and B, the feeder breaker current increases to 1762 A rms, exceeding the settings of the overcurrent relay protection (1280 A rms). It is interesting to note that in this case the currents in the sectionalizing switch in the middle of the feeder are higher than the currents in the head of this feeder. This is so because after opening of the 19 switches a part of the current through the stuck switch comes as backfeed from the low-voltage grid of subnetwork A, which is supplied by all the feeders. The power flows from the secondary side to the primary side of the network transformers connected to the feeder with the stuck switch in subnet-
SPITSA et al.: ON THE TRANSIENT BEHAVIOR OF LARGE-SCALE DISTRIBUTION NETWORKS
Fig. 9. Currents in the feeder breaker of the feeder with the stuck sectionalizing switch (scenario B).
work A. When the feeder breaker trips at approximately 320 ms as shown in Fig. 9, the backfeeding through the network transformers in subnetwork A does not stop immediately. Tripping of the network protectors is gradual and, as a result, the phase currents in the stuck switch (Fig. 8) reduce gradually. A current of 802 A rms flows in the stuck switch for the last three cycles before the last network protector trips. After its tripping, a part of the feeder with the stuck switch supplying subnetwork A is completely isolated from the area substation. Thus, at the end, subnetworks B and C are de-energized and subnetwork A is supplied by 29 feeders instead of 30. One may conclude that if not all the sectionalizing switches operate, excessive currents can be developed preventing on-load operation (sectionalized switches are designed to interrupt rated current only). In such cases, the feeders must be disconnected from the area substation by the corresponding breakers to prevent overloading of the equipment such as cables, transformers, switches, etc. The simulation has shown how proper settings of the relay protection prevent extended exposure of the distribution network elements to excessive currents resulting from the malfunction of a sectionalizing switch during the isolation of a subnetwork. C. Isolation of Subnetworks B and C With Two Switches Stuck This scenario is the simulation of switch disoperation. It is based on the previous case including all the intentional switching. The only difference is that now two sectionalizing switches, 8 and 10, are stuck and do not open. The opening of 18 switches between subnetworks A and B results in overloading the two stuck switches. Currents in the phases of sectionalizing switch 8 are shown in Fig. 10. Their initial values are 319 A rms only. However, after the switching, one may observe currents as high as 1560 A rms. Similarly to the previous case, a part of the current is supplied by backfeeding through the network transformers connected to feeder 18 from the low-voltage grid of subnetwork A. When the corresponding network protectors start to operate reducing the backfeeding, the currents in sectionalizing switch 8 reduce slightly to a final value of 1240 A rms. This is due to the fact that the current at the head of feeder 18 is insufficient to activate its protection and trip the breaker. As a result, sectionalizing switches 8 and 10 between subnetworks remain overloaded to more than twice their rating. Once again, it should be noted that the subnetwork sectionalizing switches can interrupt only their rated current. As a result, when
893
Fig. 10. Currents in the stuck sectionalizing switch #8 between subnetworks A and B (scenario C).
Fig. 11. Voltage on the secondary side of one of the opened sectionalizing switches (scenario C).
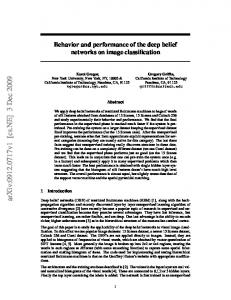
two sectionalizing switches are stuck, the overload conditions which are potentially harmful for the electrical equipment will persist and subnetworks B and C will not be isolated. This simulation has shown that to prevent severe over currents in the switches, the proposed disconnection strategy needs to be revised, perhaps tripping feeder breaker 18 first, i.e., adjusting the relay protection settings. Analyzing the switching scenario, one may notice an interesting behavior of the voltages on subnetwork B. One of these switches (switch 11) is taken as an example in Fig. 11. Before opening, an initial voltage of 27 kV rms line-to-line is present in the subnetwork B. When the switch opens, the voltage reduces to 14 kV rms line-to-line. The low voltage conditions are explained by a large voltage drop in the distribution network as a result of power supplied to subnetworks B and C through two feeders only. It should be noted that after opening of sectionalizing switch 11, the network protectors of all the transformers connected to feeder 21 started to sense reverse flow of active power which is required to compensate core losses of the transformers. As a result, they tripped after approximately 6 cycles, isolating feeder 21 completely. Then, as shown in Fig. 11, the feeder discharge continued for about 250 ms. D. Auto-Loop Operation As can be seen in Fig. 3, the distribution network under study has two multi-way switches that form two auto-loops. In this auto-loop configuration subnetwork C is supplied by feeder 19 and 24 (nodes 2 and 3 of the second delta-connected multi-way
894
Fig. 12. Currents in the circuit breaker of the faulted feeder (scenario D).
switches are closed). It is assumed in the present switching scenario that a three-phase short-circuit occurred in feeder 25 in subnetwork A after 4 cycles from the beginning of the simulation. As the result, the corresponding feeder breaker trips on instantaneous over-current in 5 cycles, effectively de-energizing the entire feeder. Due to the installation of the sectionalizing switches, the fault could be isolated in subnetwork A. For this purpose, switch 15 between subnetworks A and B is opened after 10 cycles. After the complete isolation of the short-circuit, a part of feeder 25 in subnetwork B can be re-energized through the second multi-way switch. This goal is achieved by connecting nodes 1 and 2 in the switch after 25 cycles. As a result, a part of feeder 25 in subnetwork B is powered from feeder 24. Phase currents in the feeder breaker 25 are given in Fig. 12. The initial value is about 95 A rms and rises to more than 18 kA rms during the fault. As it can be seen in the figure, an attempt to reclose the feeder breaker fails since the three-phase shortcircuit occurred in subnetwork A was not cleared. Currents in feeder breaker 24 are given in Fig. 13. This feeder is used as a backup to subnetwork B in cases when feeder 25 is de-energized due to a fault in subnetwork A. Initially, the currents in the breaker are equal to 233 A rms. One may observe their rise to 313 A rms due to the three-phase short-circuit (subnetworks B and C are still connected at both 27 kV and 4 kV levels). When the fault is isolated, the breaker currents reduce to 244 A rms. One may note that they are slightly higher than in the pre-fault conditions. This is because the increased substation voltages obtained after a part of feeder 25 in subnetwork A is disconnected. When the second section of this feeder, located in subnetwork B, is re-energized one may observe transformer inrush currents of about 1228 A. It should be noted that these short-duration high-magnitude currents do not cause any problems in the present case. Inrush currents become a concern when their high values are sustained for a long period of time and, as a result, may lead to thermal runaways, overloading or relay misoperation. However, extensive transient analysis performed in these studies did not reveal any abnormal conditions resulting from the inrush currents. The final steady-state values of the feeder breaker currents in Fig. 13 are 283 A rms. Currents in the sectionalizing switch 15 used to isolate the damaged part of feeder 25 are shown in Fig. 14. Their values under normal operating conditions are 101 A rms. Analyzing
IEEE TRANSACTIONS ON SMART GRID, VOL. 3, NO. 2, JUNE 2012
Fig. 13. Currents in the circuit breaker of the backup feeder (scenario D).
Fig. 14. Currents in the sectionalizing switch between subnetworks A and B which isolates the three-phase fault (scenario D).
Fig. 14, one concludes that sectionalizing switch 15 interrupts a portion of the short-circuit current, which exceeds 1000 A rms. This finding together with the results obtained in the previous subsections led to consideration of an enhanced sectionalizing switch design since the rated current of the existing switches is 600 A rms only. It should be noted that another possible solution in this case is a delayed switching of sectionalizing switch 15. Indeed, if its operation is postponed, all the network protectors on feeder 25 would have sufficient time to trip. As a result, the entire feeder could be de-energized by these devices and by the circuit breaker. Then the sectionalizing switch would disconnect subnetworks A and B under zero current conditions. The restoration of power to a part of feeder 25 is achieved by closing the multi-way switch as shown in Fig. 15. One may observe a relatively high first peak (of 1005 A) due to the transformer inrush current. For a time interval of approximately 7 cycles of the fundamental power frequency the secondary grid of subnetwork B is still disconnected from feeder 25 (all the network protectors tripped during and after the fault). Then the network protectors automatically reclose and the feeder picks-up a part of the load in subnetwork B. VII. CONCLUDING REMARKS This paper has shown the great importance of performing three-phase transient analysis for implementation of the smart grid reconfiguration principle in large-scale metropolitan distribution networks. The simulations have revealed some of the challenges that utilities may face during the implementation of smart grid technologies in real systems.
SPITSA et al.: ON THE TRANSIENT BEHAVIOR OF LARGE-SCALE DISTRIBUTION NETWORKS
Fig. 15. Currents in the second multi-way switch between nodes 1 and 2 (scenario D).
The simulation results have illustrated that many important design concerns related to equipment rating, relay protection coordination, voltage regulation, switching, and operation strategies of smart grids can be studied only by means of the detailed studies in time-domain. This is so because steady-state analysis cannot capture the complex phenomena occurring as a result of an interaction among dozens of nonlinear devices such as relays, breakers, and transformer magnetizing. The level of precision achieved by the completely automated computer program that was developed especially for the present study allowed for the reconstruction of all transient events measured in the real distribution network. The size of the simulated model is larger than any other dynamic model reported in the literature for the study of distribution systems. The paper has shown that time domain transient simulations on very large distribution systems are within the capabilities of modern transient analysis software (EMTP-type). ACKNOWLEDGMENT The authors would like to thank Prof. Jean Mahseredjian from École Polytechnique de Montréal for providing continuous technical support and enhanced versions of the EMTP-RV software. REFERENCES [1] 110th Congress, United States of America, Title XIII, Energy Independence and Security Act of 2007. [2] R. C. Settembrini, J. R. Fisher, and N. E. Hudak, “Reliability and quality comparisons of electric power distribution systems,” in Proc. IEEE Power Eng. Soc. Transm. Distrib. Conf., 1991, pp. 704–712. [3] M. Behnke, W. Erdman, S. Horgan, D. Dawson, W. Feero, F. Soudi, D. Smith, C. Whitaker, and B. Kroposki, “Secondary network distribution systems background and issues related to the interconnection of distributed resources,” National Renewable Energy Laboratory, Golden, CO, Tech. Rep.NREL/TP-560-38079, 2005. [4] R. P. Fanning, “Implementation of networked primary and secondary distribution systems for U. S. utilities,” in Proc. IEEE Power Eng. Soc. Gen. Meet., 2003, vol. 4, pp. 2425–2429. [5] G. T. Heydt, “The next generation of power distribution systems,” IEEE Trans. Smart Grid, vol. 1, no. 3, pp. 225–235, Dec. 2010. [6] D. Haughton and G. T. Heydt, “Smart distribution system design: Automatic reconfiguration for improved reliability,” in Proc. IEEE Power Energy Soc. Gen. Meet., Minneapolis, MN, Jul. 25–29, 2010, Paper 978-1-4244-6551-4.
895
[7] Y. J. Jeon, J. C. Kim, J. O. Kim, J. R. Shin, and K. Y. Lee, “An efficient simulated annealing algorithm for network reconfiguration in large-scale distribution systems,” IEEE Trans. Power Del., vol. 17, no. 4, pp. 1070–1078, Oct. 2002. [8] A. Coelho and M. G. Da Silva, “Distribution network reconfiguration with reliability constraints,” in Proc. Int. Conf. Power Syst. Technol. (PowerCon), Nov. 21–24, 2004, Paper 0-7803-8610-8/04. [9] H. M. Khodr, J. Martinez-Crespo, M. A. Matos, and J. Pereira, “Distribution systems reconfiguration based on OPF using benders decomposition,” IEEE Trans. Power Del., vol. 24, no. 4, pp. 2166–2176, Oct. 2009. [10] R. Podmore and M. R. Robinson, “The role of simulators for smart grid development,” IEEE Trans. Smart Grid, vol. 1, no. 2, pp. 205–212, Sep. 2010. [11] J. Mahseredjian, V. Dinavahi, and J. A. Martinez, “Simulation tools for electromagnetic transients in power systems: Overview and challenges,” IEEE Trans. Power Del., vol. 24, no. 3, pp. 1657–1669, Jul. 2009. [12] N. Watson and J. Arrillaga, Power Systems Electromagnetic Transient Simulation. London, U.K.: IET, 2003. [13] I. Xyngi, A. Ishchenko, M. Popov, and L. van der Sluis, “Transient stability analysis of a distributed network with distributed generators,” IEEE Trans. Power Syst., vol. 24, no. 2, pp. 1102–1104, May 2009. [14] R. S. Thallam, S. Suryanarayanan, G. T. Heydt, and R. Ayyanar, “Impact of interconnection of distributed generation of electric distribution systems—a dynamic simulation perspective,” in Proc. IEEE Power Eng. Soc. Gen. Meet., Montreal, QC, Canada, Jun. 18–22, 2006, Paper 1-4244-0493-2/06. [15] Z. Miao, M. A. Choudhry, and R. L. Klein, “Dynamic simulation and stability control of three-phase power distribution system with distributed generators,” in Proc. Power Eng. Soc. Winter Meet., New York, Jan. 19–22, 2002, Paper 0-7803-7322-7/02. [16] S. T. Mak, “Propagation of transients in a distribution network,” IEEE Trans. Power Del., vol. 8, no. 1, pp. 337–343, Jan. 1993. [17] J. A. Martinez and J. Martin-Arnedo, “Voltage sag stochastic prediction using an electromagnetic transients program,” IEEE Trans. Power Del., vol. 19, no. 4, pp. 1975–1982, Oct. 2004. [18] B. W. Lee and S. B. Rhee, “Test requirements and performance evaluation for both resistive and inductive superconducting fault current limiters for 22.9 kV electric distribution network in Korea,” IEEE Trans. Appl. Supercond., vol. 20, no. 3, pp. 1114–1117, Jun. 2010. [19] DCG-EMTP (Development Coordination Group of EMTP) Version EMTP-RV, Electromagnetic Transients Program [Online]. Available: http://www.emtp.com [20] V. Spitsa, D. Czarkowski, F. de Leon, and Z. Zabar, “Transient and steady-state analysis for the 3G smart grid concepts: Transient analysis for the Flushing network,” Consolidated Edison Company, New York, Final Rep., 2011. [21] V. Spitsa, R. Salcedo, X. Ran, J. Martinez, R. E. Uosef, F. De León, D. Czarkowski, and Z. Zabar, “Three-phase time-domain simulation of very large distribution network,” IEEE Trans. Power Del., vol. 27, no. 2, pp. 677–687, Apr. 2012. [22] Technical Computing Software MATLAB, The MathWorks, Inc. [Online]. Available: http://www.mathworks.com [23] M. Kezunovic, “Smart fault location for smart grids,” IEEE Trans. Smart Grid, vol. 2, no. 1, pp. 11–22, Mar. 2011. [24] L. Gérin-Lajoie and J. Mahseredjian, “Simulation of an extra large network in EMTP: From electromagnetic to electromechanical transients,” in Proc. Int. Conf. Power Syst. Transients (IPST), Kyoto, Japan, Jun. 2–6, 2009. [25] IEEE Standard Requirements for Secondary Network Protectors, IEEE Standard C57.12.44, 2005. [26] D. D. Sabin, C. Dimitriu, D. Santiago, and G. Baroudi, “Overview of an automatic underground distribution fault location system,” in IEEE Power Energy Soc. Gen. Meet., Calgary, AB, Canada, Jul. 26–30, 2009. [27] Power Quality Instrumentation, PQNode, Dranetz [Online]. Available: http://dranetz.com
Vitaly Spitsa (M’10) received the M.Sc. and Ph.D. degrees in electrical engineering from Technion—Israel Institute of Technology, Haifa, in 2002 and 2009, respectively. He has been a Control and Algorithm Engineer with a motion control company in Israel. Currently, he is a Research Assistant Professor at Polytechnic Institute of New York University, Brooklyn. His research interests are in the areas of power system analysis, electrical machines, drives, and robust control.
896
Xuanchang Ran received the B.Sc. degree in electrical engineering from Southwest Jiaotong University, Chengdu, China, in 2008, and the M.Sc. degree in electrical engineering from Polytechnic Institute of New York University, Brooklyn, in 2010, where he is currently working toward the Ph.D. degree. His research interest is power system analysis and power theory.
Reynaldo Salcedo (S’09) received the B.Sc. and M.Sc. degrees in electrical engineering from Polytechnic Institute of New York University, Brooklyn, in 2010 and 2011, respectively, where he is currently working toward the Ph.D. degree in electrical engineering. His current research area is power system modeling and analysis.
Juan F. Martinez (M’11) received the B.Sc. degree in electrical engineering from Grove School of Engineering, City College of New York, in 2008. Currently, he is an Engineering Supervisor with Consolidated Edison Company, New York. His research interest is in the area of power system analysis.
Resk Ebraham Uosef (M’01) received the B.Sc. and M. Sc. degrees in electrical engineering from Alexandria University Faculty of Engineering, Alexandria, Egypt, in 1979 and 1981, respectively. He received a second M.Sc. degree in electrical engineering and the Ph.D. degree from Polytechnic University, Brooklyn, NY, in 2007 and 2011, respectively. He was an Engineer in a hydropower generating station in Egypt, and then he was the Owner of a consulting firm for an electric construction company in Egypt. He joined Distribution Engineering Department, Consolidated Edison, New York, in 2003, and is currently responsible for Con Edison’s distribution system design and analysis. Dr. Uosef is a Registered Professional Engineer in the State of New York.
Francisco de León (S’86–M’92–SM’02) received the B.Sc. and M.Sc. (Hons.) degrees in electrical engineering from the National Polytechnic Institute,
IEEE TRANSACTIONS ON SMART GRID, VOL. 3, NO. 2, JUNE 2012
Mexico City, Mexico, in 1983 and 1986, respectively, and the Ph.D. degree from the University of Toronto, Toronto, ON, Canada, in 1992. He has held several academic positions in Mexico and has worked for the Canadian electric industry. Currently, he is an Associate Professor at Polytechnic Institute of New York University, New York. His research interests include the analysis of power phenomena under nonsinusoidal conditions, the transient and steady-state analyses of power systems, the thermal rating of cables, and the calculation of electromagnetic fields applied to machine design and modeling.
Dariusz Czarkowski (M’97) received the M.Sc. degree in electronics from the University of Mining and Metallurgy, Krakow, Poland, in 1989, the M. Sc. degree in electrical engineering from Wright State University, Dayton, OH, in 1993, and the Ph.D. degree in electrical engineering from the University of Florida, Gainesville, in 1996. In 1996, he joined the Polytechnic Institute of New York University, Brooklyn, where he is currently an Associate Professor of electrical and computer engineering. He is a coauthor of Resonant Power Converters, 2nd ed. (Wiley Interscience, 2011). His research interests are in the areas of power electronics, electric drives, and power quality. Dr. Czarkowski has served as an Associate Editor for the IEEE TRANSACTIONS ON CIRCUITS AND SYSTEMS.
Zivan Zabar (M’76–SM’81) was born in Hadera, Israel, in 1939. He received the B.Sc., M.Sc., and D.Sc. degrees from Technion—Israel Institute of Technology, Haifa, in 1965, 1968, and 1972, respectively. He is Professor of electrical engineering at the Polytechnic Institute of New York University, Brooklyn. He served as the Head of ECE Department at Poly for three years (from 1995 to 1998). He has six patents and more than 50 papers published in technical journals. His areas of interest are electric power systems, electric drives, and power electronics. Dr. Zabar is a Member of Sigma Xi.