(SimEarth) was developed to model earthmoving operations utilizing object-oriented features and discrete event simula- tion. Fuzzy clustering is used to provide ...
Proceedings of the 2001 Winter Simulation Conference B. A. Peters, J. S. Smith, D. J. Medeiros, and M. W. Rohrer, eds.
ON THE USE OF FUZZY CLUSTERING IN CONSTRUCTION SIMULATION Mohamed Marzouk Osama Moselhi Department Building, Civil, and Environmental Engineering Concordia University, 1455 de Maisonneuve W. Montreal, Quebec H3G 1M8, CANADA
This paper presents a methodology that integrates fuzzy clustering estimating and special-purpose computer simulation. It uses: 1) fuzzy subtractive modeling (Chiu, 1994) to provide realistic estimates of haulers’ travel time and 2) simulation system (SimEarth), dedicated for modeling earthmoving operations. A case study involving the construction of a dam is presented to illustrate the capabilities of the proposed methodology.
ABSTRACT This paper presents a methodology that integrates fuzzy clustering and computer simulation and demonstrates its use in modeling earthmoving operations. A simulation system (SimEarth) was developed to model earthmoving operations utilizing object-oriented features and discrete event simulation. Fuzzy clustering is used to provide realistic estimates of haulers’ travel time so as to improve the accuracy of the simulation results. A case study involving the construction of a dam is presented to illustrate the capabilities the proposed simulation engine and the developed fuzzy clustering methodology for estimating haulers’ travel time. 1
2
PROPOSED SYSTEM
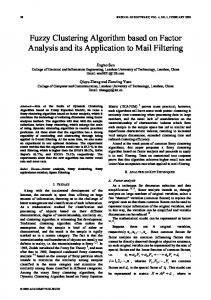
SimEarth is an automated system that has been designed to assist contractors in estimating the time and cost required to accomplish a given scope of earthmoving operations during bid preparation stage. Earthmoving simulation program (EMSP) is considered the main component of SimEarth and represents its simulation engine(Moselhi and Marzouk 2000). EMSP is coded using MS visual C++ 6.0. It has been designed using object oriented features and discrete event simulation. Two databases have been developed to support SimEarth. The first stores equipment characteristics including: 1) equipment models, 2) buckets’ capacities, 3) Haulers’ capacities, etc. And the second stores haulers’ maximum speed across different grades and under different loading conditions. Figure 1 illustrates the components of the proposed system and its data flow.
INTRODUCTION
Simulation has been used in construction to model uncertainties that might exist in construction operations. Simulation can generally be grouped into two main categories: general-purpose simulation (Halpin 1977, Martinez and Ioannou 1999) and special-purpose simulation (Hajjar and AbouRizk 1999). Considerable efforts have been made to improve modeling of construction processes utilizing computer simulation. These include: 1) utilization of objectoriented features (Oloufa 1993, Marzouk and Moselhi 2000), 2) integration of simulation and expert systems (Touran 1990) and 3) integration of simulation and belief networks (McCabe 1998). Modeling techniques for earthmoving operations such as those based on simulation (Hajjar and AbouRizk 1999), queuing theory (Halpin and Woodhead 1976) and regression (Smith 1999), often lack the ability to provide the user with realistic estimates of haulers’ travel time. This in turn influences the accuracy of the productivity estimated using these techniques. Haulers’ travel time can either be approximately estimated using equipment manufacture’s charts (Caterpillar 1997) ignoring acceleration and deceleration zones across the different road segments or simply estimated intuitively based on user’s judgment.
3
EMSP FEATURES
EMSP is a discrete event simulation engine, designed using object-oriented features. Three-phase simulation (Pidd 1995) has been utilized in the design of EMSP to control its dynamic data flow and interaction between entities and resources by tracking the involved activities. EMSP runs in SimEarth environment, which is implemented using MS visual basic 6.0. Different arguments are passed to EMSP’s main function (see Figure 2). These arguments contain information pertaining to: 1) simulation performed either for a test mode or an analysis
1547
Marzouk and Moselhi
SimEarth Environment Input Data Soil Characteristics/ Scope of Work
Haulage Roads’ Characteristics
Haulers’ Allowable Speed
Haulers’ Travel Time
Equipment Characteristics
Fuzzy Clustering Model
EMSP
Output Data Project Duration
Project Cost
Figure 1: SimEarth: Components and Data Flow ture (Quatrani 1998). The following subsections provide an overview of the utilization of those features.
Passed arguments
3.1 Classes
void main(int argc, char *argv[] ) { bool Test_Mode; if (atoi (argv[1]) == 1) Test_Mode = true; First else Test_Mode = false; . argument . }
Classes have been used to capture the properties of entities, resources, and concepts such as activities and operations that combine a number of activities. For example, Haul_Equip, Piled_Earth, and Hauled_Earth are example of classes that represent haulers, earth to pile and earth to haul entities, respectively. Load_Equip and Pile_Equip are examples of classes that represent load and pile equipment resources. On the other hand, OPY_Simulate class represents an earthmoving operation that contains the four main basic activities (Load, haul, dump and return), whereas Activity class (see Figure 3) represent any type of activity whether basic or secondary (pile, spread and compact).
Figure 2: Passing of Arguments to EMSP Main Function mode, 2) condition(s) of termination for the simulation analysis, 3) interaction among equipment in the fleet under consideration, 4) storage of simulation data for later use in animation, 5) the selected set of activities involved in the simulation process and 6) number of simulation runs. Object oriented features have been used in the design of EMSP including classes, inheritance, dynamic data struc-
1548
Marzouk and Moselhi tics (e.g. queue length, queue wait time ... etc.) are gathered from queues at different simulation times. Lists store all activities under execution at specific simulation time. Unlike queues, lists allow for inserting activities at any specified location on the list rather than at the end of the queue. Lists have been used in the proposed methodology, allowing for the insertion of activities based on a defined current activity list (CAL). Activities are sorted in CAL in a chronological order based on their finish time. Simulation time is set equal to the finish time of CAL’s first activity. Updating CAL, between two time points, is preformed in three phases according to three-phase simulation as shown in Figure 5. In Phase_1, CAL’s first activity is removed and the simulation time is advanced to the next time. In Phase_2, all due B activities (bound to happen) are carried out. In Phase_3, all possible C activities (conditional) are performed.
class Activity { public: void Set_Activity_Attributes(double ST, double DUR, int A_ID, int E_ID, int E_MD, int L_ID) { StartTime = ST; Duration = DUR; FinishTime = StartTime + Duration; ActivityID = A_ID; EquipID = E_ID; EquipModel = E_MD; LoaderID = L_ID; } double StartTime; double FinishTime; double Duration; int ActivityID; int EquipID; int EquipModel; int LoaderID; };
4
A fuzzy knowledge-based model has been developed using IF....THEN type rules. The model was carried out in two stages: 1) identification of its significant attributes and 2) development of model utilizing the significant attributes, defined in the first stage. Input and output data spaces are used to form the clusters of the developed model and their respective characteristics. Different cluster algorithms have been reviewed: 1) fuzzy C-Means (FCM) clustering method (Bezdek and Pal, 1992), 2) mountain clustering method (Yager and Filev, 1994) and 3) subtractive clustering method (Chiu 1994). FCM clustering method (Bezdek and Pal, 1992) is an iterative technique that starts with a set of cluster centers and generates membership grades, used to induce new cluster centers. The number of iterations depends on the choice of the initial values of the clusters’ centers. Mountain clustering method (Yager and Filev, 1994) is based on creating a grid of data space and computing the potential value (mountain function) for each point on the grid, based on its distance to the actual data point. The greatest potential point (one of the grid vertices) represents the first cluster (highest point on the mountain). Subsequently, the potential for each grid point is adjusted, allowing for the determination of all remaining clusters. Subtractive clustering method (Chiu 1994) is an extension of the mountain clustering method, where the potential is calculated for the data rather than the grid points. As a result, clusters are elected from the system training data according to their potential. Subtractive clustering has an advantage over mountain clustering in that there is no need for estimating a resolution for the grid. In this study, haulers’ average speed is modeled using subtractive clustering as described in the following subsections.
Figure 3: Code of Activity Class 3.2 Inheritance Inheritance has been used to allow for extending the attributes and methods of an existing class by defining new subclass(es) that has its unique attribute(s) and method(s). For example, OPE_Simulate, OSD_Simulate, and OCT_Simulate are three sub-classes of OPY_Simulate class as shown in Figure 4. They extend the attributes and methods of OPY_Simulate class by adding new methods (Pile_Drive(), Spread_Drive() and Compact_Drive()) and attributes (e.g. P_Prod, S_Prod and C_Prod) to account, respectively, for pile, spread and compact activities. OPY_Simulate
OPE_Simulate
OSD_Simulat
FUZZY CLUSTERING MODEL
OCT_Simulate
Figure 4: Sub-classes of OPY_Simulate Super-class 3.3 Dynamic Data Structure Queues and lists are two different forms of dynamic data structure which store objects and their related data, regardless of their number at a given simulation time. Queues store entities (e.g. haulers) and resources (e.g. load equipment). Statis-
1549
Marzouk and Moselhi
Before Updating
Phase_1 Load
Load
ID = 3
ID = 3
Haul
Haul
ID = 2
ID = 2
Phase_2
Phase_3
After Updating
Haul
Haul
Haul
ID = 2
ID = 2
ID = 2
Out
In
Dum
ID p =4 Dum ID p =4
Dum ID p =4
ST = 4623.4
ST = 4625.2
In
InHaul
ID = 3 ST = 4625.2
InLoad
Load
ID = 5
ID = 5
Dum
Dum
ID p =4
ID p =4
Haul
Haul
ID = 3
ID = 3
ST = 4625.2
ST = 4625.2
Figure 5: CAL Updating According to Three-Phase Simulation for both haul and return trips using the generated data from FPC. Different models have been developed along with their corresponding clusters. Table 1 depicts two clusters associated with a model developed for estimating haulers’ average speed for hauling across middle road segments.
4.1 Identifying Model’s Attributes The most significant factors that influence haulers’ travel time (model’s attributes), have been identified using stepwise regression. These factors are considered as input spaces for haulers’ average speed model. The analysis has been performed utilizing a data set, generated using FPC software (1998). The generated data consider a wide range of parameters and account for the maximum allowable speed in road segments with different characteristics. Stepwise regression analysis was performed for different types of road segments: single; first; last; and middle. Factors that affect haulers’ travel time across middle road segments have been identified to be: 1) previous segment allowable speed, 2) segment length and 3) segment allowable speed. On the other hand, two factors (segment length and segment allowable speed) have been identified for single, first and last road segments.
Table 1: Fuzzy Model for Haulers’ Average Speed (Mid Segment/Haul Trip
5
Cluster Center
Optimized Model (LSE)
(0.1098, 0.4597, 0.1098) (0.1709, 0.5225, 0.7987)
(-0.00197,-0.00015,0.98143)y + 0.49325 (0.07763,0.00286,0.79518)y – 2.51499
CASE STUDY
In order to demonstrate the capabilities of the proposed methodology, an actual case study has been analyzed. The case involves the construction of a dam across SaintMarguerite River, in the province of Quebec, Canada. Three soil materials are used in the construction of the dam: 1) moraine (clay), 2) granular (sand and gravel) and 3) rock. These materials are borrowed from different borrow pits during construction. In view of the cold weather conditions in the region, construction was planned to performed only in the summer season over a 3-year period (from 1996 to 1998) and the project, accordingly, was phased in three stages as shown in Figure 6. The study presented in this paper focuses on estimating the time and cost required to borrow moraine material from the MOR_1 borrow pit, shown in Figure 7, to fill the core of the dam. Tables 2, 3 and 4 summarize the scope of work, soil properties, fleet configurations and travel time distributions associated with the different activities involved (load, haul, dump and return).
4.2 Model Development The most significant factors, identified in the previous section, were used to develop a fuzzy subtractive model. This was carried out into two steps: 1) determining cluster centers and hence the number of fuzzy rules and their associated membership functions and 2) optimizing the model utilizing Takagi and Segano (1985) technique based on least square estimation (LSE). 4.3 Haulers’ Average Speed The algorithm proposed by Chiu (1994), has been applied for the different road segments (single, first, last and middle)
1550
Marzouk and Moselhi 410.0
Compacted Moraine
10 m
350.0
Stage 3
Stage 2 270.0
Stage 1 477 m
Figure 6: Typical Cross-section in the Dam
N
HR_1 Road Segments (from Mor_1 to the dam)
Seg.
Length (m)
RR (%)
Grade (%)
1
360
5
0.6
2
707
5
-5.2
3
435
2
4.7
4
2,175
2
-0.6
5
2,618
2
-0.9
6
1,607
2
3.2
7
1,709
2
2.2
8
1,345
2
-0.7
9
2,236
2
-4.6
10
975
2
2.8
11
1,032
2
4.1
12
1,047
2
-0.8
13
831
2
2.5
14
185
2
0
Dam’s Location
Saint-Marguerite River
Haulage Road (HR_1)
Mor_1
17,262
Figure 7: Project Layout and Haulage Road Profile
1551
Marzouk and Moselhi Table 2: Scope of Work and Soil Properties Scope of work (m3)(Stage 1) : 29,182 Scope of work (m3)(Stage 2) : 555,954 Scope of work (m3)(Stage 3) : 269,864 Bank Density (Kg/ m3) : 2,080 Loose Density (Kg/ m3) : 1,660 Bucket fill factor (%) : 100
Table 4: Activity Time Distributions Hauler Type CAT 773D
Table 3: Fleet Configurations Fleet 1 Loaders (Wheel Type) Type : Number : Bucket Capacity (m3) : No of passes : Hourly Owning and Operating Cost ($/hr) : Haulers (Trucks) Type : Number : Payload (ton) : Hourly Owning and Operating Cost ($/hr) : Fleet 2 Loaders (Wheel Type) Type : Number : Bucket Capacity (m3) : No of passes : Hourly Owning and Operating Cost ($/hr) : Haulers (Trucks) Type : Number : Payload (ton) : Hourly Owning and Operating Cost ($/hr) :
CAT 990 1 8.41 3 243.35
CAT 777D
CAT 773D 5 41.88 160.53
CAT 992D 1 10.7 5 295.74 CAT 777D 4 88.81 212.95
Upon selecting the fleet configurations from SimEarth equipment database, SimEarth provides the user with a screen menu that contains the selected haulers’ average speed calculated using the developed fuzzy subtractive cluster estimating model and the corresponding travel time in a way that eases the user task in choosing the parameters of the selected probability density functions (PDF). For example, for a haul trip time that follows triangle distribution the estimated travel time calculated using the proposed model is used as the most likely value for that distribution. Default values are set for optimistic and pessimistic time making use of the calculated travel time. A reduction of 5% and increase of 10% with respect to the estimated travel time are used for that purpose. Alternatively, the user can enter his/her estimate for optimistic and pessimistic travel time using the input screen shown in Figure 8. Subsequently, SimEarth triggers EMSP to perform simulation for each fleet scenario for the three stages construction. Different reports can be generated in tabular and graphical forms that contains fleet cost and statistics
Activity Type Load
Distribution
Parameters
Uniform
Haul
Triangle
Dump
Uniform
Return
Triangle
LL = 1.9 UL = 2.1 LL = 22.23 ML = 23.34 UL = 25.74 LL = 1.5 UL = 1.8 LL = 16.71 ML = 17.59 UL = 19.35
Load
Uniform
Haul
Triangle
Dump
Uniform
LL = 1.7 UL = 1.9
Return
Triangle
LL = 17.26 ML = 18.17 UL = 19.99
LL = 2.3 UL = 2.6 LL = 23.94 ML = 25.2 UL = 27.72
LL: Lower limit; UL: Upper limit; ML: Most likely All parameters are given in minutes
of queues and activities as shown in Figure 9. Tables 5 and 6 list the estimated time and direct cost for the two fleets used in the three construction stages. The analysis results indicate that fleet 1 performs the task in minimum total duration of 4,068 hrs. and minimum total direct cost of $4,668,192. Table 5: Scheduled Duration for the Different Construction Stages (Hours) Fleet 1 Fleet 2 221 139 Stage 1 4,204 2,645 Stage 2 2,042 1,284 Stage 3 6,467 4,068 Total Table 6: Estimated Direct Cost for the Different Construction Stages Fleet 1 Fleet 2 231,166 159,508 Stage 1 4,397,384 3,035,243 Stage 2 2,135,932 1,473,441 Stage 3 6,764,482 4,668,192 Total It should be noted that using the maximum allowable speed and ignoring the acceleration and deceleration of haulers in transition zones underestimates haulers’ travel time (see Table 7).
1552
Marzouk and Moselhi
Estimated using fuzzy cluster model
Figure 8: Haul Trip Screen Menu Table 7: Haul and Return Time Distributions (Using Maximum Allowable Speed)
The simulation results using the approximation of maximum allowable speed indicate total duration of 6,162 and 3,902 hrs. and estimated direct cost of $6,445,452 and $4,477,699 for Fleet 1 and Fleet 2, respectively. This approximation results in underestimating the project total duration and its direct cost (305 and 166 hrs.; and $319,030 and $190,493 for Fleet 1 and Fleet 2, respectively). 6
Hauler Type CAT 773D
Activity Type
Distribution
Haul
Triangle
Return
Triangle
Haul
Triangle
Return
Triangle
CONCLUSIONS CAT 777D
This paper presented a methodology that integrates fuzzy estimating (based on subtractive clustering) and simulation of earthmoving operations. Fuzzy clustering is used as a tool for generating realistic estimates of haulers’ travel time considering acceleration and deceleration in transition zones between road segments. The simulation is carried out using the estimated travel time and the developed special-purpose
Parameters LL = 22.23 ML = 23.34 UL = 25.74 LL = 16.71 ML = 17.59 UL = 19.35 LL = 23.94 ML = 25.2 UL = 27.72 LL = 17.26 ML = 18.17 UL = 19.99
LL: Lower limit; UL: Upper limit; ML: Most likely All parameters are given in minutes
1553
Marzouk and Moselhi Cost Report Schedule Report
Figure 9: SimEarth Generated Reports Simulation Conference, ed., P.A. Farrington, H.B. Nembhard, D. T. Sturrock, and G. W. Evans, 9981006. Institute of Electrical and Electronics Engineers, Piscataway, New Jersey. Halpin, D.W. 1977. CYCLONE-Method for Modeling Job Site Processes. Journal of Construction Division, 103(3): 489-499. Halpin, D.W., and R.W. Woodhead. 1976. Design of Construction and Process Operations. John Wiley & Sons, Inc., New York, NY. Martinez, J.C., and P.G. Ioannou. 1999. General-Purpose Systems for Effective Construction Simulation. Journal of Construction Engineering and Management, 125(4): 265-276. Marzouk, M., and O. Moselhi. 2000. Optimizing Earthmoving Operations Using Object-Oriented Simulation. In Proceeding of the 2000 Winter Simulation Conference, ed., J.A. Joines, R.R. Barton, K. Kang and P.A. Fishwick, 1926-1932. Institute of Electrical and Electronics Engineers, Piscataway, New Jersey.
simulation engine (EMSP). EMSP was designed using object-oriented features including: classes; inheritance; and dynamic data structure. A case study of construction of a dam was presented to illustrate the capabilities of the proposed methodology. REFERENCES Bezdek, J.C, and S.K. Pal. 1992. Fuzzy Models for Pattern Recognition. IEEE Publication, New York, NY. Caterpillar Performance Handbook. 1997. Edition 28, Caterpiller Inc., Peoria, Illinois. Chiu, S.L. 1994. Fuzzy Model Identification Based on Cluster Estimation. Journal of Intelligent and Fuzzy Systems, 2: 267-278. FPC Users’ Manual. 1998. Caterpiller Inc., Peoria, IL. Hajjar, D., and S. AbouRizk. 1999. SIMPHONY: An Environment for Building Special Purpose Construction Simulation Tools. In Proceeding of the 1999 Winter
1554
Marzouk and Moselhi a number of professional associations. He authored and coauthored over 100 scientific publications. His research interests include IT applications in construction, impact of change orders and weather on construction productivity, and risk management. His e-mail is .
McCabe, B. 1998. Belief Networks in Construction Simulation. In Proceeding of the 1998 Winter Simulation Conference, ed., D.J. Medeiros, E.F. Watson, J. S. Carson, and M.S. Manivannan, 1279-1286. Institute of Electrical and Electronics Engineers, Piscataway, New Jersey. Moselhi, O., and M. Marzouk. 2000. Automated System for Cost Estimating of Earthmoving Operations. In Proceeding of 17th International Symposium on Automation and Robotics in Construction, Taipai, Taiwan: 1053-1058. Oloufa, A. 1993. Modeling Operational Activities in Object-Oriented Simulation. Journal of Computing in Civil Engineering, 7(1): 94-106. Pidd, M. 1995. Object orientation, discrete simulation and three-phase approach. Journal of Operation Research Society, 46 (3): 362-374. Quatrani, T. 1998. Visual Modeling with Rational Rose and UML. Addison-Wesley, Reading, Mass. Smith, S.D. 1999. Earthmoving Productivity Estimation Using Linear Regression Tech. Journal of Construction Engineering and Management, 121(4): 388-396. Takagi, T. and M. Sugeno. 1985. Fuzzy Identification of Systems and its Application to Modeling and Control. IEEE Trans. On Systems, Man & Cyberneticst, 15(1): 116-132. Touran, A. 1990. Integration of Simulation with Expert Systems. Journal of Construction Engineering and Management, 116(3): 480-493. Yager, R.R., and D.P. Filev. 1994. Approximate Clustering Via the Mountain Method. IEEE Trans. On Systems, Man & Cyberneticst, 24(8): 1279-1284. AUTHOR BIOGRAPHIES MOHAMED MARZOUK is a Ph.D. Candidate in Department of Building, Civil, and Environmental Engineering at Concordia University. He received his B.Sc. and M.Sc. in Civil Engineering from Cairo University in 1995 and 1997, respectively. His research interests include simulation of construction operations, O-O simulation, fuzzy logic and its applications in construction, and decision analysis including multi-attribute utility theory and analytical hierarchy process. His e-mail is . OSAMA MOSELHI Dr. Moselhi is Professor and Chair of the Department of Building, Civil and Environmental Engineering at Concordia University. He held several industrial and academic posts in Canada and abroad, in a wide spectrum of the engineering profession, ranging from structural analysis and design to construction engineering and management, on building and heavy civil engineering projects including bridges, offshore and harbor facilities, and nuclear power plants. He is a professional engineer, a Fellow of ASCE and CSCE, and a member and director of
1555