Proceedings of the 11th European Wave and Tidal Energy Conference 6-11th Sept 2015, Nantes, France
On the use of turbulence models for simulating the flow behind a tidal turbine represented by a porous media Van Thinh Nguyen#1, Sylvain S. Guillou#2, Jérôme Thiébot#3, Alina Santa Cruz#4 # Normandy University, UNICAEN, LUSAC, EA 4253, 60 rue Max Pol Fouchet, CS 20082, 50130 Cherbourg-Octeville, France.
[email protected] [email protected] [email protected] [email protected]
Abstract— The Actuator Disk (AD) coupled with Computational Fluid Dynamics (CFD) is one of the most popular method for modelling the wake of tidal turbines. In this paper, we compare several turbulence models to simulate the wake behind a turbine represented by a porous disk. We use the Standard and Realizable k-ε models, the SST k-ω model and the Reynolds Stress Model (RSM). After solving the problem with the 4 turbulence models, we assess their respective performance. Significant discrepancies are obtained between the models’ results especially in the near wake. The Standard k-ε model gives the best fit with experimental results because it predicts a high production of turbulent kinetic energy in the area of the disk. Keywords— Renewable energy, Tidal Energy Converter, Actuator Disk, Computational Fluid Dynamics, Turbulence Modelling
guarantee the best results [13, 14], several models must often be compared to choose the best one for a given application. For the present purpose, we assess the performance of several turbulence models in the context of modelling a tidal turbine with a RANS – Actuator Disk approach. The selected turbulence models are the Standard k-ε, the Realizable k-ε, the Shear-Stress Transport (SST) k-ω model and the Reynolds Stress Model (RSM). This benchmark is based on the experimental results of [10] which consist in measuring the current velocities and the turbulent intensities downstream a porous disk placed in a current flume. The section II is dedicated to the description of the method and the mathematical background. The case study is presented in section III. Results are analyzed in the section IV.
I. INTRODUCTION II. METHOD The turbulence intensities are generally high at the sites suitable for tidal power exploitation [1, 2, 3]. Mean turbulent intensity values between 6 to 30 % have been measured with maximum values reaching 50%. This high level of turbulence directly affects the wakes of the turbines, especially the flowrecovery [4, 5]. Modelling turbulence accurately is crucial for tidal turbine applications. The combination of Reynolds Averaged Navier Stokes equations (RANS) with Actuator Disk theory (AD) constitutes an approach for modelling the flow within a tidal farm [6-12]. This method is popular as it gives accurate results at reasonable calculation costs. Several models exist for modelling turbulence in the context of a RANS approach. The choice of the turbulence model strongly determines the result accuracy. It is therefore important to choose the model that best suits the type of flow. The choice is based on the characteristics of the flow: presence of a boundary layer, complexity of the flow field, presence of adverse pressure gradients... As using the model with the highest level of complexity (the Reynolds Stress Model for instance) does not
ISSN 2309-1983
A. Actuator Disk Theory In the Actuator Disk theory, the rotor of the turbine is represented by a disk where the thrust Ft is homogeneously distributed. The application of this force results in a discontinuity in pressure, a reduction of the kinetic energy of the flow [15] and a decrease in the flow velocity downstream the rotor. This force is calculated with Eq. (1) where P is the difference in pressure between both sides of the disk, S is the disk area, U ∞ is the upstream flow velocity, is the fluid density and Ct is the thrust coefficient [16, 17]. Ft S P
1 2
2 Ct SU
(1)
The Actuator Disk has limitations as regards the modelling of a tidal turbine [10]. The main simplification is that the blade motion is not included which implies that swirl effects and tip vortices shed by the blades are omitted. Those effects are known to be noticeable in the near wake. However, they rapidly dissipate and becomes insignificant for distance
Copyright © European Wave and Tidal Energy Conference 2015
07B2-1-1
behind the turbine greater than 5D [16]. In fact it increase the local mixing right downstream the turbine. B. Basis Equations Using a RANS approach, the force induced by the disk on the fluid is introduced as a source term Si in the Navier-Stokes Equations (Eq. 2):
U iU j x j
U i xi
p xi
U i
U j Rij gi Si (2) x j x j xi
0
1) Standard k-ε model This model [20] is composed of one transport equation for the turbulent kinetic energy k (Eq. 7) and one equation for the dissipation rate ε (Eq. 8). The eddy viscosity µ t is obtained from the turbulence kinetic energy k and its dissipation rate ε (Eq. 9). The term calculated by Eq. (10) is the production of turbulent kinetic energy. The standard values of the constants are: Cε1=1.44, Cε2=1.92, Cµ =0.09, σk =1.0 and σε =1.3. ( k )
(3)
where Ui are the components of the mean velocity averaged over the time, µ is the water dynamic viscosity, μ t is the turbulent dynamic viscosity and gi are the components of the gravitational acceleration, Rij is the Reynolds stress tensor. In practice, the thrust is introduced in the momentum equation as a source term Si calculated with Eq. (4), where K is a resistance coefficient, e is the thickness of the disk and Ud is the velocity at the disk location [10]. The resistance coefficient could be deduced from the measurement of the force exerted on the disk. It could also be calculated with Eq. (5). F 1 K 2 (4) Si t U d 2 e Se The relationship between the resistance and the thrust coefficient is Eq. (5) [19]. K Ct (5) 2 1 0.25K C. Turbulence modelling As regards the turbulence, we opt to test 4 different models: the Standard k-ε model, the Realizable k-ε model, the SST k-ω model and the RSM. The Standard k-ε model is known to be suitable for fully developed flow when the zone of interest is far from the boundaries. The Realizable k-ε model derives from the Standard k-ε model. It is more adequate for separated flows with complex secondary flow. The SST k-ω model is relevant for resolving the flow near the boundaries. Finally, the RSM model is dedicated to the strongly complex flows. Except for the RSM, the Boussinesq assumption is used in
t ( ) t
( kU i ) x j
( U i ) x j
t C
k
x j
k t k x j
t x j
(7)
2 C 1 C 2 k k x j
(8)
2
(9)
1 t ' ' U j ui u j 2 xi
U i x j
U j xi
2
(10)
2) Realizable k-ε model The Realizable k-ε model [21] is an evolution of the k-ε model. The transport for the dissipation rate ε is modelled by Eq. (11). A new formulation of the production and dissipation terms are introduced to obtain the realizable model. The function C1 is a limit based on the rate of strain S, k and ε. With the Realizable k-ε model, Cµ is no longer constant. It depends on both the mean strain rates and the turbulence fields (k and ε). As regards the calculation of Cµ , the standard value of 0.09 is used for an inertial sublayer in an equilibrium boundary layer. The standard values of the constants are: C2=1.9, σk =1.0 and σε =1.2, A0=4.04. ( ) t
C1
( U i ) x j
max 0,43,
2 t C1S C2 x j x j k k 1 S ;C ; 5 kU f
A0 As
As
6 cos
;
1 2
Sij S jk Ski
6W ; W
S3
Ui xj
(12)
Uj
; S
Sij Sij
(13) (14)
Eq. (6) to link the Reynolds stresses ( ui u j ) to the mean
Uf
motion, the kinetic turbulence energy and the eddy viscosity µ t. Eq. (6) implies considering an isotropy assumption. For the RSM, each Rij is calculated by a transport equation. It avoids the use of the isotropy assumption.
3) Shear-Stress Transport (SST) k-ω model Developed by [22], the SST k-ω model intends to benefit from the advantage of the k-ω model in the near wall regions (more accurate in formulating the near wall region) and of the advantage of the k-ε model in regions far from the wall (freestream independence in the fair field). The transport equation
' '
U U j 2 ui' u 'j t i k ij x j xi 3
(6)
Sij Sij
;
1 cos 1 3
(11)
ij ij
ij
xi
for k and ω are shown in Eqs. (15) and (16). The term is the
07B2-1-2
rated production of the turbulent kinetic energy calculated from the standard production using Eq. (17). The function value F1 is 1 for the near wall region and 0 for the far wall region. The Eq. (18) shows the dependency to y (the distance to the nearest wall) and D which is calculated with Eq. (19). The eddy viscosity µ t is given by Eq. (20). The dissipation is rated using the function F2 (Eq. 21) in the boundary layer regions. k ( k ) ( kU i ) (15) t *k t x j x j k x j ( ) t
( U i ) x j
t t x j x j
U j ui' uk' ' ' uiuk ik ik x j x j x j ' ' t uiuk x j j x j ik
t
(16)
C2
ik
xj
ik
* k )
,10
(17)
ik
u 'j uk'
Ui xj
uk' xj
ui' xj
2
4 F1
D
tanh min max
max 2
k , 500 0.09 y y 2
1 ,2
a1k
1
,
4 k 2 ,2 D y
k ,10 10 xj xj
2
(18)
ij
(19)
kk
U j ui' uk'
k
1
,2 x j x j
2 k 3 ik 2 ik 3 ik
C1 u'u' k i k
ik
2 2(1 F1 )
min(
ui' uk'
3
ij
; ui' u 'j
1 2 kk Uk xj
(22)
(23)
(24) (25) (26) (27)
The standard constants are: C1=1.8, C2=0.6, Cµ =0.09, κ=0.4.
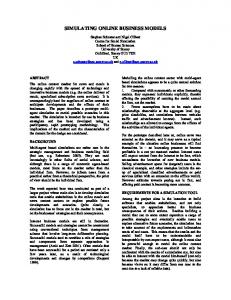
III. EXPERIMENTAL SET-UP AND NUMERICAL PARAMETERS We simulate the flow behind a porous disk of diameter max a1 ,SF2 D=0.1m placed in a 5mx1.36mx0.3m circulating water 2 channel corresponding to the experiments of [10, 16] (Fig. 1). k , 500 F2 tanh max 2 (21) The case corresponding to the Betz limit (i.e. Cp=0.59; Ct = 0.09 y y 2 0.89) is chosen for the present purpose. It corresponds to a resistance coefficient value K = 2. This value will be used as a The standard constants for this model are: β*=0.09, β=0.072, reference value in the following numerical simulations. a1=0.31, σk,1=1, α=0.52. Similarly to [10], the other constants The Navier Stokes Equations are resolved with FLUENTTM values are set to: σw,1=0.5, σk,1=0.85, σw,2=0.856. 14.5. Symmetry conditions are imposed on the lateral and top boundaries. The pressure is imposed at the outlet, whereas the 4) Reynolds Stress Model (RSM) In the Reynolds stresses model [23] each component of the profiles of velocity UI (z) and the turbulent kinetic energy k inlet (Fig. 2, Eq. 28). The friction velocity tensor is calculated by a transport equation (Eq. 22). The are imposed at the -1 is U*=0.00787 m.s , z is the distance from the bottom to the redistribution tensor (or pressure-deformation term) ( ik ) in free surface, is the kinematic viscosity, A=0.197 m.s-1, U is the Eq. (22) is modelled by Eq. (23) where the term ik is the mean inlet velocity, I is the turbulence intensity, l=0.07H calculated by the relation (24). The turbulent kinetic energy is is the characteristic length (with H=0.3m) and Cμ=0.09. This -1 deduced from the Reynolds stress tensor. The production corresponds to a bulk inlet velocity of 0.3 m.s and a mean tensor is expressed as a function of the mean motion and the inlet turbulent intensity of 5%. The domain is covered with a Reynolds stress tensor with Eq. (25) whereas the dissipation hexahedral mesh containing 16,867,840 elements with a tensor given by Eq. (26) must be modelled. The isotropy of refinement in the disk area where the cell size equals the disk the dissipation is generally assumed which reduces the thickness. A special attention was paid to the mesh size in the dissipation tensor to its diagonal (Eq. 27). Hence the alignment of the disk. According to [7], the results are dissipation rate (ε) can be calculated by the transport equation independent of the mesh size as far the mesh size in the y and (Eq. 8), in which the production term is calculated directly y direction are such that ∆y ≤ D/9 and ∆z ≤ D/6. In the present simulations, we opt for a much smaller mesh size as from the second-order correlation (Eq. 10). ∆y=D/100 and ∆z=D/100. The residual convergence criteria for velocity and turbulence are 10-7.
t
(20)
07B2-1-3
* * zU U I z 2, 5U ln A
3/2 3 2 2 3/4 k k I U ; C 2 l
(28)
Fig. 1 Computational domain with the localization of the turbine
obtained with the Standard k-ε, the SST k-ω and the RSM models. However, the Realizable k-ε model underestimates the flow-recovery. A similar conclusion can be drawn when looking at the vertical profile (Fig. 5). As regards the turbulent intensities, all models fit well the measurements in the far wake. Model results are similar for x>7D (Fig. 4b, Fig. 5b2, 5c2). Despite his poor accuracy in terms of velocity in the vicinity of the disk, the Realizable k-ε model provides a rather good estimation the turbulent intensity in this area. For x5D. As regards the Realizable k-ε results, they are satisfactory only for distance from the disk greater than 9D. In the near wake (x=4D, Z=1.5D) (Fig. 5a), the model performance regarding the turbulent intensity strongly vary form a model to another (Table 1). While this error is 14% for the Standard k-ε model, the errors obtained with the other models are up to 4 times greater. The lowest performance in velocity is obtained with the RSM model. Table 1. Relative error at x=4D and z=1.5D from the disk on the axis: error on the velocity Eu=(U-Uexp)/Uexp, error on the turbulence EI=(I-Iexp)/Iexp.
Fig. 2 Vertical profiles of axial velocity (left) and turbulent intensity at the inlet (right). Comparison between numerical results (Num) and experimental (Exp) of [10].
IV. RESULTS The performance of the different models is assessed comparing the model results to the experimental data of [10]. We focus on the flow recovery (Fig. 3) and the spatial distribution of both the current velocity and the turbulence intensity. Obviously, the near wake is characterized by a higher level of turbulent kinetic energy than the far wake.
Fig. 3 Isocontour of Turbulent Kinetic Energy field (top) and velocity deficit (U∞-U) in m/s (bottom) in x-y plane for the Standard k- model of turbulence.
Models
k-ε
Eu (%)
19
Realizable k-ε 17
EI (%)
14
38
SST k-ω
RSM
18
28
48
27
The model performance assessment indicates that the best agreement with experimental data is obtained with the simplest turbulence model (the Standard k-ε). Not only the Standard k-ε model shows a rather good agreement with experimental data, but it is also the most accurate model in the near wake. We therefore foresee that modelling accurately the processes in this zone is crucial. As shown in Fig. 6a and 7c, the turbulent kinetic energy calculated with the Standard k-ε at x=3D strongly differ from the turbulent kinetic energy calculated with the 3 other models. It is 3 or 4 times greater. It is admitted that the higher is the level of turbulence, the stronger is the mixing and the faster is the flow-recovery [5]. We therefore hypothesize that the differences between the Standard k-ε model results and the other models results can be imputed to the strong kinematic energy production of the Standard k-ε model. To investigate this, we plot the production and the dissipation term as well as the turbulent viscosity (Fig. 6-8).
The current velocities and the turbulent intensities are compared to the results [10] focusing either on the longitudinal axis (Fig. 4) or on vertical profiles (Fig. 5). For distance behind the disk greater than 15D, there is a good agreement between the measurements and the results
07B2-1-4
Fig. 4 Velocity (top) and turbulence intensity (bottom) along the disk axis (x=0 is the disk position). Comparison between experimental (Exp [10]) and numerical results with several turbulence models.
Fig. 6 Focus on some turbulence characteristics along the turbine axis (x=0 is the disk position) with several turbulence models: Kinetic energy [m2/s2] (a), dissipation of kinetic energy [m2/s3] (b), turbulent dynamic viscosity [kg/m.s] (c) and production of the kinetic energy [kg/m.s3] (d). Fig. 5 Vertical profiles of axial normalized velocity (top) and turbulence intensity (bottom) at 4D, 7D and 15D downstream of the disk. Comparison between experimental (Exp [10]) and numerical results with several turbulence models.
07B2-1-5
Fig. 7 Isocontour of Turbulent Kinetic Energy field [m2/s2] in x-z plane for the four turbulence models: RSM (a), SST k-ω (b), Standard k-ε (c) and Realizable k-ε (d).
Fig. 8 Isocontours of the production of turbulent kinetic energy field [kg/m.s3] in x-z plane for four turbulence models: RSM (a), SST k-ω (b), Standard k-ε (c) and Realizable k-ε (d).
07B2-1-6
The Fig. 7 shows significant differences between the k-ε model results and the others as regards the distribution of the turbulent kinetic energy. For the k-ε model, the zones with greatest energy connect rapidly behind the disk (at x=1D) whereas for the other models, they are located downstream the disk boundaries. The Fig. 8 represents the areas where the turbulent kinetic energy is produced. Whatever the model, those areas are located downstream the disk where the shear is strong. The production calculated by the k-ε model distinguishes itself by its strong intensity in the immediate vicinity of the disk. It should favor the turbulence intensity (Fig. 8) and the mixing and reduce the distance from the disk where the wakes generated at the disk boundary connect. However, it does not explain the high level of turbulence in the near wake (x