Universität Würzburg Institut für Informatik Research Report Series
On the Validity of Approximation Formulae for Machine Downtimes O. Rose*, M. Dümmler* and A. Schömig** RR
Report Nr.: 250
Februar 2000
* Lehrstuhl für Informatik III, Universität Würzburg Am Hubland, 97074 Würzburg E-Mail:
[email protected] ** Infineon Technologies AG Operational Excellence Postfach 10 09 44, 93009 Regensburg E-Mail:
[email protected]
On the Validity of Approximation Formulae for Machine Downtimes Oliver Rose, Mathias Dümmler Lehrstuhl für Informatik III, Universität Würzburg, Am Hubland, 97074 Würzburg E-Mail:
[email protected] Alexander Schömig Infineon Technologies AG, Operational Excellence, Postfach 10 09 44, 93009 Regensburg E-Mail:
[email protected] Abstract In this paper we investigate how simplifying assumptions in the stochastic modeling of machine downtimes affect the output performance measures. Typically, literature in this area either addresses the estimation of statistical input modeling as such or investigates how sensitive output performance measures of queueing or simulation models are to the choice of stochastic properties of the input distributions. Practitioners, however, often prefer to use simplified formulae for a rough-cut analysis. The results presented clearly show, that unjustified simplification might lead to erroneous results. The immediate conclusion out of the results is that sampling shop-floor data should not only include first order statistics, but also measures that allow to monitor and model the variability of the machinery.
1 Background and Motivation Semiconductor manufacturing is among the most complex manufacturing processes. Several performance measures are commonly used to describe and assess a semiconductor manufacturing facility. To highlight the most important of those we mention machine utilization, production yield, throughput, and last but not least cycle time. Cycle time is defined in this context as the time a lot of wafers needs to travel through the semiconductor wafer manufacturing process. In this study we do not consider wafer probe, packaging/assembly, and final test. Crucial factors of competitiveness in semiconductor manufacturing are the ability to rapidly incorporate advanced technologies in electronic products, ongoing improvement of manufacturing processes, and last but not least the capability of meeting due dates for an optimal customer satisfaction. In a situation where prices as well as the state of technology have settled at a certain level, the capability of meeting due dates along with the reduction of cycle time probably has become the most decisive factor to stand the fierce competition in the global market place. Consequently, operations managers are under an increasing pressure to ensure short and predictable cycle times. In 1997 Infineon Technologies (then: Siemens AG’s semiconductor division) started the Productivity Offensive. This project aimed at improving the capital efficiency of three 6-inch fabs by focussing on production logistics and shop floor control. Endeavors requiring no or very little capital expenditure were undertaken to enhance production planning and control, in particular the reduction of cycle times to improve market response and on-time delivery. The Operating Curve Methodology (see Aurand and Miller (1997) and the references therein), also called Characteristic Curve as defined during the MIMAC project (cf. Fowler and Robinson (1995)), was introduced as the standard factory productivity measurement tool and a key performance indicator. 2
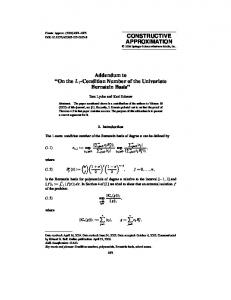
Mean Cycle Time / Raw Processing Time
10 9 8
Current
7 6
Improved
5 4 3 2 1 0
Capacity
3%
Figure 1: Examples of Operating Curves
As Figure 1 illustrates, the operating curve utilizes two metrics to benchmark and to predict the performance of a manufacturing line: Mean cycle time and throughput. Note, that an operating curve can be applied on different levels of aggregation: From the entire fab down to a mere single tool. It illustrates the performance of the system under investigation for the time period during which data was sampled („current“) and predicts cycle time when the system load (average amount of work released into the system), system capacity or system variability due to improvements is changed („improved“). It is a general observation, that for each curve, the average cycle time is close to the raw processing time when the start rate is low (to the left of the chart). The functional interdependence between cycle time and throughput is approximated by the Pollaczek-Khintchine formula (cf. Kleinrock (1975) p. 167ff.). Part of the Productivity Offensive was the formation of crossfunctional work teams. Each team is burdened with the responsibility to maximize the efficiency of a certain manufacturing area. This includes problem localization, definition and execution of action plans, as well as long term problem monitoring and solving. Most team members already had a good intuitive understanding of fundamental laws of production logistics like Little's Law or the nonlinear nature of the operating curve, but lacked a sense for the corrupting influence of variability (cf. Hopp and Spearman (1996) p. 282ff.) as a main performance detractor. We want to underline that the emphasis in this context is on the term variability. Traditionally, the availability and its effect on the manufacturing capacity of a tool or machine along with the process speed have been regarded as the only parameters that determine its dynamic performance (cf. Atherton and Atherton (1995), p. 210ff.). Several simulation studies (cf. Mittler and Schoemig (1999), Schoemig (1999)), however, have shown the impact of variability caused by machine downtimes and the inability of dispatching rules to provide a sufficient remedy on a fab level. Hence, all teams were trained in advanced statistics, applying the operating curve methodology, and last but not least using special production data retrieval and visualizing software to analyze and understand the sources of variability within a manufacturing system. Figure 2 shows a screen shot of one of the first versions of a graphic user front-end that visualizes RTC data sampled and stored by the WorkstreamTM manufacturing execution system. This data is also being used to parameterize dynamic system models such as queueing or simulation models.
3
Figure 2: Graphical User Interface for Retrieving Machine Data
2 Literature Review and Problem Statement A typical semiconductor chip manufacturing facility contains hundreds of various machines and tools. There are several factors that make production planning and control in a semiconductor chip manufacturing facility particularly difficult. Uzsoy et. al. (1992) summarize these factors thoroughly. Uzsoy et. al. (1994) describe the characteristics of various approaches to the shop-floor control problem in semiconductor manufacturing. Unpredictable machine downtimes are believed to be the main source of uncertainty in the semiconductor manufacturing process. Hence, carrying out scheduled maintenance as well as taking care of random machine breakdowns play a crucial role in semiconductor manufacturing. Despite of all efforts to tune and calibrate machines to an optimum performance, they are still subject to random failures. Obviously, downtimes are a severe problem, because the flow of material is disrupted and production capacity is lost. It is desirable to have simple, yet robust formulae for the approximation of performance measures, since those might face a higher level of acceptance in daily use for practitioners who have less educational background in stochastic modeling. Simplified closed form solutions also have benefits for the implementation in a data warehouse system. Typically, literature in this area either deals with the estimation of statistical input modeling (e.g. Leemis (1997)) as such, or investigates how sensitive output performance measures of queueing or simulation models are to the choice of stochastic properties of input distributions (see Gross and Juttijudata (1997) for an overview and further discussion). 4
Research in the mathematics of service systems with interrupted service dates back almost 40 years (Gaver (1962)). Recent literature on queuing models, e.g., Takagi (1991) or Gihr et. al. (1993), presents numerous examples and formulae on the mathematical treatment of these systems. However, almost all of these formulae are cumbersome to use or even numerical intractable. Hopp and Spearman (1996, p. 266ff) provide a simple approximation for the additional variability introduced into a queuing system by server breakdowns:
c 2e = c 20 +
2(1-A)Amr , t0
where A is the availability of the tool, mr the mean time to repair, and t0 and c0 2 the mean and the squared coefficient of variation of the raw processing time. The research to be presented is driven by the concern that these formulae might be useful for illustrative examples and educational purposes, but lack accuracy for actual use. In this research we investigate how simplifying assumptions in the stochastic modeling process affect the output performance measures.
3 Course of Research 3.1
Simulation Model and Parameters
In this study we analyze a workcenter consisting of five identical machines. Lots arriving at the workcenter are assigned to a machine on a FCFS basis. If all machines are busy, lots arriving will have to wait in a queue of infinite size that is shared by all machines. The time between successive arrivals at the workcenter is exponentially distributed with mean interarrival time MIT. The processing time per lot (process speed, PSP) at each of the five machines is assumed to be constant. We observe the flow factor of a lot, i.e., the fraction of actual cycle time and mean service time, where the service time does not include server breakdown periods. Each machine is subject to downtimes. The downtimes occur independently at the individual machines. They are assumed to be preemptive, i.e., if a downtime occurs the machine goes off line immediately, regardless of whether a lot is currently being processed or not. After the downtime the machine continues processing immediately. The mean length of the downtimes of a machine (mean time off line, MTOL) and the mean time between two successive downtimes (mean time to fail, MTTF) can be used to compute the availability A of a machine as follows:
A=
MTTF . MTTF+MTOL
The time between two successive downtimes (TTF) is assumed to be exponentially distributed (with mean MTTF).The distribution of the time off line (TOL) is chosen from the set of distributions displayed in Table 1. Distribution CV Exponential 1 LogNormal 1.4, 1.6, 1.8 Weibull 1.4, 1.6, 1.8
Distribution Measured 1 Measured 2 Measured 3
Table 1: TOL Distributions
5
CV 0.68 1.33 2.77
For each distribution the coefficients of variation (CV) that were used in the simulation experiments are given. The coefficient of variation of a random variable X is
cX =
VAR[X] , E[X]
where VAR[X] is the variance of the random variable and E[X] is its expectation. The measured distributions have been derived from real fab data using the software tool presented in Figure 2. Histograms of these distributions are displayed in Figures 3-5. 0.09 0.08
0.3 0.25
0.07 0.06 0.05
0.2 0.15
0.04 0.03 0.02
0.1 0.05
0.01 0
0
Figure 3: Distribution “Measured 1“
Figure 4: Distribution “Measured 2”
0.4 0.35 0.3 0.25 0.2 0.15 0.1 0.05 0
Figure 5: Distribution “Measured 3”
The utilization U of a single machine in a workcenter consisting of identical machines can be computed as
U=
1 1 PSP , A M MIT
where M is the total number of machines in the workcenter. The model parameters that have been used in the experiments are summarized in Table 2. Number of machines PSP Availability MTOL
5 1 70%, 80%, 90%, 95% 1, 5, 10, 50
Table 2: Parameters for the Experiments
The simulation model was built and the experiments were conducted using the ARENA simulation tool. Each experiment consisted of five independent replications. Each replication was run for a simulated time period of 600,000 time units. In any run, statistical data was sampled only after a warm up period of 100,000 time units.
6
3.2
Results
Hopp and Spearman (1996, p. 277) provide the following formula for the approximation of the flow factor in a workstation consisting of M identical machines:
c 2 +c 2 FF = a e 2
U 2M+2-1 , M(1-U)
where ca 2 is the squared coefficient of variation of the arrival process. Since we assume exponentially distributed interarrival times in our study, ca 2 = 1. In a first experiment, we intended to test the approximation quality of this formula for the flow factors for exponential TOL. This type of distribution was assumed by Hopp and Spearman for the derivation of the formula. In Table 3, we show the simulated flow factors and the relative deviations of the approximation values (in italics) for a wide range of availability and MTOL values and utilization of 95%. In all cases but one the approximation value is lower than the simulation reference. Only for high availability and large MTOL values, the approximated value is of appropriate accuracy. Availability 0.70 0.80 0.90 0.95
1 5.1 -0.31 4.2 -0.21 3.4 -0.10 3.1 -0.06
MTOL 5 10 9.1 14.8 -0.29 -0.31 7.0 10.2 -0.20 -0.18 4.8 6.7 -0.10 -0.12 3.8 4.5 -0.05 -0.02
50 55.2 -0.28 33.7 -0.08 20.0 -0.07 11.1 0.01
Table 3: Simulated flow factors and approximation deviations for exponential TOL
In a second experiment, we consider the influence of the CV of the TOL on the quality of the approximated results. Table 4 displays the simulated flow factor values and the deviations of the approximation values for an utilization of 95%. The relative approximation error clearly depends on the CV of the TOL. We observe deviation of up to 70% for measured TOL histogram 3, i.e., the approximated value is less than a third of the simulated one. The results, however, depend not only on the second moments but also on higher moments of the TOL distribution as can be concluded from the differences between LogNormal and Weibull simulation values for equal CVs. Distribution Measured 1 Measured 2 Measured 3 Exponential LogNormal LogNormal LogNormal Weibull Weibull Weibull
CV 0.68 1.33 2.77 1.00 1.40 1.60 1.80 1.40 1.60 1.80
simulated FF 6.1 8.1 18.5 7.0 8.2 9.8 10.5 8.8 9.9 11.0
deviation -0.09 -0.31 -0.70 -0.20 -0.32 -0.43 -0.47 -0.36 -0.44 -0.49
Table 4: Simulated flow factors and approximation deviations for exponential TOL
7
In summary, the quality of the approximation formula depends on the availability, the MTOL, and the CV of the TOL. There is also a clear indication that the shape of the TOL distribution is also of importance. The availability and the MTOL are contained in the approximation formula but not in the appropriate functional relationship. The CV of the TOL is not even considered in the formula.
4 Summary and Conclusion The aim of this paper was examining the validity of simple queuing approximation formulae for machine downtimes. Typically, literature in this area either addresses the estimation of statistical input modeling as such or investigates how sensitive output performance measures of queueing or simulation models are to the choice of stochastic properties of the input distributions. Practitioners, however, often prefer to use simplified formulae for a rough-cut analysis. Our results have shown that over-simplification might lead to erroneous results, which are of no use for deriving conclusions for daily business. Nevertheless we conclude that sampling shop-floor data should not only include first order statistics, but also measures that allow to monitor and model the variability of the machinery to properly fit parameters of more advanced models. Further research in this area should be directed towards the applicability of formulae and considerations about their robustness concerning data quality.
References Atherton, L., and R. Atherton. 1995. Wafer Fabrication: Factory Performance and Analysis. Boston: Kluwer. Aurand, S., and P. Miller. 1997. The Operating Curve: A Method to Measure and Benchmark Manufacturing Line Productivity. IEEE/SEMI Advanced Semiconductor Manufacturing Conference, 391-397. Fowler, J.W., and J.K. Robinson. 1995. Measurement and Improvement of Manufacturing Capacity (MIMAC) Project Final Report. SEMATECH Technology Transfer #95062861A-TR. Austin, TX. Also published as: Manufacturing Science and Technology for IC Production, JESSI T30C / ESPRIT 8003, Theme 3.3, MST3-AI300-R-NI04-1. Fowler, J.W., S. Brown, H. Gold, and A. Schoemig. 1997. Measurable Improvements in CycleTime-Constrained Capacity. Proceedings of the Sixth International Symposium on Semiconductor Manufacturing (ISSM), San Francisco, U.S.A. Gaver, D. P. 1962. A Waiting Line With Interrupted Service, Including Priorities. Journal of the Royal Statistical Society, Vol. 4, pp. 73-90, 1962 Gihr, O., H. Gold, and S. Heilmann. 1993. Analysis of Machine Breakdown Models. Technical Report: Universität Würzburg, Institut für Informatik, Research Report Series No. 54, January 1993 Gross, D., and M. Juttijudata. 1997. Sensitivity of Output Performance Measures to Input Distributions in Queueing Simulation Modeling. Proceedings of the 1997 Winter Simulation Conference, Atlanta, GA: 296-302. Hopp, W. J., and M. L. Spearman, 1996. Factory Physics. Foundations of Manufacturing Management. Chicago: Irwin. Kleinrock, L. 1975. Queueing Systems, Vol. 1: Theory. New York: Wiley. Leemis, L. 1997. Seven Habits of Highly Successful Input Modelers. Proceedings of the 1997 Winter Simulation Conference, Atlanta, GA: 39-47.
8
Mittler, M., and A. Schoemig. 1999. Comparison of Dispatching Rules for Reducing the Mean and Variability of Cycle Times in Semiconductor Manufacturing. In: Proceedings of the Symposium on Operations Research 1999 (SOR ’99). Magdeburg, Germany. Schoemig, A. 1999. On the Corrupting Influence of Variability in Semiconductor Manufacturing. Proceedings of the Winter Simulation Conference 1999, Phoenix, AZ, U.S.A., pp. 837-842. Takagi, H. 1991. Queueing Analysis, Volume 1: Vacation and Priority Systems. Amsterdam 1991. Uzsoy, R., C. Lee, and L. Martin-Vega. 1992. A review of production planning and scheduling models in the semiconductor industry, Part I: System characteristics, performance evaluation and production planning. IIE Transactions on Scheduling and Logistics 24: 47-61. Uzsoy, R., C. Lee, and L. Martin-Vega. 1994. A review of production planning and scheduling models in the semiconductor industry, Part II: Shop Floor Control. IIE Transactions on Scheduling and Logistics 26: 44-55.
Author Biography OLIVER ROSE is an assistant professor in the Department of Distributed Systems, Institute of Computer Science at the University of Würzburg, Germany. He received an M.S. degree in applied mathematics and a Ph.D. degree in computer science from the same university. He has a strong background in the modeling and performance evaluation of high-speed communication networks. Currently, his research focuses on the analysis of semiconductor and car manufacturing facilities. He is a member of IEEE and SCS. MATHIAS A. DUEMMLER is a research fellow at the Department of Distributed Systems, Institute of Computer Science at the University of Würzburg, Germany, where he received his Master degree in 1997. He is interested in the modeling, analysis and control of manufacturing systems, especially in the area of semiconductor manufacturing. His main interests are batch service systems and cluster tools. He is a member of SCS, INFORMS, and GOR (German Operations Research Society). ALEXANDER K. SCHOEMIG joined Infineon Technologies AG in 1997 (then: Siemens AG, Semiconductors) as a Simulation Engineer and Operations Analyst. He is currently responsible for the training of the simulation teams of the Infineon corporate front ends and works on the integration of queuing modeling methods and simulation techniques in decision making and operations management systems. Dr. Schoemig received a Master degree and a Ph.D. in Computer Science in 1992 and in 1997, respectively, from the University of Wuerzburg, Germany. From 1993 until 1997 he has been research fellow of the German Research Foundation (DFG). His main research interests are modeling and performance evaluation of production systems and business processes using queueing theory, stochastic Petri nets, and discrete event simulation. Dr. Schoemig is member of INFORMS, GI (“Gesellschaft für Informatik”), and GOR (German Operations Research Society).
9