AUSTRIAN J OURNAL OF S TATISTICS Volume 38 (2009), Number 4, 231–239
On Varying Item Difficulty by Changing the Response Format for a Mathematical Competence Test Christine Hohensinn and Klaus D. Kubinger Faculty of Psychology, University of Vienna Center of Testing and Consulting - Division of Psychological Assessment and Applied Psychometrics Abstract: Educational and psychological aptitude and achievement tests employ a variety of different response formats. Today the predominating format is a multiple-choice format with a single correct answer option (at most out of altogether four answer options) because of the possibility for fast, economical and objective scoring. But it is often mentioned that multiple-choice questions are easier than those with constructed response format, for which the examinee has to create the solution without answer options. The present study investigates the influence of three different response formats on the difficulty of an item using stem-equivalent items in a mathematical competence test. Impact of formats is modelled applying the Linear Logistic Test model (Fischer, 1974) appertaining to Item Response Theory. In summary, the different response formats measure the same latent trait but bias the difficulty of the item. Keywords: Item Response Format, Multiple-choice, Item Response Theory, Linear Logistic Test model, Rasch model.
1 Introduction When constructing an educational or psychological aptitude test, a fundamental decision is the choice of an appropriate item response format. A large variety of such different formats exists, though most can be classified as multiple-choice formats or formats with a constructed response. Conventional multiple-choice formats consist of a single correct answer option and two to seven distractors. Other sorts of multiple choice formats contain more than a single solutions which the examinee has to mark. Scoring rules then differ between counting every correctly marked correct answer option and scoring an entire item as solved only if all correct answer options and no distractors have been marked. As concerns formats of constructed response, the examinee has to create the correct answer without being given answer options. Because multiple-choice items allow economical and objective scoring, this format is the predominant response format in psychological aptitude or achievement tests and educational tests. Application of different response formats raises the question whether usage of a different response format alters the measured latent trait and to what extent different response formats influence the difficulty of an item. There is some evidence that multiple-choice as well as constructed response formats measure the same proficiency (e.g. Thissen, Wainer, and Wang, 1994), but multiplechoice items are supposed to be generally easier than constructed response items. This
232
Austrian Journal of Statistics, Vol. 38 (2009), No. 4, 231–239
is because an examinee who does not know the answer can guess and thereby has a good chance of benefitting from a lucky hit without sufficient knowledge (e.g. Traub and MacRury, 2006). Additionally, the given answer options can give the examinee a hint for finding the solution. In this sense, Bridgemen (1992) points out that for multiple-choice items, the examinee receives implicit corrective feedback by comparing whether his or her created solution is among the given answer options of that item. Additionally, a “working backwards from the answer choices”-strategy can be applied, meaning that the examinee can solve the item by just plugging in the given answer options in the task. The possibility of applying these strategies raises the expectation that a multiple-choice format makes an item easier in comparison to constructed response formats. For stem-equivalent mathematical items, Bridgemen (1992) found that the impact of different response formats is item-specific. Thus, for some items the constructed response item had an almost equal difficulty, whereas for other items the multiple-choice item was obviously easier than the constructed response counterpart. Discrepancies in difficulty were particularly high for multiple-choice items containing distractors which reflected typical errors of students. In a study by Birenbaum, Tatsuoka, and Gutvirtz (1992), algebraic multiple-choice items were developed based on empirically tested constructed response items, with distractors displaying common mistakes made by students. Most of these stem-equivalent multiple-choice items were even more difficult than their constructed response counterparts. Katz, Bennet, and Berger (2000) asked whether different item formats initiate different problem-solving strategies in the examinee. It was expected that differences in performance on multiple-choice items and their constructed response counterparts would be caused by involving the response options in the solving process. But results indicated that solution strategy does not mediate effects of format on difficulty. Rather, comprehension of the written item stem mediates the effects of format on strategy choice and difficulty. However, consistently with the results of Bridgemen (1992), some multiplechoice items were obviously easier than their constructed-response counterparts whereas others had approximately the same difficulty. In summary, these results suggest that constructed response items are more difficult than multiple-choice items except when distractors reflect typical mistakes. A majority of studies examine the most frequently administered multiple choice format with a single correct answer. By now, studies have focused to a lesser extent on other kinds of multiple-choice format, e.g. multiple-mark formats with several correct answers. Cronbach (1941) and Pomplun and Omar (1997) already recommended the use of a multiple-mark format and mentioned it as a feasible alternative to conventional multiple choice. Considering the influence on item difficulty of the multiple-mark, it was found that items with a multiple-mark format “2 of 5” with two solutions which both have to be marked are almost equal in difficulty to those with a constructed response format. Furthermore, the “2 of 5”-format and the constructed response format were both clearly more difficult than a conventional multiple-choice format with only one solution (Kubinger, Holocher-Ertl, and Frebort, 2006; Kubinger, Holocher-Ertl, Reif, Hohensinn, and Frebort, 2010). Most studies examining differences in item difficulties caused by response formats
233
C. Hohensinn, K. D. Kubinger
apply statistical mean comparison methods like ANOVA. The present study chose another statistical approach for this issue, applying the Linear Logistic Test model as one model of the framework of Item Response Theory (Fischer, 1973, 1974, 1995). The LLTM employs a special case of the Rasch model (cf. Rasch, 1980), which defines the probability of solving item i with difficulty σi for examinee v having ability θv as: P (+|θv , σi ) =
exp(θv − σi ) . 1 + exp(θv − σi )
(1)
The LLTM implements the item parameter σi as linear combination of basic parameter ηj weighted with known weights qij . p denotes the number of basic parameters and k the number of items: P exp(θv − pj=1 ηj qij ) P P (+|θv , ηj , qij ) = . (2) 1 + exp(θv − pj=1 ηj qij ) Because LLTM models item difficulty as a combination of some underlying components, this model can be seen as a sort of explanatory item response model (De Boeck and Wilson, 2004). Conditional maximum likelihood estimation can be conducted for estimation of ηj (Fischer, 1973). Hence, model fit of LLTM can be tested using a likelihood-ratio test contrasting the likelihood of the LLTM against the likelihood of the Rasch model. In this context, the latter constitutes a quasi-saturated model. Of course, for conducting the likelihood-ratio test, the Rasch model have to fit the data: D = −2 log
LLLT M LRM
(3)
is approximately χ2 -distributed with df = k − p − 1 (with number of basic parameters smaller than number of items p < k). LLTM makes it possible to test specified hypotheses about the impact of item administration effects like the influence of response format on item difficulty (Kubinger, 2008).
2 Method Aim of the present study was to examine the impact of three different response formats on the difficulty of mathematical items. A conventional multiple-choice format “1 of 6” with a single correct answer option and five distractors, as well as a sort of multiple-mark format “2 of 5”, consisting of two correct answer options and three distractors was used. For the latter format, the examinee had to mark both solutions and none of the distractors in order to solve the item. As the third response format, constructed response “grid” items were used in which the correct numerical solution had to be found and and filled into a given grid on the answer sheet. Subject-matter experts developed items for a mathematical competence test for 8th grade students in the Austrian educational standards project (cf. Kubinger et al., 2007). In order to investigate the influence of the response format on item difficulty, stemequivalent items were developed for the subtest “Interpreting and Documenting”, which
234
Austrian Journal of Statistics, Vol. 38 (2009), No. 4, 231–239
measures the competence for finding a correct solution procedure for a mathematical task and interpreting numerical results correctly. These stem-equivalent items had identical item stem but different response formats. The given item stem for the examinees was embedded in a common situation described with a short text. To develop the stem-equivalent counterparts, subject-matter experts changed the response format of established items. Because of the characteristics of the task, it was not possible to combine every item stem with every response format. In fact, it was difficult to change an established “1 of 6” or “grid” item into a “2 of 5”. Therefore, for almost all item pairs, the original item was a “2 of 5” or a “grid” item resulting in a new “1 of 6” counterpart. Only one original item had a “1 of 6” response format which was changed into a “2 of 5” counterpart. However, a total of twelve item pairs was administered; eight item pairs consisted of a “1 of 6” and a “2 of 5” part and four pairs consisted of a “1 of 6” and a “grid” part. The mathematical competence test was administered as large-scale assessment with twelve different test booklets, each containing 32 items. Thus, every part of an item pair was administered in different booklets with different examinees working on it, excluding influences of learning or memory effects for the stem-equivalent items. To eliminate itemposition effects, both items of an item pair were administered at almost the same position within a test booklet. For the subtest “Interpreting and Documenting”, which included the stem-equivalent items, a total of 32 items were administered.For this study one item with a free response format was excluded because this was the only one item with a longanswer-text to be given by the examinee for this subtest. Testing was conducted in all nine regional districts of Austria in 2008. 3143 students worked on the test with 53.46 percent male and 46.54 percent female students. For Rasch model and LLTM analyses, the R-package eRm (Mair and Hatzinger, 2007; see also Poinstingl, Mair, and Hatzinger, 2007) was used.
3 Data Analyses and Results In a first step, Rasch model analyses were conducted assessing model fit with Andersen‘s Likelihood-Ratio test (Andersen, 2005), using four partition criteria: score, gender, mother tongue and geographical region. For Rasch model analyses, the overall sample was randomly split into a calibration sample and a testing sample (nc = 1568, nv = 1575) to ensure some kind of cross-validation. In the case of a significant likelihood-ratio test (α = .01) in the calibration sample items with poor model fit were excluded from the item pool according to graphical model check as much as the likelihood-ratio test resulted a-posteriori insignificant. Subsequently, this a-posteriori model fit was tested again within the testing sample by Andersen‘s Likelihood Ratio test in order to ensure that model-fit was not artificial. In the calibration sample, 2 of 31 items had to be excluded due to poor model fit. The remaining 29 items indicated good model fit in the testing sample (see Table 1). One of the non-fitting items had a “grid” format, the other one a “1 of 6”. Furthermore each of these two non-fitting items was part of an item pair. Subsequently, LLTM analyses were conducted with the calibration sample and the 29 Rasch-model fitting items. Because of exclusion of two non-fitting items ten item pairs remained for further analyses.
235
C. Hohensinn, K. D. Kubinger
Table 1: Results of Andersen’s Likelihood-Ratio tests with respect to the calibration and testing sample. The results refer to the analysis after excluding 2 non-fitting items. Partition criteria Score Gender Mother tongue Geographical region
Calibration Sample (LRT) df χ2 (α = .01) 29.87 28 48.28 46.82 27 46.96 39.37 26 45.64 31.08 28 48.28
Testing Sample (LRT) df χ2 (α = .01) 22.55 28 48.28 41.59 28 48.28 22.78 24 42.98 35.76 27 46.96
χ2
χ2
It was hypothesized that the difficulty of an item is a combination of the difficulty of the item stem σi∗ and the difficulty of the response format γs , so that the LLTM for analysing response format effects can be specified as: P (+|θv , σi∗ , γs ) =
exp(θv − σi∗ − γs ) . 1 + exp(θv − σi∗ − γs )
(4)
Accordingly, the design matrix of LLTM was constructed with basic parameters modelling items stems as well as response formats (see Table 2). Table 2: A scheme of the design matrix of LLTM analysis modeling an effect of response format; missing entries means qij = 0. Item Number 1a 1b 2a 2b ...
σ1∗ 1 1
...
σ2∗ 1 1 ...
... ... ... ... ... ...
γ1 1
γ2
γ3
1 1 ...
...
1 ...
Additionally, a LLTM with restriction γs = 0 was estimated to test whether item difficulty is fully determined by difficulty of the item stems. The likelihood-ratio test (3) turns out to be significant for LLT Mγs 6=0 (χ2LRT = 25.61, df = 8, χ2.99 = 20.09). A likelihood-ratio test for the more restricted LLT Mγs =0 was therefore unnecessary. This result implicates that the LLT Mγs 6=0 does not fit as well as the Rasch model. Deviances and AIC indicate only small differences between the LLT Mγs 6=0 and LLT Mγs =0 (see Table 3). Table 3: Deviance and information criterion AIC for LLTM and Rasch model. LLT Mγs 6=0 LLT Mγs =0 Rasch model
−2 log L 7048.92 7051.94 7023.31
np 20 18 28
AIC 7088.92 7087.94 7079.31
236
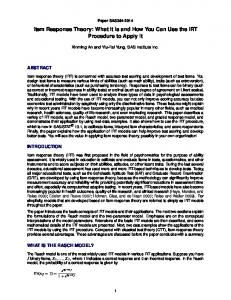
0.5 −0.5 −1.5
1 of 6 2 of 5 grid
−3.5
−2.5
item difficulty parameter
1.5
2.5
3.5
Austrian Journal of Statistics, Vol. 38 (2009), No. 4, 231–239
1
2
3
4
5
6
7
8
9
10
item pairs
Figure 1: Item difficulties estimated using the Rasch model for each of the ten item pairs.
Comparing item difficulties for each item pair (see Figure 1) suggests that the multiplemark format “2 of 5” and the constructed response format “grid” tend to be equal or slightly more difficult than the conventional multiple choice format “1 of 6”. The only exception is item pair 5, with the “2 of 5”-part being obviously easier than the “1 of 6” part. This item pair is the only one for which an original “1 of 6” item was changed into a “2 of 5” counterpart. Inspection of the content of item stem and distractors shows that for the “2 of 5” format, both correct answers are just two different notations of the solution (one time as a fraction, one time as a division expression). This emphasizes the difficulty in changing the response format of an established item stem into a “2 of 5”-format. Because of these troublesome distractors, a second LLTM was fitted a posteriori. The scheme of the design matrix was analogous to the first but separated the basic parameters σi∗ for item pair 5. Therefore, both parts of item pair 5 do not reflect stem-equivalent items in the LLTM. The likelihood-ratio test of the LLT Mγs 6=0 is now non-significant, indicating a good model-fit (χ2LRT = 15.46, df = 7, χ.99 = 18.48). In contrast, the likelihood-ratio test for the LLT Mγs =0 is significant (χ2LRT = 22.01, df = 9, χ.99 = 21.67), implicating that the inclusion of response format effects is necessary. This is also supported by AIC (see Table 4), although differences between AICs for both LLTM are
237
C. Hohensinn, K. D. Kubinger
small, showing only a relatively minor effect of response format. Table 4: Deviance and AIC for LLTM “a posteriori” and Rasch model. LLT Mγs 6=0 LLT Mγs =0 Rasch model
−2 log L 7038.77 7045.32 7023.31
np 21 19 28
AIC 7080.77 7083.32 7079.31
The estimated effect of response format parameter for “2 of 5” discloses that this format makes the item more difficult (in contrast to “1 of 6” format) γˆ2 = 0.35 [0.63; 0.07]. For the constructed response format, only a tendency is found for making the item more difficult: γˆ3 = 0.13 [0.51; −0.25]. As mentioned in the introduction, results of previous studies (Birenbaum et al., 1992; Bridgemen, 1992) indicate that multiple-choice format is equal to constructed response format in regard to item difficulty if distractors contain typical errors of students for this task. For item pairs 8, 9 and 10, consisting of a “grid” and a “1 of 6” part, frequency of answers in the constructed response format were listed. It was explored whether the most frequently given answers in the constructed response format reflect distractors in the “1of 6” format. For item pair 8, the by far most frequently given answer was a false answer (41.7 percent; in contrast, the solution was written down by 20.6 percent). Exactly this false answer was one of the distractors in the “1 of 6” part. For item pair 9, the most frequently given false answer was written down by 11.29 percent of students working on this item. Again the identical answer was administered as distractor of the “1 of 6” part. Therefore, in item pair 8 and 9, typical errors of students were included in the distractors. Difficulty of items for item pairs 8 and 9 are almost equal (see Figure 1). For item pair 10, no false answer could be found which were given by a high percentage of students (the most frequent false answer was written by 4.49 percent). Therefore, no typical errors could be identified for this task. In contrast to previous two item pairs for item pair 10, the “grid” item tends to be more difficult than the “1 of 6” part.
4 Discussion The present study examines the impact of different response formats on the difficulty of mathematical items. To separate the effects of difficulty of the item stem and the response format, the response format of established items was changed. It was eminently difficult and often impossible to change a “1 of 6” or a “grid” format into a “2 of 5” format because a second solution for the item stem often did not exist. The only administered item where this was attempted turned out to be oversimplified because no two “true” solutions could be found. The second correct answer option could be derived relatively easily from the first. After excluding this special item pair, results suggest an impact of response formats on item difficulty. The extent of this impact seems to be somewhat item-specific (see Figure 1). Nevertheless, a general effect of increasing difficulty could be found for the “2 of 5” format. A possible reason could be the minimized chance of lucky guessing because
238
Austrian Journal of Statistics, Vol. 38 (2009), No. 4, 231–239
the a-priori probability of solving these items is considerably reduced in comparison to a “1 of 6” format. But for developing “2 of 5” items, it is highly recommended to plan this item format a priori. Simply changing the format of an established conventional multiple choice format into a “2 of 5” format bears the risk of oversimplification. Taking this into account, the “2 of 5” format seems a proper alternative to the conventional multiple-choice format with the advantage of minimizing guessing. For the constructed response format results, estimation of γˆ3 indicates a trend toward making items more difficult. Further descriptive analyses correspond with previous findings that the constructed response format is more difficult in comparison to a conventional multiple-choice format if the multiple-choice counterpart does not offer typical errors as distractors. Despite influences on item difficulty, the different response formats seem to measure the same proficiency. All items show a good fit for the Rasch model, which requires a unidimensional latent trait. These findings also coincide with previous results (Thissen et al., 1994). Thus changing the response format does not alter the measured competence but can modify the item difficulty.
References Andersen, E. B. (2005). A goodness of fit test for the Rasch model. Psychometrika, 38, 123-140. Birenbaum, M., Tatsuoka, K. K., and Gutvirtz, Y. (1992). Effects of response format on diagnostic assessment of scholastic achievement. Applied Psychological Measurement, 16, 353-363. Bridgemen, B. (1992). A comparison of quantitative questions in open-ended and multiple-choice formats. Journal of Educational Measurement, 29, 253-271. Cronbach, L. J. (1941). An experimental comparison of the multiple true-false and multiple multiple-choice tests. The Journal of Educational Psychology, 32, 533543. De Boeck, P., and Wilson, M. (Eds.). (2004). Explanatory Item Response Models. New York: Springer. Fischer, G. H. (1973). The linear logistic test model as an instrument in educational research. Acta Psychologica, 37, 359-374. Fischer, G. H. (1974). Einf¨uhrung in die Theorie psychologischer Tests. Bern: Huber. Fischer, G. H. (1995). The linear logistic test model. In G. H. Fischer and I. W. Molenaar (Eds.), Rasch Models: Foundations, Recent Developments and Applications (p. 131-156). New York: Springer. Katz, I. R., Bennet, R. E., and Berger, A. E. (2000). Effects of response format on difficulty of SAT-mathematics items: It‘s not the strategy. Journal of Educational Measurement, 37, 39-57. Kubinger, K. D. (2008). On the revival of the Rasch model-based LLTM: From constructing tests using item generating rules to measuring item administration effects. Psychology Science Quarterly, 50, 311-327. Kubinger, K. D., Frebort, M., Holocher-Ertl, S., Khorramdel, L., Sonnleitner, P., Weit-
C. Hohensinn, K. D. Kubinger
239
ensfelder, L., et al. (2007). Large-Scale Assessment zu den Bildungsstandards ¨ in Osterreich: Testkonzept, Testdurchf¨uhrung und Ergebnisverwertung. Erziehung und Unterricht, 157, 588-599. Kubinger, K. D., Holocher-Ertl, S., and Frebort, M. (2006). Zur testtheoretischen Qualit¨at von Multiple Choice-Items: 2 richtige aus 5 vs. 1 richtige aus 6 Antwortm¨oglichkeiten. In B. Gula, R. Alexandrowicz, S. Strauß, E. Brunner, B. Jenull-Schiefer, and O. Vitouch (Eds.), Perspektiven psychologischer Forschung ¨ ¨ in Osterreich. Proceedings zur 7. Wissenschaftlichen Tagung der Osterreichischen Gesellschaft f¨ur Psychologie (p. 459-464). Lengerich: Pabst. Kubinger, K. D., Holocher-Ertl, S., Reif, M., Hohensinn, C., and Frebort, M. (2010). On minimizing guessing effects on multiple-choice items: Superiority of a 2-solutionsand3-distractors item format to a 1-solution-and-5-distractors item format. International Journal of Selection and Assessment. Mair, P., and Hatzinger, R. (2007). eRm: Extended Rasch modeling. R package. (http://cran.r-project.org/) Poinstingl, H., Mair, P., and Hatzinger, R. (2007). Manual zum Softwarepackage eRm (extended Rasch modeling) – Anwendung des Rasch-Modells (1-PL Modell). Lengerich: Pabst Science Publishers. Pomplun, M., and Omar, M. H. (1997). Multiple-mark items : An alternative objective item format. Educational and Psychologial Measurement, 57, 949-962. Rasch, G. (1980). Probabilistic Models for some Intelligence and Attainment Tests. Chicago: The University of Chicago Press. Thissen, D., Wainer, H., and Wang, X.-B. (1994). Are tests comprising both multiplechoice and free-response items necessarily less unidimensional than multiplechoice tests? Journal of Educational Measurement, 31, 113-123. Traub, R. E., and MacRury, K. (2006). Antwort-Auswahl- vs Freie-Antwort-Aufgaben bei Lernerfolgstests. In K. Ingenkamp and R. S. J¨ager (Eds.), Tests und Trends 8: Jahrbuch der P¨adagogischen Diagnostik. Weinheim: Beltz Verlag.
Authors’ address: Christine Hohensinn and Klaus D. Kubinger Center of Testing and Consulting Division of Psychological Assessment and Applied Psychometrics Faculty of Psychology, University of Vienna Liebiggasse 5 A-1010 Vienna E-mail:
[email protected],
[email protected]