Int J Adv Manuf Technol DOI 10.1007/s00170-006-0835-5
ORIGINAL ARTICLE
Online qualitative nugget classification by using a linear vector quantization neural network for resistance spot welding Mahmoud El-Banna & Dimitar Filev & Ratna Babu Chinnam
Received: 30 May 2006 / Accepted: 3 October 2006 # Springer-Verlag London Limited 2007
Abstract Real-time estimation of weld quality from process data is one of the key objectives in current weld control systems for resistance spot-welding processes. This task can be alleviated if the weld controller is equipped with a voltage sensor in the secondary circuit. Replacing the goal of quantifying the weld quality in terms of button size by the more modest objective of indirect estimation of the class of the weld, e.g., satisfactory (acceptable, “normal” button size), unsatisfactory (undersized, “cold” welds), and defects (“expulsion”), further improves the feasibility of the mission of indirect estimation of the weld quality. This paper proposes an algorithmic framework based on a linear vector quantization (LVQ) neural network for estimation of the button size class based on a small number of dynamic resistance patterns for cold, normal, and expulsion welds that are collected during the stabilization process. Nugget quality classification by using an LVQ network was tested on two types of controllers; mediumfrequency direct current (MFDC) with constant current controller and alternating current (AC) with constant heat controller. In order to reduce the dimensionality of the input data vector, different sets of features are extracted from the M. El-Banna (*) Industrial Engineering Department, University of Jordan, Amman 11942, Jordan e-mail:
[email protected] D. Filev Ford Motor Company, Dearborn, MI 48121, USA e-mail:
[email protected] R. B. Chinnam Department of Industrial and Manufacturing Engineering, Wayne State University, Detroit, MI 48201, USA e-mail:
[email protected]
dynamic resistance profile and are compared by using power of the test criteria. The results from all of these investigations are very promising and are reported here in detail. Keywords Learning vector quantization . Nugget quality classification . Spot welding
1 Introduction For several decades, resistance spot welding has been an important process in sheet metal fabrication. The automotive industry, for example, is dominated by spot welding, due to its simple and cheap operation. The advantages of spot welding are numerous and include the following: an economical process, adaptable to a wide variety of materials (including low-carbon steel, coated steels, stainless steel, aluminum, nickel, titanium, and copper alloys) and thicknesses, a process with short cycle times, and a relatively robust process with some tolerance to fit-up variations. However, given the uncertainty associated with individual weld quality (attributed to factors such as tip wear, sheet metal surface debris, fluctuations in power supply, etc.), it is a common practice in the industry to add a significant number of redundant welds to gain confidence in the structural integrity of the welded assembly. In recent years, global competition for improved productivity and reduced non-value-added activity is forcing companies such as the automotive OEMs to eliminate these redundant spot welds. In order to minimize the number of spot welds and, yet, still satisfy essential properties such as strength, weld quality must be obtained. Traditionally, to check weld quality, destructive tests (the dominant method of inspection in the industry) and nondestructive tests are used on randomly sampled work
Int J Adv Manuf Technol
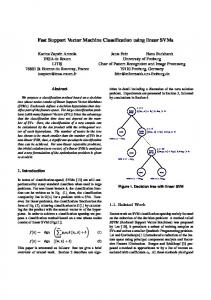
pieces at the production site. These processes also tend to be predominantly off-line or end-of-line processes. While this information is of good value, there is often too much delay in the collection of the information to utilize it for controlling the process. Weld quality estimation must be performed in real-time in order to monitor and repair weld defects as they occur and, more importantly, to control the process. The literature offers several different nondestructive evaluation techniques for weld quality evaluation. The most promising techniques can be roughly grouped into four major categories: ultrasonic technique, thermal force technique, displacement technique, and, finally, dynamic resistance technique. It should be noted here that some of these techniques are more suitable than others for on-line evaluation and control. In addition, some of these techniques tend to be very intrusive and/or expensive for widescale deployment (for example, the ultrasonic technique), and, in that sense, are not compatible today for mainstream resistance welding. The rest of this section briefly describes these nondestructive evaluation techniques. The ultrasonic technique has been explored by many researchers [1–4]. In order to estimate the spot weld quality, the most important thing that should be known is the threedimensional geometry of the weld nugget. The consistent result from the literature is that the geometry can be determined by measuring the transit time and the attenuation of the ultrasonic wave (or echo) propagated through the weld nugget in a direction perpendicular to the faces of Fig. 1 Different types of current applied in spot welding; alternating current (AC), direct current (DC), condensator discharge (CD), and medium-frequency direct current (MFDC)
the sheet metal stack. On the contrary, Chien and KannateyAsibu [5] show that the analysis of the raw acoustic emission (AE) signals, as well as the spectrum and root mean square (RMS) values, revealed no specific correlation between the AE signals and nugget formation. While the ultrasonic methods have shown good promise in laboratory environments, from a practical point of view, acoustic sensors cannot be easily mounted and maintained on weld guns (calibration will be necessary at regular intervals). They also tend to negatively affect the circulation of the coolant within the tips, besides the wiring problems that will limit the movement of the robot holding the welding gun, and the susceptibility of the signal to magnetic field fluctuations. The thermal force technique has also been widely investigated by many researchers [6–10]. There is a distinct difference between the applied welding force, which is an important parameter of a resistance welding process, as it ensures electrical contact and reduces the odds of weld nugget expulsion, and the thermal force. Thermal expansion caused by the growing weld nugget will be sensed by the welding gun as “thermal forces.” This will indicate to the controller whether sufficient weld nugget growth has been achieved or not. The thermal force feedback system exploits the fact that thermal forces precisely reflect the state of the metal during the welding process. From a practical point of view, the fundamental drawback of this system is that the weld gun has to be very structurally rigid so as to be able to accurately transfer (and measure) the
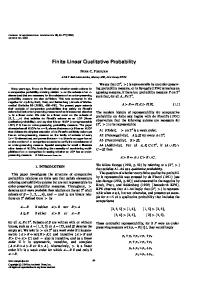
Int J Adv Manuf Technol Fig. 2 Linear vector quantization (LVQ) network model [10]. P is the input vector of size N, W1, 2 and S1, 2 are the weight matrices and the number of neurons in the first and second layers, respectively
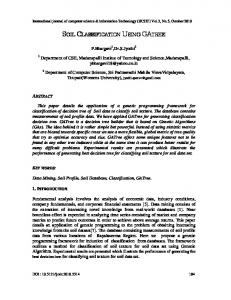
very small displacements to the load cell. Besides, the added weight tends to increase maintenance problems with the robots. This method has only limited success on certain types of weld guns (C type). The displacement technique directly measures nugget formation and expansion displacement between the electrodes, and has also been widely explored [5, 8, 11–14]. A number of control systems have been based on this principle. A linear variable differential transformer (LVDT) is typically used to measure electrode displacement. In order to avoid interference due to the noise from the magnetic field, in some cases, the displacement is measured with a digital optical encoder. The fundamental limitation with this technique is the lack of robustness. From a practical point of view, the wiring and magnetic field problems will also still be a hindrance. Given its definite physical meaning and ease of measurement, a number of studies on the secondary dynamic resistance have been performed. Through these studies, the relationship between the pattern of secondary dynamic resistance and the nugget growth has been determined (see, for example, Dickinson et al. [15]). Cho and Rhee [16] show that the process variables, which were monitored in the primary circuit of the welding machine, are used to obtain the variation of the dynamic resistance across electrodes. This allows the dynamic resistance monitoring system to be applied to the in-process system without any extra monitoring devices in the secondary Fig. 3 Schematic of an AC welder
circuit. In addition, in order to test the reliability of such a system, an artificial intelligence algorithm was developed to estimate the weld quality using the primary dynamic resistance. Cho and Rhee [16] used uncoated steel welding (low-carbon cold-rolled steel) to verify their model. However, coated steel (i.e., hot-dip galvanized steel) is the material mainly used in the auto industry and others to reduce corrosion. They also used shear strength as the weld quality metric, while the auto industry and others use the button diameter as their weld quality metric. Lastly, their tests were performed on an alternating current (AC) controller, while the medium-frequency direct current (MFDC) controller has still not been examined to date. Lee et al. [17] propose a quality assurance technique for resistance spot welding using a neuro-fuzzy algorithm. Four parameters from an electrode separation signal, in the case of non-expulsion, and dynamic resistance patterns, in the case of expulsion, are selected as the fuzzy input parameters. These parameters are determined using a neurolearning algorithm and are then used to construct a fuzzy inference system. They also used the displacement and the voltage signals as inputs to their model. Using the displacement signal is not very practical in the industry. They also used shear strength as the weld quality metric. Again, the test was performed on an AC controller, while MFDC is not examined. Podrzaj et al. [10] proposed a linear vector quantization (LVQ) neural network system to detect expulsion. The network is analyzed with different sensor combinations and different materials. The results show that the LVQ neural network is able to detect the expulsion in different materials. The experiment also points to the welding force signal as the most important indicator of the expulsion occurrence. They used the voltage and other sensors for expulsion detection, while cold and normal welds detection was not explored. While they
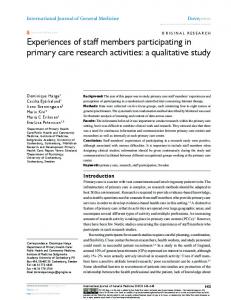
Int J Adv Manuf Technol Fig. 4 Schematic of an MFDC welder [22]
identify the welding force signal as the most important indicator for expulsion occurrence, the availability of the force signal is limited to certain types of guns, and they are more expensive than other types of sensors. Once again, the test was performed on an AC controller, while MFDC is not examined. Park and Cho [18] used an LVQ as well as a multi-layer perceptron (MLP) neural network to classify the weld quality (strength and indentation) by using the force signal. They classify the weld quality into five different categories: (I) insufficient welding state, (P) poor welding state, (G) good welding state, (R) rich welding state, and (E) excess weld state. The results show that the LVQ and MLP neural networks have a success rate of 90% and 95% for the test data, respectively. They also used the force signal as input, the shear strength as the weld quality metric, and only
tested the model using mild steel. The tests were again performed on an AC controller and MFDC is not examined. This paper deals with an algorithm for the estimation of weld nugget quality through the classification of button size based on a small number of patterns for cold, normal, and expulsion welds that are collected during the stabilization process. An LVQ network will be used to predict the three different categories for nugget quality (expulsion, normal, and cold welds) from the dynamic resistance profile. LVQ shows good performance for complex classification problems because of its fast learning nature, reliability, and convenience of use. It performs particularly well with small training sets. This property is specifically important for industrial applications, where the process of obtaining large training data sets may require considerable amount of time and cost.
12000 11000
Secondary Current (A)
10000 9000 8000 7000 6000 5000 4000 3000 2000
0
50
100
150
200
250
Welding Time(millisecond) Fig. 5 Sample secondary current profile from an MFDC constant current controller (CCC)
Fig. 6 Sample secondary current profile from an AC CCC
Int J Adv Manuf Technol Fig. 7 Schematic for experimental setup
The rest of this paper is organized as follows. Section 2 outlines the basic principles behind constant heat and constant current controllers. Section 3 briefly describes the LVQ neural network. Sections 4 and 5 discuss the experimental setup and the results obtained, respectively. Finally, Sect. 6 offers some concluding remarks.
values of the welding current are used in the machine parameter settings and in the process controls. It is often tedious for welding engineers to optimize the welding current profile and amplitude for any given welding application. The proposed LVQ classification network will be tested on the two most popular types of controllers; CHC CCC. A brief description of these controllers follows.
2 Constant heat and constant current weld controllers 2.1 Constant heat controller (CHC) Resistance spot welding machines are usually based on constant current controllers (CCC) or constant voltage controllers (CVC). A CCC machine will vary its output voltage to maintain a steady current, while a CVC machine manipulates its output current to maintain a constant voltage. Recently, Hasegawa and Furukawa [19] introduced a new type of controller, the constant heat controller (CHC), based on the idea of maintaining the specific heat. Figure 1 illustrates typical welding current types and profiles applied in resistance welding, including the singlephase AC (the most prevalent controller in industry), the three-phase direct current (DC), the condensator discharge (CD), and the newly developed MFDC. Usually, the RMS Table 1 Mechanical properties of the tested material Material type
0.2% yield (MPa)
Tensile strength (MPa)
% elongation, 2 in (51 mm) gage
Grade 11 Grade 22
234 406
333 474
38 31
1 2
Grade 1: 0.85-mm gauge, HSLA, eletrogalvanized Grade 2: 2.00-mm gauge, HSLA, hot dip galvanized
The CHC is a new type of controller based on a specific heat concept (i.e., the amount of heat induced per unit volume). In order to demonstrate the principles of CHC, let us introduce some notation. Let I denote the secondary Table 2 Element analysis for the base materials (weight %) Element
Grade 1
Grade 2
Carbon Manganese Phosphorous Sulfur Silicon Copper Nickel Chromium Vanadium Molybdenum Aluminum Titanium Tin Iron
0.01 0.20 0.02 0.01