Renee A. Pardieck, Robert J. Orth*, Robert J. Diaz, Romuald N. Lipcius. The College of William and Mary, ... 1995, Platell & Potter 1996). Alternatively, high food.
MARINE ECOLOGY PROGRESS SERIES Mar Ecol Prog Ser
Published September 17
Ontogenetic changes in habitat use by postlarvae and young juveniles of the blue crab Renee A. Pardieck, Robert J. Orth*, Robert J. Diaz, Romuald N. Lipcius The College of William and Mary, School of Marine Science. Virginia Institute of Marine Science. Gloucester Point, Virginia 23062, USA
ABSTRACT: Changing habitat requirements are evident during the developmental cycles of many species. In this field investigation, we attempted to distinguish between depth (shallow vs deep), habitat structure (seagrass species), and study site as factors influencing the distribution and abundance of postlarvae and juvenile blue crabs Callinectes sapidusin the Chesapeake Bay. Deep (270 cm mean low water [MLW])and shallow (150 cm MLW) suction samples in monospecific Zostera marina and Ruppia maritima beds were taken in the York River, a tributary of the Chesapeake Bay. Our studies revealed ontogenetic changes in habitat use, which suggested that blue crabs are influenced differently by physical and biological factors even during the earliest life stages. Postlarvae through 3rd instar distributions were not related to seagrass species, but their densities increased with distance upriver (regression, p < 0.004, n = 36 to 38, postlarvae: r'= 0.173, 1st instars: r2 = 0.308, 2nd-3rd instars: r2 = 0.231). Thls suggests that the smallest instar distributions are related to larval supply and physical forces, such as currents and winds, which determine water-column transport. In contrast, 4th and greater instars were significantly more abundant in Ruppia than in Zostera (ANOVA, df = 1, p < 0.05), possibly because of the high shoot density of Ruppia beds. Habitat use by 4th and greater instars may be related to seasonal changes in seagrass shoot density. Water depth did not influence the distribution of any crab stage. We suggest that habitat selection and differential mortality among habitats influence larger instar distributions more strongly than they influence the distribution of postlarvae and the earliest instars of C. sapidus.
KEY WORDS: Blue crabs. Callinectes sapidus. Ontogenetic changes - Habitat structure . Habitat use Settlement. Recruitment. Shallow-water refuge . Seagrass beds
INTRODUCTION Distributions of marine organisms are often mediated by habitat complexity (Roughgarden et al. 1988, Olmi et al. 1990, Eggleston & Armstrong 1995), which is defined by structural aspects of the environment, such as rock, heterogeneous sediments, oyster reefs, worm tubes, macroalgae and emergent or submersed vegetation (Marinelli & Coull 1987, Day & Lawton 1988, Wilson et al. 1990, Heck & Crowder 1991, Schneider & Mann 1991a, Love & Bailey 1992). High organism abundances in complex habitats may be due to flow-induced transport (Eckrnan 1983, Eckrnan & Nowell 1984, Butman 1987), reduced predation (decapod crustaceans, Heck & Thoman 1981; spiny lobster, Herrnkind & Butler 1986, Lipcius et al. 19998; queen conch, Ray & Stoner 1995; amphipods, Ryer 1987; Atlantic cod, 'Addressee for correspondence. E-mail: jjorth9vims.edu
Q Inter-Research 1999 Resale of f d article not permitted
Tupper & Boutilier 1995), abundant living space, and food availability (snails, Bronmark 1985; amphipods, Hacker & Steneck 1990; juvenile spiny lobster, Herrnkind & Butler 1986; epifaunal invertebrates, Schneider & Mann 1991b; juvenile blue crab, Perkins-Vissser et al. 1996). Water depth can also affect species distributions. In simple, unstructured areas, many organisms take refuge in shallow water (Ruiz et al. 1993), where their predators (e.g. larger finfish or invertebrates) are less abundant. These primary predators may avoid shallow water because of their susceptibility to avian and mammalian predators higher in the food web, because of decreased foraging ability, or because of fluctuating temperature and oxygen levels (Ruiz et al. 1993, Loneragan et al. 1994, Dittel et al. 1995, Lonzarich & Quinn 1995, Platell & Potter 1996). Alternatively, high food abundances can attract both prey and predators into shallow water in some systems (Miltner et al. 1995).
228
Mar Ecol Prog Ser 186: 227-238, 1999
Interactions between depth and habitat complexity occur in some habitats. Plant species composition, leaf morphology, and the abundances of woody debris, shells and rooted submersed aquatic plants often change with depth (den Hartog 1977, Duarte 1991, Platell & Potter 1996). In seagrass beds, habitat complexity and depth collectively influence species distributions. The high density and diversity of fauna associated with seagrass beds (Orth 1977, Orth et al. 1984, Heck et al. 1995) can vary within and between seagrass species (Schneider & Mann 1991b). Measures of habitat complexity, such as plant biomass, blade density, leaf surface area, plant architecture, and plant species composition, may explain these patterns (Stoner 1980, 1983, Orth et al. 1984, Stoner & Lewis 1985, Virnstein & Howard 1987, Orth 1992, Lipcius et al. 1998). Seagrass beds also slow currents and enhance deposition of fine sedirnents and passive plankters. This effect varies with plant morphology, bed shape, size and height of different seagrass species (Kikuchi& Peres 1977, Fonseca & Fisher 1986)and may influence larval distributions (Orth 1992). Given the many facets of habitat complexity and the limitations of space, food, or refugia in the marine environment, the distributions of many organisms shift during development. An obvious example is an organism, such as the blue crab, progressing from a planktonic to a benthic existence (Olmi et al. 1990). Such ontogenetic changes in habitat use can result from changing nutritional needs, competition, and predation. During development, the spiny lobster Panulirus argus shifts from plankton to macroalgae to crevices, and finally ventures into open spaces when it is large enough to deter predators (Childress & Herrnkind 1994).In a laboratory experiment, small and medium Jonah crabs chose cobble substrate over sand more frequently and burrowed deeper than large crabs, compensating for their increased vulnerability to predation (Richards 1992).This investigation reveals subtle changes in the habitat use of blue crabs during the rapid growth of the earliest life stages. In the Chesapeake Bay, 2 seagrass species with distinct morphologies and spatial distributions dominate shoal areas (< 2 m at mean low water [MLW]):widgeon grass Ruppia maritima (hereafter Ruppia)and eelgrass Zostera marina (hereafter Zostera). Vegetative Zostera has wide, straplike blades; reproductive Zostera, appearing from April to June in the Chesapeake Bay, has longer, branched shoots, each with several spathes (den Hartog 1970, Orth & Moore 1986). In contrast, vegetative Ruppia has short, threadlike shoots. Reproductive Ruppia, growing mainly from July through September, has highly branched, threadlike shoots, which can reach over a meter in length. Ruppia commonly grows in monospecific stands in shallow
water (approx. < 0.3 m MLW). At intermediate depths (approx. 0.3 to 0.6 m MLW), Zostera and Ruppia cooccur, while in deep water (approx. > 0.6 m MLW), generally only Zostera is abundant (Orth & Moore 1988). Seagrass beds in the lower Chesapeake Bay are an important nursery habitat for the blue crab Callinectes sapidus (Orth & van Monffrans 1987, Orth et al. 1996, Pile et al. 1996).After larval development on the continental shelf (Epifanio 1988), blue crab postlarvae reinvade the Chesapeake Bay and settle in seagrass beds, where growth through several juvenile stages occurs. The effectiveness of a seagrass bed as a refuge is a function of crab density (Perkins-Visser et al. 1996, Moksnes et al. 1997),crab size (Pile et al. 1996) and seagrass characteristics (Heck & Thoman 1981, Williams et al. 1990, Schulman 1996).Postlarval settlement occurs episodically from July to November, with pulses associated with the full and new moons (van Monffrans et al. 1990, 1995). Floral species composition and water depth are fundamental and ubiquitous features of the seagrass habitat, and likely influence survival, feeding and habitat preferences of blue crab postlarvae and young juveniles. Previous studies have not distinguished the effects of water depth and seagrass species on blue crab distributions, despite studies indicating that juveniles of epibenthic species should be more abundant in shallow (Ruiz et al. 1993), complex seagrass habitats (Hurnphries 1996).Also, blue crabs at different stages of growth could be influenced differently by physical and biological forces, even during the earliest stages of development. Hence, the objective of this study was to determine the effect of seagrass species and water depth on blue crab distributions, and examine ontogenetic changes in these distributions with respect to seagrass species and depth.
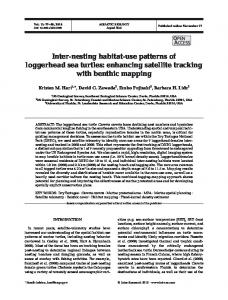
STUDY SITES This investigation took place during the summers of 1994 and 1995, in the lower York River, within beds of Ruppia and Zostera (Fig. 1). Seagrasses were especially abundant along the north shore, from the river mouth to Gloucester Point. On the south shore, seagrasses were only abundant at the mouth. There were 2 types of seagrass beds: (1)monospecific Zostera beds in shallow and deep water (20 to 100 cm MLW), and (2) Ruppia/Zostera beds, in which monospecific Ruppia in the shallows (150 cm MLW) graded into monospecific Zostera at deeper depths (270 cm MLW). Only monospecific areas within Ruppia/Zostera beds were sampled (Fig. 2). Mixed beds were excluded from sampling.
Pardieck et al.: Ontogenetic changes in habitat use by blue crabs
In 1994, reproductive and vegetative Ruppia were present during sampling. Reproductive Zostera defoliated prior to sampling in both 1994 and 1995, as did reproductive Ruppia in 1995. In 1994, water temperature ranged between 21 and 28°C. Salinity ranged between 12 and 22%. On the north shore, Rupp~abeds were in water depths from 15 to 48 cm MLW, and Zostera beds from 47 to 85 cm MLW. On the south shore, Ruppia beds were in water depths from 20 to 34 cm MLW, and Zostera beds from 25 to 59 cm MLW. In 1995, sediments at the study sites were generally 80 to 90% sand and 10 to 20% silt and clays. Water temperature ranged between 20 and 25°C. Salinity ranged between 20 and 25%. Blue crab postlarvae recruit to the York River from mid-July to November (van Montfrans et al. 1990, 1995), where they settle in seagrass beds and grow through the early juvenile instars (Lipcius et al. 1990, Olmi et al. 1990, Orth et al. 1996).
MATERIALS AND METHODS In 1994, we tested the hypothesis that early-stage blue crabs were evenly distributed between adjacent Ruppia and Zostera beds. A grid (100 X 100 m) was established near the York River mouth on each shore: Guinea Marsh (north) and Goodwin Island (south)
(Fig. 1). Each grid enclosed approximately equal proportions of Ruppia in the shallows and Zostera in deeper areas. Mixed grassbeds in the center of the grids were excluded from sampling. Prior to sampling, grids were marked at 10 m intervals, resulting in 100 quadrats, each 10 X 10 m. On each sampling date, 20 quadrats were randomly selected from each grid: 10 each in Zostera and Ruppia areas. As in previous summers, blue crab postlarval abundance was monitored in the York River with nightly plankton samples and artificial settlement substrates (van Montfrans et al. 1995).Our sampling was initiated on 26 July, 20 August, 23 August, 21 September, and 23 September, after postlarval pulses were detected. On all dates, samples were taken on each shore. Because of patchy seagrass beds and epiphyte growth, samples on the north shore in July were excluded from this study. Crabs were sampled with a suction dredge (Orth & van Monffrans 1987) in each randomly selected gnd unit. A 0.05 m2 drop cyhnder was placed over the grass, and crabs were suctioned into a mesh bag for 30 S. Spine to spine carapace width (CW) of each crab was measured with calipers to the nearest mm. In each selected grid, a 0.02 m2 core was used to sample above-ground standing seagrass crop. Aboveground wet weight and dry weight were determined for vegetative and reproductive Ruppia and vegetative
MObjack Bay
York River
A Shallow Zostera
g. 1 . Map of study area showing 1994 and 1995 sampling sites in seagrass beds in the York River, Virginia
Mar Ecol Prog Ser 186: 227-238, 1999
230
Monospecific Zostera Bed
bution was only found in August, for 2nd to 5th instars on the south shore (Ruppia: Q = 0.975, df = 19, p < 0.05; Zostera: Q = 0.975, df = 19, p < 0.05), and in September, for postlarvae to 1st instars on the north shore in Ruppia beds (Q = 0.975, df = 19, p < 0.05). The predicted p of a crab occurring in Ruppia was obtained from the logistic function derived from the logistic regression. The predicted p for crab occurrence in Zostera was 1 - p. On the north and the south shore, the probability of occurrence of each crab was compared between Ruppia and Zostera through time. Crab densities in Ruppia and Zostera were significantly different if a 95 % confidence interval generated from the asymptotic standard error excluded a probability of 0.5, which denotes even proportions of crabs in each treatment (Agresti 1990). The 1994 results indicated that seagrass species, depth, or site were influencing crab distribu4 W 4 W tions, but we could not distinguish between these 70-100cm MLW 25-50cm MLW effects since grass species covaried with water depth. In 1995, because of unusually extreme Zostera manna Ruppia maritima summer leaf defoliation, grassbeds were too sparse on the south shore to continue inquiries into the shore effect. Therefore, in 1995, we atFig. 2. Types of grassbeds found in the York River during the study tempted to distinguish effectsof seagrass species period. Samples were taken at shallow and deep depths in monoand depth on juvenile crab distributions and specific grassbeds. Mixed areas, at intermediate depths, were examine ontogenetic changes in habitat use on excluded from sampling the north shore. As described previously, bed Zostera collected in core samples. For wet weights, types were classified into monospecific Zostera beds and RuppialZostera beds (with monospecific Ruppia in above-ground material was separated from roots and the shallows adjacent to monospecific Zostera in deeper rhizomes, and then weighed to the nearest 0.0001 g on water) (Fig. 2). Deep (70 to 100 cm MLW) and shallow an electric balance. Plants were then dried at 75°C for (25 to 50 cm MLW) sites were randomly selected in at least 48 h, and then reweighed to determine dry Zostera beds and in Ruppia/Zostera beds, resulting in weights. Temperature, water depth and salinity were measured for each plant and crab sample. 4 treatments: deep and shallow Zostera beds, and deep and shallow Ruppia/Zostera beds (Fig. 1). The Blue crabs were grouped into 3 size classes: postlarshallow RuppialZostera treatment only contained Rupvae and 1st instars (9.1 mm pia, whereas the remaining 3 treatments only conCW) (Pile et al. 1996). Crabs could not be grouped tained Zostera. Mixed beds were excluded from saminto finer divisions because of low crab densities. The pling. Randomly selected sites were marked with stakes prior to sampling, which was initiated after effect of size class on the odds of settling in Ruppia over Zostera was evaluated using logistic regression peaks in postlarval settlement were detected with plankton samples and settlement substrates (J. van (Agresti 1990). We assumed that within a size class, Montfrans unpubl. data). Four suction samples were each crab was an independent replicate, and binary responses were between Ruppia and Zostera habitats. taken at randomly selected sites in each treatment on The assumption of independence for each crab was each of 3 consecutive days: 8 to 10 October, using a justified by the general lack of aggregation, deter1.67 m2 sampling ring. The ring was deployed next to mined by a goodness-of-fit test to a Poisson series (for the field marker, and the enclosed contents were suctioned for 6 min, followed by 3 rnin of dipnetting. This each crab size class, in July, August and September, in method has an 88% efficiency in crab capture in seaRuppia or Zostera, on the north or south shore) (Elliott 1971). Most areas contained randomly distributed grass beds (Orth & van Montfrans 1987). Before samcrabs according to this test (Q = 0.975, df = 8, 9, or 19, pling crabs, plant biomass cores (0.02 m2) were taken p > 0.05) (Pearson & Hartley 1966).A contagious distriinside each sampling ring to determine above-ground
P
Pardieck et al.: Ontogenetic changes in habitat use by blue crabs
dry weight, shoot density and canopy height of vegetative Ruppia and vegetative Zostera. Sediment cores were taken with all samples and frozen for later analysis. Temperature, salinity, and depth were also recorded. Blue crabs were grouped into 6 size classes for analyses: postlarvae, 1st instars (16.0 mm) (Pile et al. 1996). Samples were analyzed by ANCOVA (dependent variable: crab density; independent variables: bed type and depth; blocked factor: date; covariates: grass dry weight, shoot density, log of shoot density, canopy height, distance upriver). Data were tested for homogeneity of variances and log-transformed when necessary. Linear regressions were conducted when covariates were significant (Zar 1984). Plant dry weight and shoot density were similarly tested as dependent variables by bed type and depth.
RESULTS
80
4
Ruppia maritima Habitat
20u+AL
.
E Fg
0
July
E .-0 loo -
P
P
0
Sepl
Aug
Although sampling grids were established in monospecific stands of the respective seagrass beds, some samples contained small amounts of the other grass species. Also, vegetation in some samples was covered by red algae, e.g. Ceramium spp. (E. Bailey pers. comm.), which was especially difficult to remove from the fine Ruppia shoots. Red algae made up a large proportion of many Ruppia samples. Red algae also grew on Zostera, but was easy to remove. Thus, comparisons of seagrass biomass are made tentatively. Ruppia dry weight averaged 15.3 g m-?. Zostera dry weight averaged 12.2 g m-'. In Ruppia-dominated beds, Ruppia biomass decreased through time on both shores, and Zostera decreased on the south shore. In Zostera-dominated beds, Zostera did not appear to change over time (Fig. 3). Algal biomass was not quantified.
Differential habitat utilization In 1994, on the south shore, all crab stages were evenly distributed between Zostera and Ruppia, with 1 exception (Fig. 4). In August, crabs greater than the 5th instar were significantly more abundant in Ruppia than in Zostera (p c 0.05). On the north shore, all crab stages were significantly more abundant in Ruppia than in Zostera (p c 0.05), except in August, when postlarvae and 1st instars were evenly distributed between Ruppia and Zostera (Fig. 4).
Aug
Sept
Aug
Sept
Zostera marina Habitat
80-
July
Aug
Sept
South Shore
Seagrass and algal composition 1994
23 1
North Shore
Fig. 3. Mean grass dry weights in Ruppia and Zostera habitats on the north and south shores of the York River in 1994. Standard error bars are shown
Seagrass and algal composition 1995 Seagrass dry weight and shoot density varied by bed type and depth (Table 1, Fig. 5). Ruppia dry weight averaged 20.1 g m-' (shallow Ruppia/Zostera), and Zostera dry weight averaged 7.8 g m-? (deep Ruppia/Zostera, deep and shallow Zostera beds). Shoot density averaged 3062 shoots m-? for Ruppia and 220 shoots m-' for Zostera. Grass dry weight was significantly greater in shallow Ruppia beds than in shallow or deep Zostera beds. Grass dry weight also was significantly greater in deep than in shallow Zostera beds. There were significantly more shoots in shallow Ruppia beds than in deep or shallow Zostera beds (Table 2, Fig. 5). There was no noticeable epiphyte growth on vegetation in 1995.
Ontogenetic differences in habitat use Postlarvae through 3rd instars showed similar results by bed type, depth, and distance upriver (Table 3, Figs. 6 & 7). Crab densities averaged 2.0 m-? (postlarvae), 6.8 m-' (1st instars), and 3.4 m-? (2nd to 3rd instars). Postlarvae, 1st instar, and 2nd to 3rd instar abundances did not vary by bed type or depth, and were not influenced by grass dry weight or shoot den-
Mar Ecol Prog Ser 186:227-238, 1999
232
:::7 South Shore
1.0
I
North Shore
July-Sept
,
July-Sept
1.0 7
July
Aug
Sept
Aug-Sept T
I
Aug-Sept
Fig. 4.Comparison of observed crab densities between Ruppia and Zostera on the north or south shore of the York River in 1994. Crabs are evenly distributed between Ruppia and Zostera if standard error bar overlaps line drawn at 0.5.If proportions exceed 0.5,crab densities are higher in Ruppia. If proportions are below 0.5,crab densities are higher in Zostera. *Significant differences between crab densities in Ruppia and Zostera (p c 0.05).When there is no significant change through time, crab proportions are collapsed across time and represented by a single bar
sity (Table 3, Fig. 6). In contrast, abundances of the earliest stages increased significantly with distance upriver (Table 3, Fig. ?), though with high variance. Seagrass species strongly influenced distributions of crabs greater than the 3rd instar, with highest crab abundances in Ruppia habitats (Table 3, Fig. 6). Specifically, 4th to 7th instars were significantly more abundant in shallow Ruppia than in all other habitats (Zostera) (Table 4). In Ruppia/Zostera beds, 8th to 9th instar abundance was significantly higher in shallow Ruppia than in deep Zostera habitats (Table 4). 9th instars and greater were significantly more abundant
in Ruppia/Zostera beds than in monospecific Zostera beds regardless of depth (Table 3), and highest abundances occurred in Ruppia beds. Depth appears to be unimportant in vegetated habitats since it was nonsignificant in monospecific Zostera beds, and only significant in Ruppia/Zostera beds, where it was tied to seagrass species. The covariates grass dry weight, shoot density, logtransformed shoot density, and distance upriver, were nonsignificant for crabs greater than the 3rd instar (Table 3). Although the covariate shoot density was nonsignificant in all tests, late stage crab densities reflect this distinguishing seagrass characteristic (see above). In general, highest abundances of 4th instars and greater occurred in shallow Ruppia beds which had the highest shoot densities. Ruppia shoot densities, which ranged between 700 and 4800 shoots m-2,were correlated with the number of 4th to 7th instars (regression, rZ= 0.303, p = 0.064) (Fig. 8). Shoot density in Zostera beds, which ranged from 50 to 550 shoots m-2, was not significantly related to crab abundance.
DISCUSSION
Habitat use by blue crabs changes ontogenetically in seagrass beds and unvegetated habitats (Orth & van Montfrans 1987).In our study, postlarvae and earliest instar distributions were related to site rather than seagrass species or water depth in shallow habitats (i.e. 0.05)were removed from the models and results are not shown. ' p < 0.05,"p < 0.01,"'p c 0.005,""p c 0.0001;ns: p > 0.05
Postlarvae
1st instars
2nd-3rd instarsa
4th-7th instarsa
8th-9th instarsa
> 9th instarsa
Factor
df
SS
MS
Bed type Depth BxD Date Distance upriver Bed type Depth BxD Date Distance upriver Bed type Depth BxD Date Distance upriver Bed type Depth BxD Date Bed type Depth BxD Date Bed type Depth BxD Date
1 1 1 2 1 1 1 1 2 1 1 1 1 2 1 1 1 1 2 1 1 1 2 1 1 1 2
13.69 10.78 9.57 2.92 61.7 0.14 72.0 8.01 366.4 572.0 0.61 0.13 0.95 1.28 5.26 1.19 1.77 1.5 0.15 0.11 1.08 0.31 0.07 0.56 0.26 0.09 0.29
10.76 9.14 9.72 1.46 60.59 1.39 100.3 0.01 183.2 362.3 0.42 0.44 0.74 0.64 3.52 0.98 0.95 1.39 0.08 0.04 0.73 0.28 0.04 0.57 0.21 0.14 0.15
F 1.09ns 0.93ns 0.99 ns 0.15 ns 6.14' 0.03ns 2.29 ns c0.01 ns 4.18' 8.26" 0.75 ns 0.78 ns 1.31 ns 1.14ns 6.26' 11.92"' 11.50"' 16.90"" 0.91 ns 0.49 ns 8.07 ' 3.12 ns 0.40ns 6.11' 2.23ns 1.53 ns 1.58 ns
'Data were log transformed
One explanation for the lack of microhabitat selection by early instars is cannibalism by larger conspecifics, which are abundant in shallow Ruppia beds. Similarly, in oyster shell habitats, early cohorts of the Dungeness crab Cancer magister reduced the density of subsequent cohorts through cannibalism or competition (Fernandez et al. 1993,Eggleston & Armstrong 1995).Crab density patterns may have also reflected a postlarval pulse moving up the York River: samL
5
121
2nd to 3rd lnstars
Zostera
1 12 i
Greater than 9th lnstars
RuppidZostera Zostera Bed Types
RuppiwZostera
1 Fig. 6. Mean number of crabs by depth and bed type in 1995.In Ruppia/Zostera beds, values are for Ruppia in the shallows and for Zostera in the deeper locations. Standard error b a n are shown. Letters depict significant differences calculated from ANCOVA and Tukey's test (p c 0.05):bars sharing the same letters indicate nonsignificance ,
Pardieck et al.: Ontogenetic changes in habitat use by blue crabs
235
Table 4. Tukey's test for significant interaction effects between depth and bed type in ANCOVA (Table 3). R-Z: Ruppia/Zostera beds; Z-Z: monospecific Zostera beds. To be conservative, we used p < 0.1 as the criterion for performing multiple comparison tests. Parentheses enclose mean densities of each treatment combination. "p < 0.01, ns: p > 0.05
4th-7th instars
8th-9th instars
Category
Factor
Bed type R-Z
Depth
Z-Z
Depth
Depth Shallow
Bed type
Deep
Bed type
Bed type R-Z
Depth
Z-Z
Depth
Depth Shallow
Bed type
Deep
Bed type
Level
Tukey's difference'
Deep (0.33) Deep (0.40)
Shallow (1.12) Shallow (0.41)
Z-Z (0.41) R-Z (0.33)
R-Z (1.12) Z-Z (0.40)
Deep (0.24) Deep (0.35)
Shallow (0.76) Shallow (0.49)
Z-Z (0.49) R-Z (0.24)
R-Z (0.76) Z-Z (0.35)
0.790 0.009 ns
0.711" 0.070 ns
0.267 ns 0.113 ns
'Tested against Do or calculated as Dx = error mean square /(l/n, + lInb)"2' (q),n vanes with treatment (6, 10 or 12), df = 30, q30,o.o~ = 2.89, qso,o ot = 3.89
pling was initiated when high numbers of postlarvae were collected in nighttime plankton samples upriver, where the highest densities of postlarvae through 3rd instars were also caught in suction samples.
Influence of plant species on later instar distributions Abundance of later instars (>3rd instar) did not differ by site along the river axis, but later instars were generally more abundant in Ruppia than Zostera. This distribution was related to seagrass species and not depth, since crabs were evenly distributed between shallow and deep Zostera beds, and may have resulted from habitat selection (Bell & Westoby 1986), differential predation (Pile et al. 1996), or food availability. Predation can play a major role in the abundance of certain instar stages but may be influenced by certain vegetational characteristics (e.g. shoot density) or prey characteristics (e.g. size) (Heck & Thoman 1981, Pile et al. 1996, Schulman 1996).In 1995, Ruppia shoot densities were higher than those of Zostera, and 4th to 7th instar abundances were positively correlated with Ruppia shoot density. Although Pile et al. (1996) showed that 5th to 7th instars gain a relative refuge from predation because of their size, their greater abundance in vegetation may reflect that these are the
instars (i.e. sizes) that are balancing the relative values of vegetational refuge versus size refuge from predation. The relationship between Ruppia beds, shoot density, and the densities of crabs greater than the 7th instar, however, was not as clear. Within Ruppia/ Zostera beds, 8th to 9th instars were more abundant in Ruppia than in Zostera areas. Generally, juveniles greater than the 9th instar were more abundant in Ruppia/Zostera beds than in Zostera beds. However, these crab densities were not significantly related to shoot densities. The relationship between shoot density and crab density may break down when crabs reach the 8th instar, possibly because size-refuge from predation at these instar stages influences survival more than vegetational characteristics (Pile et al. 1996). Ruppia and Zostera shoot densities change seasonally and in response to varying weather conditions (Orth & Moore 1986). The summer of 1995 was unusually hot, with air temperatures above 32°C for over 20 consecutive days prior to sampling. Zostera defoliated considerably during this heat wave. Changes in seagrass density may lead to changes in habitat use by blue crabs: juvenile blue crabs may be more abundant in Zostera beds prior to yearly summer defoliation. In a recent study, blue crab postlarvae settled in higher
Mar Ecol Prog Ser 186: 227-238, 1999
236
First lnstars "E
2
0
b
A
r' = o.ma p c 0.001
A
1
0 1000
2000
3000
4000
0 5000
Ruppia maritirna Shoots I m'
Fig. 8. Correlation between number of 4th to 7th instars and the number of Ruppia shoots in 1995. (A) Individual samples. Linearly transformed regression equation: log(4th to 7th instars) = -0.233 + 0.6521og(shoot number) (regression, ? = Second to Third lnstars
30
12
Upriver
10
8
6
4
I
2
Distance From River Mouth (kilometers)
0
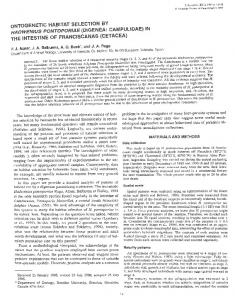
Downriver
Fig. 7. Correlation between distance along the York River and number of postlarvae, first instars, and second to third instars in 1995. (A) Individual samples. Linearly transformed regression equations: (a) postlarvae = 14.73 - 3.471og(distance upriver) (regression, 3 = 0.173, p = 0.004). (b) 1st instars = 47.78 - ll.l4log(distance upriver) (regression, r% 0,308, p < 0.001). (c) Ln(2nd to 3rd instars) = 1.78 - 0.000144(distance upriver) (regression, r2 = 0.231, p = 0.003)
abundances on Spartina alterniflora than on R. maritima or Juncus roemarianus in August; in September, more postlarvae settled on Ruppia (Morgan et al. 1996). Ruppia may be a more important habitat during the late summer after Zostera defoliates. Similarly, vegetation die-back caused an increase in prawn abundance but a decrease in fish abundance in an Australian estuary (Halliday 1995).
Nonsignificance of water depth In contrast to findings with other invertebrates (Ruiz et al. 1993, Platell & Potter 1996), water depth did not determine abundance of any juvenile crab size classes. In this study, the effect of seagrass species may have
overshadowed the effect of depth as a refuge. In a sirnilar study, benthic invertebrates, including the polychaetes Ceratonereis aequisetis and Capitella capitata, and the gastropod Hydrococcus brazieri were significantly more abundant in shallow water (