a scale which is relevant in space and time (Jones. 1988, Mapstone & Fowler ..... and T, lunare were most abundant in the deep habitat zones. Within depth ...
MARINE ECOLOGY PROGRESS SERIES Mar Ecol Prog Ser
1
Published March 28
Spatial, temporal and ontogenetic patterns of habitat use by coral reef fishes (Family Labridae) Alison L. Green* Marine Biology Department, James Cook University of North Queensland, Townsville, Queensland 4812, Australia
ABSTRACT: The continuous reef tract on the semi-exposed side of Lizard Island, northern Great Barrier Reef, can be divided into 6 habitat zones, which are distinctly different in terms of their physical (depth, slope and wave exposure) and biological characteristics (percentage of living cover, percentage cover of each substratum type, substratum diversity and complexity). Sixty-four labrid species were found to use these habitat zones In 5 surveys conducted over 3 yr. Thirty-eight species (1804 individuals) were recorded in a single survey (area, 13500 m2),of which 8 were abundant (n > 5 % of total number of individuals), 6 were common (1% < n < 5 % of total) and 24 were rare (n < 1% of total) Seven of the abundant species showed strong patterns of habitat use, such that the assemblages of these species differed significantly among habitat zones (p < 0.0001). Only 1 abundant species, Labroides dimidiatus, occurred in sinular densities in all habitat zones. Depth appeared to be of overriding importance in determining habitat use, with most species occurring either in shallow or deep zones. Within depth ranges, the labrid assemblages differed among habitat zones in terms of the relative abundance of species. In contrast, no clear relationship was detected between labrid density or diversity and other habitat features such as percentage livlng substratum, substratum diversity or complexity. These patterns were consistent at each of 3 sites separated by > l km and over 3 yr and 2 seasons (summer and winter). Only 2 of the 8 abundant species showed different patterns of habitat use by adults and recruits, suggestlng ontogenetic shifts in habltat use by these species. In contrast, the others showed no evidence of ontogenetic shifts in habitat use, ~ n f e r r ~ nthat g recruitment patterns may be important in structuring patterns of habitat use by these species. Further studies are now required to test this hypothesis. KEY WORDS: Distribution - Abundance . Patterns . Processes - Recruitment . Ontogenetic change . Habitat description . Visual census methods
INTRODUCTION An important goal of reef fish ecology is to determine the processes that a r e important in structuring reef fish assemblages (see Doherty & Williams 1988, Williams 1991). The first step toward understanding these processes is to obtain precise estimates of the distribution and abundance of the assemblages under study, at a scale which is relevant in space and time (Jones 1988, Mapstone & Fowler 1988, Fowler 1990). The intention of this study was to describe the patterns of habitat use by reef fishes, and to examine the
'Present address: Department of Marine and Wildlife Resources, PO Box 3730, Pago Pago, American Samoa 96799 0 Inter-Research 1996
Resale of full article not permitted
processes that may have been important in producing these patterns. Previous studies have demonstrated that reef fishes show discontinuous distributions at a range of broad spatial scales on the Great Barrier Reef (hereafter GBR), from among reefs across the continental shelf (Williams 1982, Williams & Hatcher 1983) to anlong exposures within reefs (Talbot & Goldman 1972, Goldman & Talbot 1976, Eckert 1985). However, little is known of the fine-scale patterns of distribution and abundance of fishes among habitat zones within exposures. The primary objective of this study was to describe temporal and spatial patterns of distribution and abundance of reef fishes among habitat zones. The second objective was to determine if patterns of habitat association at this scale may be related to physical
2
Mar Ecol Prog Ser 133: 1-1 1, 1996
and biological characteristics of the habitats themselves. Processes which establish observed patterns of distribution have been reviewed by Williams (1991), who suggested that adult distributions reflected recruitment events. However, the extent to which recruitment patterns are modified by ontogenetic shifts in habitat is unclear. The third objective of this study was to examine ontogenetic patterns of habitat use by reef fishes, to determine the degree to which adult abundances reflect spatial patterns of recruitment. Wrasses (Family Labridae) were selected for this study because they are a conspicuous and important component of the ichthyofauna on coral reefs throughout the world (Thresher 1991). This is especially true on the GBR, where they are the second most speciesrich family (Randall et al. 1990) and one of the 6 most abundant families by weight (Williams & Hatcher 1983). With one possible exception (Pseudodax moluccanus; G.P. Jones pers. comm.), labnds are exclusively carnivores and represent a dominant group of benthic carnivores on coral reefs (Williams & Hatcher 1983). Thcy include both generalist species which feed G:: a range of invertebrates (e.g. Thalassoma lunare), and specialist feeders such as the cleaner fish Labroides dirnidiatus and those which feed exclusively on coral polyps or mucus (e.g.Labropsis australis and Labrichthyes unilineatus; see Randall et al. 1990). In order to address the objectives of this study, I did a detailed survey of the distribution and abundance of wrasses in a range of habitats, locations and times using visual census techniques. Many types of visual census techniques have been proposed for describing the distribution and abundance of reef fishes (Brock 1954, Jones & Thompson 1978, DeMartini & Roberts 1982, Kimmel1985, Thresher & Gunn 1986),and methods used vary with the aims of the project (Bellwood & Alcala 1988). I used strip transects in this study, because they have been demonstrated to provide good quantitative estimates of the distribution and abundance of many other families of mobile reef fishes, which are diurnally active and conspicuous in both colouration and behaviour (Choat & Bellwood 1985, Fowler 1987, Lincoln Smith 1988, 1989, McCormick 1989). However, since previous studies have demonstrated that the precision of these techniques are dependent on the methods used and the nature of the study species (Sale & Sharp 1983, Fowler 1987, Bellwood & Alcala 1988, Lincoln Smith 1988, 1989), a pilot study was done to determine the methods that were appropriate for censusing adult labrids. In this pilot study, I tested methods which have been described as of bias in past studies' im.pOrtant transect dimensions, observer swimming speed, accuracy of underwater size estimation and experimental
design (Underwood 1981, Sale & Sharp 1983, Bell et al. 1985, Andrew & Mapstone 1987, Fowler 1987, Lincoln Smith 1988, 1989).
MATERIALS AND METHODS
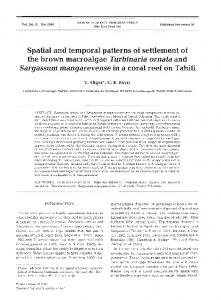
This study was divided into 3 sections: (1) a detailed description of each habitat zone, (2) an outline of the pilot study of visual census techniques, and (3) a description of the spatial and temporal patterns of distribution and abundance of fishes among habitat zones. In this last section, I also examined the degree to which recruitment patterns appeared important in structuring patterns of habitat use, by comparing the distribution and abundance of adults and recruits. Description of study sites and habitat zones. This study was done at 3 sites (separated by 0.5 to 1.5 km) on the fringing reef on the northeastern side of Lizard Island, northern GBR (14" 38' S, 145" 24'E; see Fig. 1). I chose these sites because they were areas of welldeveloped continuous reef tracts where exposure to the prevailing southeast winds and tidal currents was
LULSU) lSLANO
Sand Flat
,,
.
,
~.. -
,
,
,
,8
.. .:,.
- ,, .. *\ .. . -.
.
m
\
,
.
4.' .
N
-,
Fig. 1. Location of study sites at Lizard Island, northern Great Barrier Reef, and the posltion of 6 habitat zones on the reef profile at these sites (see ~nset)
3
Green: Patterns of habit a t use by coral reef f ~ s h e s
Table 1 Phys~calcharacteristics (depth and wave exposure) of 6 habitat zones at 3 study sites Habitat zone
Depth (m)
Wave exposure
Inner reef flat Outer reef flat Crest Reef slope Reef base Sand flat
0.0-1.5 0.0-1.5 0.0-3.0 2.0-20.0 5.0-20.0 6.0-20.0
Low to high Low to high Low to high Low to moderate Nil to low Nil to low
moderate. Reef profile, aspect, exposure and topography of these sites have been described by Choat & Bellwood (1985). The reef at these sites can be divided into 6 recognisable habitat zones, which differ in their position on the reef profile, depth and degree of wave exposure (Fig. 1, Table 1).The inner reef flat is located immediately adjacent to the shore of the island, and is littered with large granite boulders. The crest is defined as the seaward edge of the reef flat where the reef edge drops off into deeper water. The outer reef flat is situated between the inner reef flat and the crest. The reef slope descends a t a slope of 50 to 90" from the crest to the reef base, where it joins the sand flat which stretches away toward open water. The biological characteristics of these zones, which may influence habitat use by labrid fishes, were described in January 1992. To do this I used a modification of the point-basedmethod developed by Wiens & Rotenberry (1981),which provided an estimate of biological substratum characteristics (percentage cover of different substrata and substratum diversity) and surface heterogeneity (substratum complexity). Five 50 m transects were laid consecutively in each of the 6 habitat zones at each site. At fifty 1 m intervals along each transect, a 2 m transect was run perpendicular to the tape. Three points were sampled along each 2 m transect, which yielded 150 sample points per 50 m transect. At each point, the substratum was recorded as belonging to one of 15 categories: non-living (reef matrix, sand and rubble), crevice ( > l m deep), massive coral, digitate coral, plate coral, branching coral, encrusting coral, soft coral, foliaceous coral, free-living coral, gorgonian, hydrozoan, sponge, macroalgae and others (zooanthids, ascidians and clams). The height of the substratum above the reef platform and the number of contacts or 'hits' above the substratum on a vertical line through the object (Wiens & Rotenberry 1981) were also recorded at each point. In combination, these measures enabled me to describe the biological characteristics of each transect. Percentage cover of each substratum category was calculated as the percentage of the points on each transect that were occupied by each substratum category, and substratum
diversity (N,)was calculated as the diversity of cover of substratum categories, using the formula:
where pi is the proportional coverage of the ith substratum category (Wiens & Rotenberry 1981). Substratum structural complexity was calculated as the avera g e number of contacts per 10 cm above the basal substratum. The influence of site (n = 3) and habitat zone (n = 6) on percentage cover of living substratum, substratum diversity and substratum complexity was tested using a 2-way fixed factor analysis of variance for each characteristic. Benthic assemblages were then compared graphically among locations (habitat zones at each site) using a canonical discriminant analysis on the percentage cover of each substratum type. Confidence intervals for centroid means were calculated using the formula: (~~2.0.05
G']
(Seber 1984), and structure coefficients were used to work out angles of contribution for the biplot. Pilot study of visual census methods for fish surveys. Sixteen combinations of transect dimensions (10, 20.30 and 50 m lengths and 1, 2, 3 and 5 m widths) were tested on the crest at Site A (Fig. 1) in August 1990. Five replicate transects of each size were done by counting and estimating the total length of each labrid along the transect, while simultaneously measuring the length (using a 50 m tape) and width (using my known body proportions) of the transect. A standardised swimmlng speed of 60 S per 10 m2 was used, and all individuals