Rodriguez Survey of Software Data Repositories ..................................... 2- ...... operating systems), inste
INSTITUTE FOR DEFENSE ANALYSES
&
Open Source Software Projects Needing Security Investments
David A. Wheeler, Project Leader Samir Khakimov
19 June 2015 Approved for public release; distribution is unlimited.
IDA Document D-5459 v.1.0 Log: H 15-000253 Copy INSTITUTE FOR DEFENSE ANALYSES 4850 Mark Center Drive Alexandria, Virginia 22311-1882
About This Publication This work was conducted by the Institute for Defense Analyses (IDA) under contract N66001-11-C-0001, subcontract D6384-S5, Task GT-5-3329, “Homeland Open Security Technology (HOST),” for Georgia Tech Research Institute and under agreement with The Linux Foundation. The views, opinions, and findings should not be construed as representing the official position of either the Department of Defense or the sponsoring organization. Copyright Notice © 2015 Institute for Defense Analyses 4850 Mark Center Drive, Alexandria, Virginia 22311-1882 • (703) 845-2000. Acknowledgments Clyde G. Roby This material may be reproduced by or for the U.S. Government pursuant to the copyright license under the clause at DFARS 252.227-7013 (a)(16) [Jun 2013].
INSTITUTE FOR DEFENSE ANALYSES
IDA Document D-5459, v. 1.0
Open Source Software Projects Needing Security Investments David A. Wheeler, Project Leader Samir Khakimov
Executive Summary The Heartbleed vulnerability in the open source software (OSS) program OpenSSL was a serious vulnerability with widespread impact. It highlighted that some OSS programs are widely used and depended on and that vulnerabilities in them can have serious ramifications, and yet some OSS programs have not received the level of security analysis appropriate to their importance. Some OSS projects have many participants, perform in-depth security analyses, and produce software that is widely considered to be of high quality and to have strong security. However, other OSS projects have small teams that have limited time to do the tasks necessary for strong security. The Linux Foundation (LF) Core Infrastructure Initiative (CII) is trying to identify OSS projects that need special focus/help for security so that it can best identify OSS projects needing investment. Similarly, the Department of Homeland Security Homeland Open Security Technology (DHS HOST) program’s goal is to “help facilitate the continued adoption of open technology solutions (including OSS)…to improve system security….” They have asked the Institute for Defense Analyses to identify and collect metrics to help identify OSS projects that may especially need investment for security. We have focused on gathering metrics automatically, especially those that suggest less active projects. We also estimated the program’s exposure to attack. We developed a scoring system to heuristically combine these automatically gathered metrics with the exposure estimate. This scoring system identified especially plausible candidates. We took those candidates, examined their data further, and then identified a subset of candidates that we believe are especially concerning. We did not specifically examine the security of the projects themselves. The initial set of projects we examined was the set of software packages installed by Debian base (which are very widely used) combined with other packages that we or others identified as potentially concerning; we could easily add more projects to consider in the future. This document provides information captured as part of our process to help identify open source software (OSS) projects that may need investment for security. It captures a brief literature search of ways to try to measure this and then describes the results we have captured so far. This document is released under the Creative Commons Attribution 4.0 International (CC BY 4.0) license. The supporting software (in Python) for capturing data is released under the Massachusetts institute of Technology (MIT) license. Some supporting data was
i
sourced from the Black Duck Open HUB (formerly Ohloh), a free online community resource for discovering, evaluating, tracking, and comparing open source code and projects.
ii
Contents 1. 2.
Introduction ............................................................................................................. 1-1 Some Past and Current Efforts to Identify Relevant OSS Project Metrics ............. 2-1 A. OSS Metrics Data Sources .............................................................................. 2-1 1. Black Duck Open Hub .............................................................................. 2-2 2. OSS Repository Statistics (GitHub, SourceForge, git, etc.) ...................... 2-3 3. Linux Distribution Repositories ................................................................ 2-3 4. FLOSSmole ............................................................................................... 2-4 5. FLOSSMetrics Project .............................................................................. 2-4 6. FLOSS Community Metrics Meeting ....................................................... 2-4 7. Rodriguez Survey of Software Data Repositories ..................................... 2-6 8. PROMISE .................................................................................................. 2-7 B. Methods for Evaluating OSS Projects ............................................................. 2-7 1. Stol and Babar ........................................................................................... 2-7 2. QualiPSo OpenSource Maturity Model (OMM) ....................................... 2-8 3. QSOS ......................................................................................................... 2-9 4. SQO-OSS / Spinellis, et al ........................................................................ 2-9 5. Ghapanchi’s Taxonomy for Measuring OSS Project Success ................ 2-12 6. Wheeler OSS Evaluation Model ............................................................. 2-14 7. Doomed to FAIL Index ........................................................................... 2-15 8. Internet Success ....................................................................................... 2-16 C. Specific Potentially Useful Security Metrics ................................................ 2-19 1. In-Depth Static Analysis Security Tools (e.g., Coverity Scan) ............... 2-19 2. Lexically Scanning Static Analysis Security Tools (e.g., flawfinder and RATS) ..................................................................................................... 2-20 3. Wikipedia Article on OSS Security......................................................... 2-20 4. Common Vulnerabilities and Exposures Count ...................................... 2-21 5. Schryen and Kadura ................................................................................ 2-21 6. “Look at the Numbers” – Wheeler .......................................................... 2-23 7. Presence of Security Test Suite ............................................................... 2-25 8. Presence/Absence of Past Security Reviews ........................................... 2-25 D. Specific Potentially Useful General Metrics ................................................. 2-25 1. Software Quality Metric Measurement Tools ......................................... 2-26 2. Compiler Warning Flags and Style Checkers ......................................... 2-26 3. Senior Defect Prediction Measures – McCabe (Cyclomatic complexity) and Halstead ............................................................................................ 2-26 4. Test Coverage .......................................................................................... 2-27 5. Source Lines of Code .............................................................................. 2-27 6. Lincke Survey.......................................................................................... 2-27 7. Estimating Commit Sizes Efficiently – Hoffmann and Riehle ............... 2-28 iii
3.
4.
5.
6.
7.
8. Choosing Software Metrics – Gao .......................................................... 2-29 9. Assessing Predictors of Software Defects – Menzies ............................. 2-29 10. How Many Software Metrics for Defect Prediction? – Wang ................ 2-29 11. Software Defect Prediction – Punitha ..................................................... 2-30 12. COQUALMO .......................................................................................... 2-30 13. DoD/Industry 1994 Survey ..................................................................... 2-31 E. Attack Surface Measurement ........................................................................ 2-31 F. Kenn White Metrics Set ................................................................................ 2-32 G. IDA Ideas ...................................................................................................... 2-33 1. Exposure to Attack .................................................................................. 2-33 2. Other Work .............................................................................................. 2-34 H. London January 2015 Meeting ...................................................................... 2-35 I. Additional Areas for Review ......................................................................... 2-37 J. Comments on Metrics ................................................................................... 2-37 Important OSS Projects ........................................................................................... 3-1 A. Common in Distributions ................................................................................ 3-1 B. Linux Foundation Original List ....................................................................... 3-2 C. Kenn White List .............................................................................................. 3-3 D. Google Application Security Patch Reward Program ..................................... 3-4 E. Recent Problem Reports .................................................................................. 3-5 F. Augmented List of Programs .......................................................................... 3-5 Selected Approach and Early Results...................................................................... 4-1 A. Overall Approach ............................................................................................ 4-1 B. Caveats ............................................................................................................ 4-1 C. First Stage ........................................................................................................ 4-2 D. Second Stage ................................................................................................... 4-4 Current Process ........................................................................................................ 5-1 A. Current Simplified Approach .......................................................................... 5-1 B. Risk Index........................................................................................................ 5-2 Current Process Results ........................................................................................... 6-1 A. Riskiest OSS Programs (straight from scores) ................................................ 6-1 B. Riskiest OSS Programs (estimated by us) ....................................................... 6-2 C. Potential Improvements to Other Sites to Improve Data ................................ 6-8 Conclusions ............................................................................................................. 7-1
References ........................................................................................................................R-1 Acronyms ..................................................................................................................... AA-1
iv
Figures and Tables Figure 1. The SQO-OSS Quality Model ........................................................................ 2-10 Figure 2. Analysis Process, Stage 2 ................................................................................. 4-5 Figure 3. Analysis Process, Current Stage ....................................................................... 5-1 Table 1. Metrics used by the SQO-OSS Quality Mode ................................................. 2-10 Table 2. Practical List of OSS Metrics .......................................................................... 2-13 Table 3. Riskiest OSS Programs (straight from scores) .................................................. 6-1 Table 4. Riskiest OSS Programs (human-identified subset informed by risk measures) 6-3
v
1.
Introduction
The Heartbleed vulnerability in the open source software (OSS) program OpenSSL was a serious vulnerability with widespread impact. Yet there are many ways that Heartbleed could have been detected before it was deployed [Wheeler2014h]. The Heartbleed vulnerability highlighted that the vulnerabilities in some widely used and depended-upon OSS programs can have serious ramifications, and yet they have not received the level of security analysis appropriate to their importance. Some OSS projects have many participants, perform in-depth security analyses, and produce software that is widely considered to be of high quality and to have strong security. However, other OSS projects have small teams that have limited time to do the tasks necessary for strong security (e.g., the OpenSSL project before Heartbleed). The Linux Foundation (LF) Core Infrastructure Initiative (CII) was established to “fund open source projects that are in the critical path for core computing functions [and] are experiencing under-investment.”1 The LF CII will make final decisions on what it will invest in, but it has asked for help in identifying appropriate metrics and their values. The HOST program’s goal, as stated in the statement of work between the Institute for Defense Analyses (IDA) and the Georgia Tech Research Institute (GTRI), is to “help facilitate the continued adoption of open technology solutions (including OSS) within federal, state, and municipal public sector [information technology] IT environments in order to improve system security….” The program has asked IDA to “provide continued subject matter expertise on in-depth research, studies, and analysis on the research domain” for HOST. The HOST project is in turn funded by the Department of Homeland Security (DHS). This is in support of securing the nation—Executive Order 13636 states that, “It is the policy of the United States to enhance the security and resilience of the Nation’s critical infrastructure and to maintain a cyber environment that encourages efficiency, innovation, and economic prosperity while promoting safety, security, business confidentiality, privacy, and civil liberties” [Obama2013]. Thus, identifying OSS projects that need help is also in the interest of the HOST project.
1
http://www.linuxfoundation.org/programs/core-infrastructure-initiative
1-1
Other organizations and projects might be interested in this work as well. For example:
The “Snowdrift coop” (at https://snowdrift.coop/) was established in late 2014 to create “a matching patronage system funding freely-licensed works” and in the future might be interested in funding work to improve the security of OSS projects.
The “European Parliament has approved funding for several projects related to Free Software and privacy. In the EU budget for 2015, which the European Parliament adopted on December 17, the Parliamentarians have allocated up to one million Euro for a project to audit Free Software programs in use at the Commission and the Parliament in order to identify and fix security vulnerabilities,” https://fsfe.org/news/2014/news-20141219-01.en.html.
The “Google Application Security Patch Reward Program” rewards proactive security improvements in selected open-source projects. See https://www.google.com/about/appsecurity/patch-rewards/.
The Linux Foundation and HOST have asked us to identify and collect metrics to help identify OSS projects that may especially need investment for security. The goal of this work was to perform a relatively quick reaction study to gather data to help make reasonable decisions in a short time. Further work might identify significantly improved measures and additional projects to be examined, but it was judged to be better to do a quick study with limited time (and document it) than to simply guess or to spend a long time on a more comprehensive study. We began this work by surveying past and current efforts to identify relevant OSS project metrics (summarized in this document). We also identified various ways to identify which OSS projects might be considered especially important. We then selected an automated approach for gathering relevant metrics for a candidate set of important OSS projects, created a prototype, and then refined the prototype after examining its early results. During this process we participated in a 2015 London conference, where we shared our early results and received helpful feedback (including references to better data sources). We have focused on metrics that we can gather automatically that suggest less active projects. We also estimated the program’s exposure to attack. We have developed a scoring system to heuristically combine these automatically gathered metrics with our estimate of attack exposure. These heuristics identified especially plausible candidates. We then examined those candidates further and identified a subset that we believe are especially concerning. The initial set of projects we examined was the set of software
1-2
packages2 installed by Debian base, to which we added packages that we or others identified as potentially concerning; we could easily add more projects to consider in the future. This document uses the term “open source software” (OSS) for software that can be studied, used for any purpose, modified, and redistributed (modified or not). Other terms for such software including “Free software” (note the capital letter) and “Free/libre/open source software” (FLOSS). See the Open Source Definition [OSI] and the Free Software Definition [FSF] for details. In some cases the users of these different terms emphasize different motivations and purposes, but since we are simply focused on the software resulting from these efforts (instead of the motivations for development), we will ignore those distinctions in this paper. We use “proprietary software” and “closed software” as antonyms for OSS. Note that “in almost all cases, OSS meets the definition of ‘commercial computer software’” under U.S. law [DoD2009] and that many OSS programs are codeveloped and supported by commercial companies. Per agreement by both GTRI and the Linux Foundation, this document is released under the Creative Commons Attribution 4.0 International (CC BY 4.0) license; the supporting software (in Python) for capturing data is released under the Massachusetts Institute of Technology (MIT) license. Thus, they are both “Free Cultural Works” as defined by freedomdefined.org. Chapter 2 lists past work, identifying relevant ways to measure OSS projects. Chapter 3 is a list of especially promising metrics, based on Chapter 2, for measuring OSS projects’ need for security investment. Chapter 4 identifies important OSS projects that are widely used yet might need investment. We are developing software to capture and combine this data into a separate spreadsheet for developing recommendations based on this document.
2
A software package is a unit of software that can be easily installed, updated, and uninstalled using a tool called a “package manager.” Packages include dependency information, making it possible to automatically install other packages a given package depends on. Common package formats include the .deb format (used by Debian and Ubuntu) and the .rpm format (used by Red Hat Enterprise Linux and Fedora).
1-3
2.
Some Past and Current Efforts to Identify Relevant OSS Project Metrics
This chapter describes a brief survey (literature search) of some past efforts to identify relevant metrics of OSS projects. Our goal was to help identify metrics that might help identify projects needing investment. Measuring the security of software is a notoriously difficult and an essentially unsolved problem. Ideally we would identify metrics that directly determine whether or not an OSS project is producing secure software. However, since perfect metrics are not available, we are instead interested in metrics that provide some evidence that a project’s product is more or less likely to be secure. Some product measures, for example, may suggest that the software has fewer security defects, or at least fewer defects in general. Other metrics examine the OSS project (including its processes) and may suggest that an OSS project is in trouble (e.g., it is relatively inactive, has few active contributors, or that much development was done long ago (when fewer developers knew how to develop secure software)). For example, it is often noted that before Heartbleed, OpenSSL had relatively few developers and that many bug reports languished without response for long periods of time. These indicators may suggest that a project needs investment to make its software adequately secure. Sources include surveys of OSS, existing evaluation processes for evaluating OSS, surveys of quality or security metrics (e.g., [Shaikh2009]), and organizations that track OSS metrics. There was not time to do a complete survey, but we believe it is better to do a brief survey (and document it) than ignore the large set of materials available. These materials are probably not equally useful or credible; the goal was simply to survey various options to reduce the risk of overlooking especially useful sources of information. Some odd or improbable approaches might suggest a new and useful approach.
A. OSS Metrics Data Sources It is much easier to get data from organizations that measure and curate it than to try to extract it for each program separately. There is also the hope that such organizations will try to select useful measures. Black Duck Open Hub (formerly Ohloh), in particular, provides relatively current data for many programs in an easily obtained form.
2-1
1.
Black Duck Open Hub
Black Duck Open Hub, formerly Ohloh, maintains an active set of metrics data for a variety of OSS projects at https://www.openhub.net, along with a nice user interface (UI) for viewing them. Looking at a sample project entry, such as Firefox, helps give a sense of what is recorded for a project. The entry for Firefox (https://www.openhub.net/p/firefox) in December 2014 reports: “In a Nutshell, Mozilla Firefox...
has had 223,200 commits made by 3,187 contributors representing 12,554,058 lines of code.
is mostly written in C++ with a low number of source code comments [as a percentage compared to other programs in the same programming language].
has a well established, mature codebase maintained by a very large development team with increasing year-over-year (Y-O-Y) commits.
took an estimated 3,920 years of effort (COCOMO model) starting with its first commit in April, 2002, and ending with its most recent commit 26 days ago.”
It reports, for both 30-day and 12-month periods, the number of commits and the number of contributors (including a separate number for new contributors). For the 12month period it also reports the change from the previous 12-month period. It includes user ratings. It also provides “quick reference” information (such as the organization name), some of which can also indicate the health of a project:
Link(s) for Homepage, Documentation, Download, Forums, Issue Trackers, and Code: Where present, these are signs of an active project.
Licenses: OSI- and FSF-approved licenses, especially if they are common, are a good sign because unusual licenses can inhibit contribution.
This is a well-maintained site with programmatic interfaces that make it easy to access the data they collect. The programmatic interfaces in some cases have only general statements (e.g., “mature codebase” or “very large development team”) instead of specific numbers, but these general statements can still be valuable. A (gratis) key must be acquired for programmatic queries, and the website states that queries are limited to 1,000 queries/day for each key (although this might not be enforced). We cached results to avoid creating a nuisance. However, they also impose other conditions, so we arranged a special exception with Black Duck for use in this project.
2-2
2.
OSS Repository Statistics (GitHub, SourceForge, git, etc.)
Many OSS projects are hosted on a relatively few number of hosting sites that can also report a variety of statistics. If the repository (also called a “repo”) directly provides that data, then the data is especially easy to get for such projects. GitHub provides a variety of statistics and charts, particularly ones focused on project activity. Selecting “pulse” on a project’s project site accesses reports for a selected time period on the number of (direct) authors, commits, files, and number of additions and deletions (counted by lines). You can also select “graphs” to see a variety of graphs. The issue tracker can report the number of open and closed issues. More information is available via https://developer.github.com/v3/repos/statistics/ for programs that need this data. SourceForge has switched to the OSS Allura software for repository management. Its command “Tickets/View Stats” reports a variety of statistics, including number of tickets (total, open, closed), number of new tickets over various periods (7 days, 14 days, 30 days), number of comments on tickets, and number of new comments on tickets over a given period. They also support a Representational State Transfer (REST) application programming interface (API) for obtaining this information for programs (most of its data is returned in JSON format); more information is at https://sourceforge.net/p/forge/d ocumentation/Allura%20API/. Distributed version control software, including git, includes a significant amount of metadata about commits because the project history is downloaded. Tools such as gitstats (http://gitstats.sourceforge.net/) can be used to quickly analyze this data and report additional information. Gitstats, for example, will report:
3.
General statistics: total files, lines, commits, authors
Activity: commits by hour of day, day of week, hour of week, month of year, year and month, and year
Authors: list of authors (name, commits (%), first commit date, last commit date, age), author of month, author of year
Files: file count by date, extensions
Lines: Lines of Code by date. Linux Distribution Repositories
Most Linux distributions (such as Debian, Ubuntu, Fedora, and Red Hat Enterprise Linux) use package managers to install (and uninstall) packages. These packages include metadata with important information, such as the software name, dependencies, and URL of the originating project. Additionally, if a package is installed in a distribution’s base or a widely used group/task, it is likely to be widely used. Some distributions (such as Fedora) 2-3
work to split up projects so that if software from another project is reused, the projects are kept separate (so that security updates will properly update everything); this can help reveal important projects that might otherwise be hidden inside larger projects. 4.
FLOSSmole
FLOSSmole at http://flossmole.org/ performs “collaborative collection and analysis of free/libre/open source project data” (per its front page). It is related to FLOSShub, a “portal for free/libre and open source software (FLOSS) research resources and discussion.” It appears semi-active, with some datasets and various reports dated 2014. However, some data is only available through 2013. One challenge for them is that repositories are increasingly providing this information directly. 5.
FLOSSMetrics Project
FLOSSMetrics stands for “Free/Libre Open Source Software Metrics” and is at http://www.flossmetrics.org/. The main objective of FLOSSMETRICS is, per its website, “to construct, publish and analyse a large scale database with information and metrics about libre software development coming from several thousands of software projects, using existing methodologies, and tools already developed.” It records various data for a variety of projects, for example:
How many bugs are reported
The average time it takes to fix a bug in a project’s lifetime.
There was a “final report” in 2010 for this European project, and no obvious activity since then. Its database of projects at http://melquiades.flossmetrics.org/projects seems to have had little activity since 2010. Thus, this is likely to be no longer active. Active similar projects include FLOSSmole and Black Duck Open Hub. 6.
FLOSS Community Metrics Meeting
The “FLOSS Community Metrics” meeting is a conference of those interested in collecting and analyzing OSS metrics, sponsored by Bitergia. Its website is at http://flosscommunitymetrics.org/; they had a conference in July 2014 and another is expected in 2015. The 2014 conference had several presentations on measuring OSS quality, which are summarized below (clicking on the “slides” link on its website provides the slides described below). Roberto Galoppini’s presentation, “You’re not entitled to your opinion about open source software!” proposed the following simple-to-collect metrics: 2-4
Code Maturity [ 3 years]
Code stability (unstable, stable but old, stable and maintained)
Project popularity (unknown, small but growing, well known)
Case study availability
Books availability
Community management style
Team size [1-5 members, 5–10 members, > 10 members]—can be found by analyzing commits
Commercial support
Training
Documentation
QA Process [n/a, existing but not supported by tools, supported by tools]
QA tools [n/a, existing but not much used, very active use of tools]
Bugs reactivity [poor, formalized but not reactive, formalized and reactive]
Source [to be compiled, binaries available, virtual appliance available]
Red Hat/Solaris/Windows
Amount of comments [none, poorly commented, well commented]
Computer language used [more than 3 languages used, 1 language primarily, 1 unique language]
Code modularity [not modular, modular, available tools to create extensions]
License
Modifiability [no way to propose modification, tools to access and modify code available but the process is not well defined, tools and procedures to propose modifications available.]
Roadmap [n/a, no detailed roadmap available, detailed roadmap available]
Sponsor.
James Faulkner (Liferay community manager) presented “Metrics are fun, but which ones really matter?”; this presentation lists various metrics and identified those he thought were “more interesting”:
Time of bug report to fix
Time from forum question to answer
2-5
Number of ignored contributions
Time from contribution to insertion in codebase.
He also lists “basic” metrics such as number of contributions, number of commits/lines, number of authors, number of bug reports, number of forum posts/answers, number of downloads, number of ignored messages, and number of open tickets/code reviews. The conference proceedings also noted vizGrimoire, an OSS toolset and framework to analyze and visualize data about software development, available at http://vizgrimoire.bitergia.org/ promoted by Bitergia. 7.
Rodriguez Survey of Software Data Repositories
Rodriguez et al’s “On Software Engineering Repositories and their Open Problems” describes various sources of data about software [Rodriguez2012]. They identified the following set:
FLOSSMole: http://flossmole.org/
FLOSSMetrics: http://flossmetrics.org/
PROMISE (PRedictOr Models In Software Engineering): http://promisedata.org/
Qualitas Corpus (QC): http://qualitascorpus.com/
Sourcerer Project: http://sourcerer.ics.uci.edu/
Ultimate Debian Database (UDD): http://udd.debian.org/
Bug Prediction Dataset (BPD): http://bug.inf.usi.ch/
International Software Benchmarking Standards Group (ISBSG): http://www.isbsg.org/
Eclipse Bug Data (EBD) http://www.st.cs.uni-saarland.de/softevo/bugdata/eclipse/Software-artifact
Infrastructure Repository (SIR): http://sir.unl.edu/
Ohloh: http://www.ohloh.net/
SourceForge Research Data Archive (SRDA): http://zerlot.cse.nd.edu/
Helix Data Set: http://www.ict.swin.edu.au/research/projects/helix/
Tukutuku: http://www.metriq.biz/tukutuku/.
2-6
8.
PROMISE
PROMISE stands for “PRedictOr Models In Software Engineering”; its main website is http://promisedata.org/ but its dataset is at http://openscience.us/repo/. This is a collection of data “real world software engineering projects…whatever data is available.” This is useful for tasks such as research into predictive metrics. However, it is a collection of available real-world data, not primarily current real-world data, and by itself, it does not identify metrics that are necessarily relevant (just what it can provide). The PROMISE 2014 (“PROMISE ’14”) conference included various presentations, including a keynote by Audris Mockus (at http://mockus.org/papers/promise1.pdf) on the problems of acquiring data and prediction.
B. Methods for Evaluating OSS Projects A number of complete processes are specifically for evaluating OSS (as software, a project, or both)—typically for a particular purpose, and not their security per se, but some of their approaches may also be useful for our purposes. Wikipedia includes a comparison of a few of these processes for evaluating OSS.3 For our purposes, a key attribute is whether or not the OSS evaluation process supports comparison between different OSS programs. Since there are limits to how much can be invested, it is important to be able to determine which projects most need investment; this means that there must be a way to compare the OSS projects. The Open Source Maturity Model (OSMM) from Capgemini and Qualification and Selection of Open Source software (QSOS), for example, do support comparison. The Open Business Readiness Rating (OpenBRR) project, announced in 2005, did not create a community. Its website http://www.openbrr.org/ claims to be preparing an update; since that has not yet occurred, we do not consider it here. Some documents and books, such as [Fogel2013], provide guidance on how to develop open source software. These could be used to evaluate OSS projects by determining how well the guidance is followed. We did not pursue this due to lack of time. 1.
Stol and Babar
There are so many processes for evaluating OSS that Stol and Babar have published a framework comparing them. http://staff.lero.ie/stol/files/2011/12/OSS2010.pdf. One complication is that several methods are all named “Open Source Maturity Model.”
3
http://en.wikipedia.org/w/index.php?title=Opensource_software_assessment_methodologies&oldid=579922098
2-7
2.
QualiPSo OpenSource Maturity Model (OMM)
The QualiPSo OpenSource Maturity Model (OMM) is a methodology for assessing Free/Libre Open Source Software (FLOSS) and more specifically the FLOSS development process. This methodology was released in 2008 and is released under the Creative Commons license. The summary, at http://en.wikipedia.org/wiki/OpenSource_Maturity_Model, defines three maturity levels: basic, intermediate, and advanced. The basic-level requirements are:
PDOC – Product Documentation
STD – Use of Established and Widespread Standards
QTP – Quality of Test Plan
LCS – Licenses
ENV – Technical Environment
DFCT – Number of Commits and Bug Reports
MST – Maintainability and Stability
CM – Configuration Management
PP1 – Project Planning Part 1
REQM – Requirements Management
RDMP1 – Availability and Use of a (product) roadmap. The intermediate-level requirements are:
RDMP2 – Availability and Use of a (product) roadmap
STK – Relationship between Stakeholders
PP2 – Project Planning Part 2
PMC – Project Monitoring and Control
TST1 – Test Part 1
DSN1 – Design Part 1
PPQA – Process and Product Quality Assurance. The advanced-level requirements are:
PI – Product Integration
RSKM – Risk Management
TST2 – Test Part 2 2-8
DSN2 – Design 2
RASM – Results of third party assessment
REP – Reputation
CONT – Contribution to FLOSS Product from SW Companies.
Unfortunately, we have had trouble accessing http://www.qualipso.org/ for more information. 3.
QSOS
Qualification and Selection of Open Source Software (QSOS) dates from 2004; QSOS 2.0 was released June 2013. It is a “free project aiming to mutualize and capitalize technological watch on open source components and projects”; its main page is http://www.qsos.org. The method is distributed under the GNU Free Documentation License. Its goal is to provide a “formal process to evaluate, compare and select open source solutions.” QSOS is a Drakkr project (http://www.drakkr.org); others include FLOSC (Free/Libre Open Source Complexity), a project providing method and tools to evaluate the intrinsic complexity of open source components. Some information is available on GitHub https://github.com/drakkr/drakkr. Unfortunately the site http://master.o3s.qsos.org/ was down when we started this work, and when it finally resurfaced it was in French, so we have not delved into it further at this time. 4.
SQO-OSS / Spinellis, et al
“Evaluating the Quality of Open Source Software” [Spinellis2009] presents “motivating examples, tools, and techniques that can be used to evaluate the quality of open source… software.” It includes a “technical and research overview of [Software Quality Observatory for Open Source Software (SQO-OSS)], a cooperative research effort aiming to establish a software quality observatory for open source software.” The paper notes the following metrics:
Use of various scanning tools including PMD (Java scanner), FindBugs (for Java), Checkstyle (Java style checker), Sonar, ESX (for C++), and Scan by Coverity
Use of metric suites such as Ohloh and Sourcekibitzer (the latter is for Java)
Adherence to claimed coding style as a proxy for quality (They formatted FreeBSD code using indent and computed the number of lines that changed.)
2-9
Mean developer engagement (MDE), the average percentage of active developers who work on a project each week (Developers who stay inactive are eventually considered no longer part of the total.)
Cross-language metric tool, which collects metrics such as number of public attributes, number of children, etc.
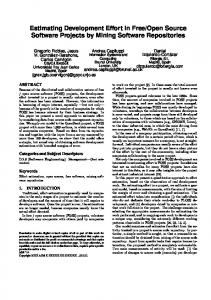
Metric for developer contributions. This adds measures for not just lines of code, but also for bug closing, documentation files, updating a wiki page, etc. Some measures are difficult to measure using only automated tools (e.g., “participate in a flamewar”). It notes the SQO-OSS quality model shown in Figure 1.
Figure 1. The SQO-OSS Quality Model
And, it uses the metrics shown in Table 1 to estimate them. Table 1. Metrics used by the SQO-OSS Quality Mode Attribute Analyzability
Metric Cyclomatic number Number of statements Comments frequency Average size of statements Weighted methods per class ( WMC)
2-10
Attribute
Metric Number of base classes Class comments frequency
Changeability
Average size of statements Vocabulary frequency Number of unconditional jumps Number of nested levels Coupling between objects (CBO) Lack of cohesion (LCOM) Depth of inheritance tree (DIT)
Stability
Number of unconditional jumps Number of entry nodes Number of exit nodes Directly called components Number of children (NOC) Coupling between objects (CBO) Depth of inheritance tree (DIT)
Testability
Number of exits of conditional structs Cyclomatic number Number of nested levels Number of unconditional jumps Response for a class (RFC) Average cyclomatic complexity per method Number of children (NOC)
Maturity
Number of open critical bugs in the last 6 months Number of open bugs in the last 6 months
Effectiveness
Number of critical bugs fixed in the last 6 months Number of bugs fixed in the last 6 months
Security
Null dereferences Undefined values
Mailing list
Number of unique subscribers Number of messages in user/support list per month Number of messages in developers list per month Average thread depth
Documentation
Available documentation documents Update frequency
Developer base
Rate of developer intake
2-11
Attribute
Metric Rate of developer turnover Growth in active developers Quality of individual developers
The authors rank various projects by comparing values to ideal values, (e.g., the ideal candidate for the Excellent Analyzability quality attribute should have a McCabe Cyclomatic number equal to 4, an average function’s number of statements equal to 10, a comments frequency equal to 0.5, and average “size of statements” equal to 2). 5.
Ghapanchi’s Taxonomy for Measuring OSS Project Success
Ghapanchi et al’s “A taxonomy for measuring the success of open source software projects” [Ghapanchi2011] used a literature survey focused on measuring OSS project success. After identifying 154 publications in their initial set, they narrowed it down to 45 publications and categorized them into meaningful clusters. They identified six broad areas that can lead to success: 1. Product quality. Different researchers have proposed many different measures for product quality (leading to product success). They report that [Crowston2003] is among the most cited; this is a content analysis of an online focus group that reported seven main themes for OSS success: user, product, process, developers, use, recognition, and influence. 2. Project performance: These combine efficiency and effectiveness. 3. Project effectiveness: These attempt to measure “getting the right things done.” 4. Project efficiency: These determine the extent to which a project uses its resources to generate outcomes, typically using Data Envelopment Analysis (DEA). The goal is to determine Output/Input. Examples of input/output pairs are {number of developers, bug submitters}/{KiB per download, number of downloads, project rank}; {number of downloads, number of years}/{product size in bytes, number of code lines}; {product size (bytes), development status}/ {number of developers, product age}. 5. Project activity: This is “frequently regarded as one of the pillars of OSS project success.” Examples include how frequently defects are fixed, new releases of the software are posted, or support requests are answered, often over a period of time. 6. User interest: The ability of an OSS project to attract community members to adopt the software (its popularity).
2-12
They note that “success” can be measured for both the product and the project, so they then map these areas to these kinds of success. User interest affects both product success and project success. They map product quality to primarily product success, and map project activity, project efficiency, and project effectiveness to project success. Project effectiveness and project efficiency themselves affect project performance. Based on this survey, they provide a “practical list of OSS success metrics,” see Table 2. Table 2. Practical List of OSS Metrics ASPECT
USEFUL MEASURES ACCORDING TO [GHAPANCHI2011]
User interest
Traffic on the project Web site, downloads of the code, number of developers who have joined the project team, and the number of people who have registered on the project mailing list to receive announcements such as new release regarding a project
Project activity
The number of software releases, number of patches, number of source code lines, number of code commits
Project effectiveness
The percentage of task completion (bug fix, feature request, and support request), number of developers the project has attracted, number of work weeks spent on the project
Project efficiency
Using a DEA model with one or some input indicators (e.g., number of developers, number of bug submitters, number of years, product size (bytes), development status) and one or some output indicators (e.g., kilobytes per download, number of download, project rank, product size in bytes, number of code lines)
Product quality
Code quality, documentation quality, understandability, consistency, maintainability, program efficiency, testability, completeness, conciseness, usability, portability, functionality, reliability, structuredness, meeting the requirements, ease of use, user friendliness
Source: Ghapanchi 2011
They make the interesting observation that the kinds of data available for OSS are typically different than for proprietary software. “Traditional [closed source] software development success models frequently focus on success indicators such as system quality, use, user satisfaction and organizational impacts [that are] more related to the ‘use environment’ of the software, while studies on OSS success tend to look more at the ‘development environment’… [in traditional models] ‘development environment is not publicly available but the ‘use environment is less difficult to study, while in OSS the ‘development environment’ is publicly visible but the ‘use environment’ is hard to study or even to identify.” One challenge for us is that we are interested primarily in projects that are successful in terms of widespread adoption and satisfaction of functional requirements, yet have
2-13
serious vulnerabilities. These measures do not necessarily directly relate to our question, but they can perhaps help suggest projects that are not adequately active. 6.
Wheeler OSS Evaluation Model
David A. Wheeler (also an author of this paper) previously described a general process for evaluating open source software in “How to Evaluate Open Source Software/Free Software (OSS/FS) Programs.” [Wheeler2011e]. This process is based on four steps: identify candidates, read existing reviews, compare the leading programs’ basic attributes to your needs, and analyze the top candidates in more depth. This set of identify, read reviews, compare, and analyze can be abbreviated as “IRCA.” Important attributes to consider include functionality, cost, market share, support, maintenance, reliability, performance, scaleability, useability, security, flexibility/customizability, interoperability, and legal/license issues. The section on security mentions the following metrics:
Coverity scan results, including the rung achieved, number of defects, and defect density
Fortify scan results (similar)
Common criteria evaluation (These typically evaluate entire systems (e.g., entire operating systems), instead of focusing on specific projects that support a particular portion of an operating system, and thus do not provide the kinds of measures desired for this task.)
Reports of (many) vulnerabilities that are “unforgiveable” (MITRE identifies criteria for identifying vulnerabilities that are especially easy to find, and thus “unforgiveable” [Christey2007].)
Whether or not at least one external organization is known to have reviewed or be reviewing the software. However, some organizations that review software (such as OpenBSD) may choose to make changes to only their version and not necessarily report or try to get their changes back into the upstream project. In these cases, the version they review may not be the version all other systems use.
It also notes that experts can be hired to determine whether the developers follow good security practices when developing the software. Signs that good security practices are being followed could include the following:
The program’s design minimizes privileges (e.g., only small portions of the program have special privileges or the program has special privileges only at certain times).
The developers strive for simplicity (simpler designs are often more secure).
2-14
The program checks inputs with rigorous whitelists (a “whitelist” defines what is legal input; all other input is rejected).
Source code scanning tools report few problems when applied to the program. The section on reliability notes the following metrics:
Self-reported status (e.g., “mature”)
Presence of an automated (regression) test suite.
7.
Doomed to FAIL Index
Tom “spot” Callaway, Fedora Engineering Manager at Red Hat, posted “How to tell if a FLOSS project is doomed to FAIL (or at least, held back...)” in 2009.4 The handbook The Open Source Way includes a chapter with an updated version of this index and is available online [Callaway]. This index is intended to be a quick measure of how well a FLOSS project follows common practices, particularly those that impede packaging or codevelopment by others. It measures “FAIL” points, so low scores are better; 0 is perfect, 5 through 25 is “You're probably doing okay, but you could be better,” and above 25 is an indicator of serious problems. The measures are grouped into categories: size, source (version) control, building from source, bundling, libraries, system install, code oddities, communication, releases, history, licensing, and documentation. Examples of causes for fail points are:
Source Control: There is no publicly available source control (e.g., cvs, svn, bzr, git) [ +10 points of FAIL ].
Building from source: There is no documentation on how to build from source [ +20 points of FAIL ].
Communication: Your project does not have a mailing list [ +10 points of FAIL], or your project does not have a website [ +50 points of FAIL ].
Licensing: Your code does not have per-file licensing [ +10 points of FAIL ].
Obviously, a high score does not always doom a project to fail, nor does a low score guarantee success. However, like any metric, the score can provide a simple metric to point out potential issues in an OSS project. It is intentionally designed to produce a numerical score, making it relatively easy to report.
4
http://spot.livejournal.com/308370.html
2-15
8.
Internet Success
The book Internet Success by Schweik and English reports a detailed quantitative analysis to determine “what factors lead some OSS commons to success and others to abandonment” [Schweik2012]. Schweik and English examined over 100,000 projects on SourceForge,5 using data from SourceForge and developer surveys, and using quantitative analysis instead of guesswork. They use a very simple project lifecycle model—projects begin in initiation, and once the project has made its first software release, it switches to growth. Based on this, they classified OSS projects into six “success and abandonment” classes as follows (see their chapter 7 table 7.1): 1. Success, initiation (SI). The developers have produced a first release. Its operational definition is having at least one release (all projects in the growth stage by definition meet the SI criteria, but see below). 2. Abandonment, initiation (AI). The developers have not produced a first release and the project is abandoned. Its operational definition is having zero releases and having ≥ 1 year since project registration. 3. Success, growth (SG). The project has achieved 3 meaningful releases of the software, and the software is deemed useful for at least a few users. Its operational definition is ≥3 releases and ≥ 6 months between releases and >10 downloads. 4. Abandonment, growth (AG). The project appears to have been abandoned before producing 3 releases of a useful product, or has produced 3 or more releases in less than 6 months and is abandoned. Its operational definition is 1 or 2 releases and ≥1 year since the last release, or ≥3 releases and