AgroLife Scientific Journal – Volume 2, Number 1, 2014 ISSN 2285-5718; ISSN CD-ROM 2285-5726; ISSN ONLINE 2286-0126; ISSN-L 2285-5718
OPEN SOURCE WEB APPLICATIONS FOR SPATIAL DATA MANAGEMENT AND FOR WATER RESOURCE ANALYSIS Michele BELLEZZA1, Luca CASAGRANDE1, Arnaldo PIERLEONI1, Stefano CASADEI2 1
T4E S.r.l. University of Perugia Spin-Off, Via Birago 18, 06124 Perugia, Italy, Email:
[email protected] [email protected] [email protected] 2 Department of Civil and Environmental Engineering, University of Perugia, Borgo XX Giugno 74, 06121 Perugia, Italy, Phone: +390755856043, Fax: +390755856049 Email:
[email protected] Corresponding author email:
[email protected] Abstract Many problems of water resource management are strongly related to their spatial distribution and due to a use that is usually uncontrolled, such as water withdrawals. For these reasons, web procedures have been developed in order to manage spatial data of interest and to analyze information on water resources, so that this tool can be widely used and shared freely and easily by all stakeholders. A prototype of this instrument is the web tool "Water Resources Management and Evaluation" (WRME). The main features of this project can be summarized as follows: − is easy to use, both for the database like and the map-based consultation; − uses synthetic indicators simplifying the hydrological and hydraulic information; − integrates tools for the update and the exchange of data between different databases of different stakeholders; − integrates the possibility to implement and update, in a distributed manner over the basin and the drainage network, all constraints arising from the different legislations and management plans; − provides synthetic information on the sustainability of scenarios; − provides synthetic information on the sustainability of new water withdrawals; − software is open source, therefore economic resources can be invested on training and development. The methodology of this project can also be applied in other areas of sustainable management of environmental resources. Key words: WEB, GIS, Open Source, Sustainable Water Resources Management, Environment.
INTRODUCTION
tools towards an integrated and cooperative management of natural resources and the environment. These tools allow all stakeholders (administrators, managers, users, professionals) involved in the management of the resources to monitor and share all decision processes for large and complex systems. The purpose of this method is to develop a proactive approach to critical events in water resources management, instead of a reactive management of emergency and disasters (Andreu et al., 2006). The necessity of sharing and discussing not only the results produced by models, but also the entire computational process from data and information down to the techno-decisional parameters adopted to run the simulations, makes the approach to these problems more and more complex, especially because all the technical and scientific aspects must be provided in a way that is also easily accessible to the many different professional categories. In
The issues concerning water resources management of a basin are always very complex because of conflicts between uses, the two-sided issue of quantity and quality, together with the evolution and growth of the concerns for the environment. All these issues have been faced with modelling tools that, through simulation processes, aim towards the optimization of water resources management of complex systems (Simonovic, 2000; Preziosi et al, 2013; Narsimlu et al, 2013). However, these tools may be partly ineffective due to sociopolitical conflicts (Akhbari and Grigg, 2013; Gunasekara et al, 2014) and different socioeconomic scenarios (Biswas, 2004). The development of computer systems, with applications supported by new technologies, GIS, Web-GIS, Spatial Decision Support System, opens new frontiers for the study of 1
any case, a big help comes from the adoption of the latest information and communication technologies (ICT). Tools and standards such as WEB-GIS technology, the Web Processing Service (WPS), Web Map Service (WMS), Web Feature Service (WFS), Web Coverage Service (WCS), and generally all the INTERNET network, can provide a solid base on which it is possible to integrate all the modelling methodologies and simulation procedures already developed in traditional informatics (Martin et al., 2005; Sridhar et al., 2011; Open Geospatial Consortium - OGC). The “Water Resource Management and Evaluation” project (WRME) has been developed aiming towards this goals, in particular the simplification and quickening of decisional processes, offering to the different stakeholders a single database and a series of shared geoprocessing tools, provided in form of Decision Support System (DSS). The prototype set up for the Tiber River basin has highlighted the operational effectiveness of this approach, because some elaborations on hydrological data and water withdrawals have shown how fundamental it is a single database at basin level, so that the results achieved by different models or more stakeholders can be compared.
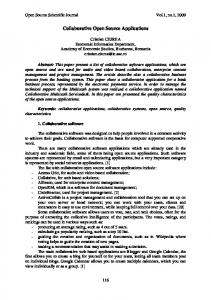
MATERIALS AND METHODS A DSS for water resources management in a context of multiple uses is primarily designed to provide stakeholders with a range of information in order to facilitate the process for action planning, and to foster communication between all those concerned. WRME system is an integrated DSS that is not just a mere platform to exchange information and assessments, but is an instrument for conflict resolution, in the management of water resources, and consensus reaching among all participants in the decisional processes. So the “top-down” approach has been replaced with a “bottom-up” approach, where all stakeholders can be decision-maker. For this reason, the development of this integrated tool do not only concern the hydrological aspects of water management, but also technological aspects. In fact, a considerable effort in adapting existing technologies and developing new capabilities has been required, especially in the integration of modelling engines in a single GIS platform available on the WEB. The informatic structure of WRME system is schematically shown in figure 1, with a threeserver architecture dedicated to the main services (WEB-GIS, DBM, Modelling).
Server SATTAR DB + Grass GIS Firewall
ServerWEB WEB Server Piattaforma WRME WRME platform ServerAREF AREF Server Modelli Idrologici hydrological models
Figure 1. Overall architecture of WRME system.
2
S T A K E H O L D E R S
The system can be summarized in the following fundamental steps: − collection and sharing of the hydrological data together with the information about water uses, with particular attention given to data update tools (server named SATTAR); − analysis on the data collected with GIS procedures (SATTAR) and implementation of hydrological models (server named AREF); − computation and results analysis with a graphical user friendly interface (GUI) in WEB-GIS environments (server WEB). The operation of the system requires extensive interaction between the three servers, not only because of the need to access the database, but also because the GIS running on SATTAR provides cartographic elaborations for the procedures installed on AREF. The GIS engine, which together with the database is installed on the server SATTAR, interacts directly with the Map Server and Web Service Processing to reproduce all outputs, both numerical and graphical, on screen. The collection of data and information about the studied area is the initial step in any research of this kind, but even in this phase many problems and uncertainties may arise, especially due to the scarcity of data or to a lack of knowledge. The issue of data scarcity could be easily solved with structural works such as: the expansion of the monitoring network, the technological update of the measuring stations, new data collection methodologies and so on. The case of lack of knowledge may be solved with a set of tools that allows a better access to the data collected so that information and knowledge could be widely shared. Achieving this final goal means the necessity of operating on a software platform that could allow a free sharing of information, knowledge and procedures in itinere and all these features are well provided by a WEBBASED architecture. For this reason the first step is the creation of a shared database at the basin scale of all data and information together with user friendly procedures for its periodical update.
The second step is the developing of a series of procedures concerning the analysis of the data. These procedures can be both numerical and graphical, according to the typology of the data and the kind of analysis concerned. The numerical procedures are aimed towards the definition of various hydrological indexes for defining the base flow value and lowflow, in order to be able to correctly assess the water resources and/or the available amount in a section of a network either in order to issue or renew a withdrawal license or to study the state of the watercourse. These flow values can be clearly identified indirectly by the Base Flow Index (Casadei, 1995; Piggott et al., 2005) and more directly from Qn,m (minimum average flow of n consecutive days with return period of m years) (Singh and Stall, 1974), the latter case is very well known and used in different basins as Q7,10. Besides these indices, the theory of flow duration curve (FDC) has been developed (Gustard et al. 1992; Smakhtin 2001), in order to evaluate the water resources available for dissipative use or no dissipative use (Casadei and Manciola, 1995). The graphical procedure can be very operatively useful to point out all the information of a single watershed. In this case a graphical interrogation of the map by means of a WEB-GIS engine (final step), makes this task much more immediate and accurate. For example, the water withdrawals management in a basin it is supported by a graphical procedure which compares the total withdrawals with dissipative use in the basin and the low flow indices in the same basin. In larger basins, the greatest difficulty is the fragmentation of responsibilities among administrations located in succession along the stream, this is why administrations downstream do not know the upstream situation (water availability), while those that are upstream are not able to understand the amount of legal water withdrawn downstream (water constrain). At the moment this situation generates a stalemate, for this reason a tool has been developed to operate via the web and able to work on a single database that should be constantly kept updated by the administrations.
RESULTS AND DISCUSSIONS
The Tiber river, together with its tributaries, flows through five regions, Tuscany and Emilia-Romagna regions in the upper part, the Umbria region in the middle, the Marche and Abruzzo regions through important tributaries and finally the Lazio region before flowing into the Tirreno Sea.
The methodology described in the previous paragraph has been applied to the Tiber River basin, that is located in the centre of Italy and occupies an area of 17462 km2 (Figure 2).
Figure 2. Tiber River Basin - WRME project.
This aspect is highly relevant, not only from an administrative point of view, but also from a technical one because it often happens that agreements between two or more regions are needed in order to build hydraulic works and to manage them (dams, pipes networks, spring tapping works, etc.). In order to make the technical-administrative side of the management of the superficial water resource much easier and immediate, a web site (http://hydrogate.unipg.it/wrme/) has been developed. In this portal, the data collection and validation phase brought to the compilation of a hydrological database, already accessible online, that has different levels of access according to the typology of user and the kind of information required. At present, about 12000 years of hydrometeorological data and about 10 000 information regarding the uses and the water withdrawal have been stored.
The data can be viewed both in a numeric format and a graphic visualization and if needed, easily exported in various file formats. Figures 3-4 show, however, a significant example of processing of hydrological indices, in this case the Base Flow Index. BFI is calculated for the hydrometric station of S. Lucia on the Tiber River. As can be seen for the entire time series (Fig. 4) we obtain a BFI = 43.87. Selecting more and more recent time series, the BFI increases: 1949-2004 BFI = 45.76, 1970-2004 BFI = 49.64 ; 1995 - 2004 BFI = 56.36; 2000-2004 (Fig. 5) BFI = 61.47. The increase in the index value is more evident with recent time series, in fact the base flow in this part of the river has been artificially increased, in recent years, by the water released from Montedoglio Reservoir, allowing the water course to have better quality and quantity conditions, and 4
supporting direct uses (withdrawals, especially irrigation) and indirect uses (social activities and habitat) of the water resource. This WEB-based approach can be replicated
for different time series of different gauged sites and for other types of indexes (Q7,10; Q355, streamflow that is equalled or exceeded 355 days in a year, on average ).
Figure 4. BFI calculation over the entire time series, BFI = 43.87.
Figure 5. BFI calculation over the 2000-2004 time series, BFI = 61.47.
In order to evaluate the river conditions the previous hydrological indices were used, while for the existing water withdrawals an analysis procedure has been developed, that from the point of interest selected directly on the map, finds out the upstream basin and, by means of overlay procedures, identifies the upstream water uses. To search the water
body in more details, a filtered search has been developed so that the uses can be retrieved on the base of their type, the allowed amount of water, and their administrative status. Figure 6 show the result of this analysis, where it is possible to highlight the no balance situations and introduce a proactive 5
correction in water resource management of this sub-basin.
REFERENCES Akhbari M., Grigg N.S., 2013. A Framework for an Agent-Based Model to Manage Water Resources Conflicts. Water Resources Management, 27, 11, 4039–4052. Andreu J., Rossi G., Vagliasindi F., Vela A., 2006. Drought Management and Planning for Water Resources. Taylor and Francis, London. Biswas A.K., 2004. Integrated Water Resources Management: A Reassessment. A Water Forum Contribution. IWRA, Water International, 29, 2, 248– 256. Casadei S., 1995. Analisi dell'indice del deflusso di base (BFI) di alcuni bacini dell'Italia Centrale (???). Idrotecnica, 3, 177-191. Casadei S., Manciola P., 1995. Criteria for the evaluation of the rate water use in a river basin. IAHS Pubblications No. 231, 169 -179. Gunasekara N.K., Kazama S., Yamazaki D., Oki T., 2014. Water Conflict Risk due to Water Resource Availability and Unequal Distribution. Water Resources Management, 28, 1, 169-184. Gustard A, Bullock A, Dixon J.M., 1992. Low flow estimation in the United Kingdom. Institute of Hydrology, Wallingford, IH report no.108 Martin P. H., LeBoeuf E. J., Dobbins J. P., Daniel E. B., Abkowitz M. D., 2005. Interfacing GIS with water resource models: a state-of-the-art review. J. American Water Resources Association., 41, 6, 1471-1487. Narsimlu B., Gosain A.K., Chahar B.R., 2013. Assessment of Future Climate Change Impacts on Water Resources of Upper Sind River Basin, India Using SWAT Model. Water Resources Management, 27, 10, 3647-3662. Open Geospatial Consortium (http://www.opengeospatial.org/ ). Piggott A.R., Moin S., Southam C., 2005. A revised approach to the UKIH method for the calculation of baseflow. Hydrological Sciences Journal, 50, 5, 911920. Preziosi E., Del Bon A., Romano E., Petrangeli A. B., Casadei S., 2013. Vulnerability to Drought of a Complex Water Supply System. The Upper Tiber Basin Case Study (Central Italy). Water Resources Management, 27, 13, 4655-4678. Smakhtin V.U., 2001. Low flow hydrology: a review. Journal of Hydrology, 240, 147–186. Simonovic S. P., 2000. Tools for water management – one view of the future. IWRA, Water International, 25, 1, 76-88. Singh K.P., Stall J.B., 1974. Hydrology of 7-Day 10-Yr Low Flows. Journal of the Hydraulics Division, 100, 12, 1753-1771. Sridhar P.S.V.S., Jowhar T. N., Garg A.B., Kedareswarudu U., 2011. A Framework of Information Technology for Water Resources Management. International Journal of Computer Applications, 30, 5, 21-25.
Low flow
Withdrawals
Figure 6. Example of water management status in a sub-basin.
CONCLUSIONS The ICT approach and the WebGIS platform represent the added value of the project. The final DSS is very friendly to use, both for the hydrological modelling, both for the computer technology. This platform could be expanded to a large range of topics which are involved in environment and landscape. The final goals of this project has been obtained in terms of: − software tools that can serve as a support in water resource evaluation and management policies at the basin scale; − use of free and open source software, therefore there are no additional costs for software licenses; − the Web interface can be changed according to the needs of the individual user and more over it is cross platform meaning that it can be used regardless the operative system; − the system is based exclusively on the standards defined by the Open Geospatial Consortium granting compatibility with the most common instruments that deal with geographical data. The development of this project in different hydrologic scenarios and socio-economic situations could be an important test in a robust decision making process. 6