Quantitative Quality Model for Evaluating Open Source Web Applications: Case Study of Repository Software Adewole Adewumi, Nicholas Omoregbe, Sanjay Misra Department of Computer and Information Sciences Covenant University Ota, Nigeria
[email protected] [email protected] [email protected]
Abstract— Many open source web applications exist today and universities also find them useful. For instance, universities now manage most of their research output by storing them in their respective institutional repositories. These repositories are often built as open source web applications and known as repository software. Several of these exist but three popular ones include: DSpace, EPrints and Greenstone (DEG). These three are open source and built by different institutions. Considering their increasing adoption and usage by universities today, it would be useful to have a model that can compare between the quality of two or more web applications and suggest the better option to an institution intending to adopt one. This paper therefore proposes a model for measuring quality in open source web applications (focusing on repository software) by adapting existing quality models. The proposed model is used to measure quality in DEG. The proposed model is validated through real data and the results presented and discussed. Overall, the model rated DSpace as the better option. Keywords-DSpace; EPrints; software; quality model
I.
Greenstone;
open
Luis Fernandez Department of Computer Science University of Alcala Spain
[email protected]
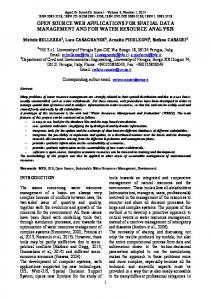
that the most popular institutional repository software in use today are open source namely: DSpace and EPrints (see Fig. 1). Greenstone can be the third but it is not as popular as the other two. All three share a common characteristic namely: they are built by universities – DSpace was developed through joint partnership between Massachusetts Institute of Technology and HP Research Labs, EPrints was developed by the University of Southampton and Greenstone was developed by the University of Waikato.
source
INTRODUCTION
The term ‘open source’ was coined in 1998 by Eric S. Raymond [1]. It refers to software in which the codes are made available at no cost. Prior to this time however, projects that can be regarded as open source had been on. For instance, Richard Stallman formed the GNU project in 1983 and Linus Torvalds developed the Linux kernel in 1991 [5]. Today a growing number of open source software exist and can be categorized based on their use. There are open source operating systems (e.g. Linux), open source web browsers (e.g. Mozilla Firefox), open source web applications such as WordPress, Drupal, repository software and the list continues. Repository software (also known as institutional repository software) emerged in the late 90s with the aim of helping institutions (particularly learning institutions) to capture, store and preserve research outputs for the long term. Although institutional repository software can either be open source or proprietary, statistics in (opendoar.org) show
Figure 1. Usage of open source repository software (www.opendoar.org)
It is claimed that open source software is of higher quality in comparison to its proprietary counterparts [2] [17]. In addition, making the right choice of repository software is crucial to the long term sustainability of the university’s research output. A model that can help in evaluating the choice of software to be made by evaluating its quality can be useful in this regard. This paper therefore proposes a model for measuring quality in open source repository software. The proposed model is evaluated by using it to measure quality in DSpace, EPrints and Greenstone (DEG) repository software. The rest of this paper is organized as follows: section 2 examines related work, in section 3 the proposed model is shown along with all the criteria used in its creation. The model is evaluated in section 4 using DEG as case studies. In section 5 we discuss the results of the evaluation process and conclude the paper in section 6.
II.
RELATED WORK
Various quality models have been proposed in literature [14] [15]. The models are usually hierarchical structures starting out with a quality goal or set of goals, followed by a set of attributes to realize such goal(s); metrics are at the lower end and are used to measure the attributes [3]. Some previously proposed models are discussed in the paragraphs that follow. Open Source Maturity Model (OSMM) proposed by CapGemini [11]. This model assumes that the quality of open source software is proportional to its maturity. The model has four indicators – product, integration, use and acceptance – through which any open source product is evaluated for quality. The evaluator assigns a score to each element and the final evaluation mark is the weighted sum of the scores [4]. The model though simple and easy to apply is often criticized for not taking into account some important software artifacts, such as the source code itself [4]. Open Business Readiness Rating (OpenBRR) [12] – It defines a model and a process for evaluating open source software with emphasis on attributes interesting to businesses [4]. Some of the criteria for evaluation include: functionality, operational software characteristics, support, documentation, adoption, and community and development process. The assessment involves four phases: The quick assessment filter phase for ruling in or ruling out software packages to be considered; the target usage assessment for ranking the importance of categories; the data collection and processing phase and the data translation phase where data is translated into Business Readiness Rating (a scale of 1-5). The whole process of assessment is however often criticized for being subjective [4]. Qualification and Selection of Open Source Software (QSOS) [13] is yet another open source evaluation model. The evaluation process is done in four iterative phases. Phase one is the definition of the evaluation factors. Phase two involves collection of information from the open source community and the construction of an identity card for the evaluated software. The quality criteria are then scored in a range of zero to two according to specific guidelines provided by the methodology. Phase three is the definition of the selection criteria according to user’s needs and constraints. The last phase is the identification of the software that fulfils user requirements and more generally compares software from the same family. QSOS scoring guidelines allow for objective results among users unlike OpenBRR but the whole process is not flexible enough and difficult to handle [4]. SQO-OSS is a generic model that measures quality in open source software systems. It distinguishes from other existing open source quality models in the following ways [4]: • It was constructed with a focus on automation. • It is the core of a continuous quality monitoring system • It does not evaluate functionality thereby leaving out room for subjective judgement
•
It focuses on source code since it is the most important aspect of any software project • It also considers the open source community but takes into account only those attributes that can be measured without subjective judgement. • It allows an evaluator to intervene in measurementbased evaluation process by modifying category profiles. A framework for measuring quality attributes in web based applications was proposed in [3]. This framework was built on two quality attributes crucial to web applications namely – usability (from the point of view of the user) and maintainability (from the point of view of the developer). Our approach in this paper was to combine the SQO-OSS quality model in [4] and the framework for measuring quality in web-based application proposed in [3] in order to realize a model that can be used for evaluating quality in open source web applications such as repository software. III.
THE PROPOSED MODEL
In order to propose a quality model there is need to first identify the factors that affect quality in open source repository software. First, most open source web applications are built by a team of developers and subsequently managed by the core team and a team of volunteer developers. They both make up what is referred to as a community. The quality of the activity of this community of developers tells on the software [19]. Also, the ease with which maintenance can be carried out on the software impacts on its quality [16]. Furthermore, open source repository software should be able to perform its intended function with a required level of precision. This refers to its reliability which also affects its quality [16]. In addition, the rates at which improvements are made to previous versions of the software also speak about the quality of the software especially when the improvement is not just a bug fix of the previous version [1]. The model in this section therefore measures the quality of open source web applications by examining the quality of its community activities, the maintainability of the software, the reliability of the software and the release activity of its developers. These can be collectively referred to as the quality criteria. They are discussed as follows: A. Community Activity One of the most important aspects of open source is the community [6]. A community in OSS can consist of both users and developers of the software. In some cases the two are separated, that is, a user community exists and a developer community also exists. Members of an OSS community are usually dispersed globally. Like any other community, interaction is a key activity that takes place within an OSS community. For interaction to take place, certain mediums are used such as mailing lists. In the case of open source repository software, one can only become a member of the user/developer community after subscribing to the mailing list. After subscribing to a community mailing list, a member can participate by helping to write/update the software documentation, filing error reports, helping other members solve problems encountered
while using the software, suggesting and possibly implementing new features for the software. Metrics that can be used to measure community activity include [4]: • Number of unique subscribers to the mailing list • Average number of messages in user/developer mailing list in the last 6 months, • Average thread depth, • Number of unsolved error reports in the last 6months. • Number of contributed add-ons. • Update frequency of documentation documents in a year. B. Maintainability A web application differs from most software systems because after it has been developed and deployed, it must be changed and updated constantly [3]. Maintenance is therefore an essential activity in web applications. The ease with which a web application can be maintained tells a lot about its quality. To measure the maintainability of a web application, we will be adopting some of the criteria in ISO 9126 which includes: analyzability, changeability and stability. Testability and scalability have been left out because both are difficult to measure and give room for subjective measurement. 1) Analyzability Analyzability is measured as the attributes of software that affect efforts to determine and address the cause of failures and errors [3]. To measure the analyzability of a web application, the method specified by Lilburne et al. [3] is used. In the method, the average of three software attributes (Locality, Error Reporting and Style Consistency) is used to determine the analyzability score. a) Locality (L): Average number of components required per task. 1/1 (100%) is the best ratio here. As more components are used to perform a single task, the score decreases. b) Error Reporting (ER): The error reporting score is calculated using Table I. Starting with 0 and adding the given amount for each point we have. TABLE I.
ERROR REPORTING SCORE
Type of error
Score
Error on web pages, no location
0
Error have location
+25
Error are kept in a log
+25
Critical errors are e-mailed
+25
Verbose error reports
+25
c) Style Consistency (SC):
Components with consistent style to total components, best ratio is 1/1 (100%). Any components that are inconsistent in style will reduce this score. The total score for analyzability is thus calculated as: (L + ER + SC) / 3 2) Changeability This refers to how easily data, formatting and program logic can be changed in a web application. The metrics that will be used are specified as follows [3]: a) Dynamic Data Ratio (DDR): The proportion of the data that is generated by programs on the server side, including data that is extracted from a database. It is calculated as (Dynamic Pages / total pages) / 100% b) Dynamic Format Ratio (DFR): The proportion of the format that is generated from specific formatting modules, such as templates or a library of format function. The calculation is (Number of templates / Total number of formats) * 100% c) Pages/format ratio (PFR): This refers to the number of pages presented on the client side that follow a specific defined format. Where the pages have uniform format (1/1), the percentage is 100%. This is calculated as: (Number of format/Number of pages) x 100% d) Pages/data ratio (PDR): The proportion of pages presented on the client side that use the same data or present similar forms of data. This is calculated as: (Number of pages with similar data / Number of pages) x 100% The total score for changeability can then be calculated as: (DDR+DFR+PFR+PDR) / 4 3) Stability It is defined as the attribute of a software product that has an influence on the risk of unintended consequences as a result of modifications [3]. Specific instances of this in web applications can be broken links as a result of changing the name of a page. To measure stability page-page coupling metric will be used [3]. Page-page coupling (PPC): This is expressed as: (1 / average number of links to a page) x 100% C. Reliability Reliability is one of the most important factors of webbased software and application [3] [8]. It is that attribute of the application that measures how long the application is able to operate and give out right information without failing [3] [7]. Reliability in web applications can be measured using two criteria namely: information reliability and operational reliability.
The attributes of information reliability include [3]: completeness, accuracy and consistency. However, in this work we are leaving out accuracy and consistency because they will result in subjective measurement. The metric that will be used to measure completeness is number of broken links found in the web page. The attribute used to measure operational reliability is longevity. To measure longevity the metric that will be used is operational age of the software. D. Release Activity In all open source projects, new versions are released after a period of time. The frequency of these releases and the level changes effected in them (that differentiates them from previous versions) can tell a lot about the quality of work being done on the software by its developers. The metrics that will be used to measure release activity is release frequency per period and significance per release [3]. a) Release frequency per period (in a year): This will count the number of releases made in a year. b) Significance per release: This will be measured using the following formula: (Number of releases in the last 12 months that are not just bug fixes / Total number of releases in last 12 months) x 100% The model is shown in Fig. 2. IV.
Participation in the DEG communities was measured using four metrics. • Number of unique subscribers to the mailing lists: Precise values can only be given by mailing list administrators. However, some administrators make these figures available. Greenstone for instance has 750 unique subscribers [9]. The figure for DSpace is 1376 unique subscribers [10] – based on the assumption that everyone who registers a DSpace instance also subscribes to the mailing lists. The figure for EPrints is 397 unique subscribers which was arrived at by finding the average between the number of EPrints-based repository in Registry of Open Access Repositories (475) and that of the Directory of Open Access Repositories (318)
Interactio
Average thread
Number of unique subscribers to the mailing list Community Activity Number of unsolved error reports in last 6 months
Participatio
Number of new features contributed in last 6
Update frequency of documentation
VALIDATION OF THE MODEL
There exists several open source repository software in use today. To evaluate our model we will be selecting three namely: DSpace, EPrints and Greenstone (DEG). These three are well known among implementers of digital libraries and institutional repositories. We evaluated the model based on data gotten from the websites (www.dspace.org, www.eprints.org, www.greenstone.org) and developer/user mailing lists of DEG. In order to measure maintainability in DEG, we downloaded and examined the source codes which are also available from the websites. A summary of the evaluation is presented visually in Figure 3. This section also discusses the evaluation process.
Average number of messages in user/developer mailing lists in last 6 months
Locality Analyzabilit
Error
Style Consistency
Dynamic Data Ratio
Dynamic Format Quality
Maintainabilit y
Changeabilit Pages/format ratio Page/data
A. Community Activity This quality criterion was evaluated using two attributes of a typical open source community which is interaction and participation. In order to measure the rate of interaction among members of the selected open source repository software, the following metrics were used. • Average number of messages in user/developer mailing lists in last 6 months: DSpace had the highest with an average of 1171. This shows that interaction is quite high in this community. This was followed by EPrints having 668 and Greenstone having an average of 165 [9]. • Average thread depth: This was 1.8 for EPrints, 1.6 for DSpace and 1.5 for Greenstone.
Stabilit
Completeness
Page-page coupling
Number of broken links
Reliabilit Longevit
Release Activity
Release Frequency
Release Significance
Operational Age of software
Release frequency per period
Significance per release
Figure 2. Quality Model for open source web applications
•
•
•
Number of unsolved error reports in the last 6 months: The value in DSpace is 189. This is not a bad contrast when compared to the 1171 average number of messages in the mailing lists. EPrints has 115 while Greenstone has 97. Number of contributed add-ons: EPrints leads with 371 contributed add-ons. DSpace has 19 add-ons (14 are freely available and 5 are offered at a cost) and Greenstone has no publicised add-ons. Update frequency of documentation documents in a year: The documentation of DEG is wiki-based. As of November 2012, DSpace has 68 updates made to its documentation. It is determined by checking under “Recent Documentation Updates” of [http://wiki.duraspace.org/display/DSDOC18/DSpac e+1.8+Documentation]. EPrints and Greenstone wikis each have 3 and 38 updates made to them respectively from January 2012 – November 2012. These values were determined by checking through the history pages of each of the wikis (wiki.eprints.org, wiki.greenstone.org).
B. Maintainability The three attributes used to measure maintainability include: analyzability, changeability and stability. The degree of analyzability of DEG (in percentage) is 91.7, 83.3, and 77.8 respectively. The values are derived by using the formulae earlier given. In addition, the degree of changeability is 100, 76.1 and 100 respectively. Furthermore, the degree of stability is 50, 55.6, and 75.1 respectively. All values were arrived at by examining the source codes. The results show that DSpace happens to be more analyzable compared to EPrints and Greenstone. In the area of changeability, DSpace and Greenstone come top with 100% each meaning they are highly customizable. This is due to their implementation language (Java) being popular among developers worldwide [18]. In the area of stability, Greenstone leads the rest. In all, Greenstone appears to be the most maintainable of all three platforms. C. Reliability The two attributes of reliability that were measured include: number of broken links and operational age of the software. There were no broken links in the three platforms examined. In terms of age however, EPrints is 12 years old
(2000-2012); Greenstone is 14 years old (1998-2012) while DSpace is 10 years old (2002-2012). D. Release Activity The two attributes used to evaluate this quality criterion in DSpace, EPrints and Greenstone includes the release frequency and the release significance. The two attributes were measured using the following metrics respectively: 1) Release frequency in a year: EPrints has the highest number of releases with an average of about 7 releases in a year. Due to the dynamic release frequency of EPrints, the above value was arrived at by taking the average release frequency of six consecutive years (2007 – 2012). The breakdown is given as follows (http://files.eprints.org/494/): 2007 = 9 releases 2008 = 11 releases 2009 = 3 releases 2010 = 10 releases 2011 = 8 releases 2012 = 3 releases The average is (9 + 11 + 3 + 10 + 8 + 3)/6 = 7.33 This is followed by DSpace having a fixed release frequency of 3 every year. Greenstone has the lowest number with an average of about 2 releases every year. 2) Significance of release per year: There have been five releases in the last 12 months for EPrints (October, 2011 – October, 2012). They are all stable releases. Therefore, the release significance of EPrints is (5/5)*100 = 100% Two out of the three usual releases of DSpace are significant (not just bug fixes). Therefore, the release significance of DSpace is (2/3) * 100 = 66.7% Greenstone also has a similar rate of 66.7%.
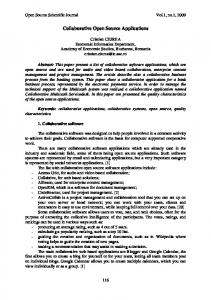
Figure 3. Line chart comparing the numeric scores of DEG
TABLE II.
TABLE SHOWING HOW THE BEST SOFTWARE IS SELECTED BASED ON NUMERIC SCORE
Metrics
Dspace
EPrints
Greenstone
D
E
G
Average number of messages in user/developer mailing lists in last 6 months Average thread depth in last 6 months
1171
668
165
1
2
3
1.6 1376
1.8 397
1.5 750
2 1
1 3
3 2
189
115
97
3
2
1
19
371
0
2
1
3
68 100
3 75
38 58.3
1 1
3 2
2 3
Number of unique subscribers to the mailing list Number of unsolved error reports in the last 6 months Number of contributed add-ons Update frequency of documentation documents in a year Locality (%) Error Reporting (%) Style Consistency Dynamic Data Ratio Dynamic Format Ratio
75
75
75
1
1
1
100 100
100 87.5
100 100
1 1
1 3
1 1
100
100
100
1
1
1
Pages/format ratio
100
50
100
1
3
1
Pages/data ratio
100
66.7
100
1
3
1
Page-page coupling
50 0
55.6 0
75.1 0
1 1
2 1
3 1
9 3
11 8
10 2
3 2
1 1
2 3
66.7
77.8
66.7
2
1
2
Number of broken links Operational age of the software (in years) Release frequency per period (in a year) Significance per release (%)
V.
DISCUSSION
Figure 3 presents a line chart that shows how each repository software numeric scores compare to each other. Metrics 1 for instance stands for average number of messages in user/developer mailing lists in the last 6 months.
26 32 34 DSpace has a total of 1171, while EPrints has a total of 668 and Greenstone a total of 165. DSpace is clearly leading in this regard. It means the DSpace community is very active communication compared to the other repository communities.
Metrics 3 stands for number of unique subscribers to the mailing lists and DSpace again takes the lead with 1376 subscribers. This is followed by Greenstone with about 750 subscribers and finally EPrints with 397 subscribers. Metrics 5 stands for number of contributed add-ons for which DSpace has 19, EPrints 371 and Greenstone 0. This indicates that add-on features can be easily created for EPrints compared to the other repository software. All the other metrics (2, 4, 6-18) seem to converge at a point on the line chart. This means that in terms of their numeric score it is difficult to tell the better one of the three software. Table II therefore shows how the best software is selected based on the numeric scores of the repository software for each metric. The last three columns in Table II show how the best software can be computed taking for instance the first metric (average number of messages in user/developer mailing lists in the last 6 months) we see that DSpace is ranked number one (1), having a higher score compared to the other two. EPrints ranks as number two (2), having the second highest value for metrics 1; Greenstone ranks number three behind the other two. This is repeated for all the other 17 metrics. In the end each column (D, E, G) belonging to DSpace, EPrints and Greenstone respectively is summed up. The one with the lower overall score is the best choice. As can be seen in Table II, DSpace scored 26 followed closely by EPrints which scores 32 and then Greenstone with a score of 34. DSpace is thus the better option of the three based on our model. This is also consistent with data retrieved from (opendoar.org). VI.
[3]
[4]
[5]
[6] [7] [8] [9] [10] [11]
[12] [13] [14]
CONCLUSION AND FUTURE WORK
In this paper, a model has been proposed for evaluating quality in open source web applications. A case study of repository software was considered. The model was composed by first identifying the factors that affect quality in open source repository software. Sub-factors were also identified and metrics proposed. The model was evaluated by applying it to measure quality in DSpace, EPrints and Greenstone. The results show that DSpace which is the most widely used repository software has the highest quality followed closely by EPrints and Greenstone. This agrees with the statistics in (opendoar.org). REFERENCES [1]
[2]
K. Berg (2005): Finding Open options: An Open Source software evaluation model with case study on Course Management Systems. Unpublished Masters’ thesis, pp. 14-99.
[15]
[16]
[17]
[18]
[19]
M. Michlmayer, F. Hunt, and D. Probert, “Quality Practices and Problems in Free Software Projects.” In Proceedings of the First International Conference on Open Source Systems, 2005. B. Lilburne, P. Devkota, and K. M. Khan, “Measuring Quality Metrics for Web Applications”. Technical Report In IRMA International Conference, 2004. In Ernesto Damiani and Giancarlo Succi, editors, Open Source Development, Communities and Quality — OSS 2008: 4th International Conference on Open Source Systems, pages 237–248. IFIP 20th World Computer Congress, Working Group 2.3 on Open Source Software, September 2008. (doi:10.1007/978-0-387-09684-1) G. Biswas, and D. Paul, “An evaluative study on the open source digital library software for institutional repository: Special reference to DSpace and greenstone digital library,” International Journal of Library and Information Science, Vol. 2, no. 1 2010, pp. 1-10 B. Golden, Succeeding with Open Source. Addison Wesley, Pearson Education, 2005, ISBN 0-321-26853-9 R. Pressman, Software Engineering: A Practitioner’s Approach, McGraw-Hill, 2005, Sixth Edition J. Offutt, Quality Attributes of Web Software Applications, IEEE Software, IEEE Press, 2002, pp. 25-32 Greenstone website: http://www.greenstone.org/factsheet DSpace website: http://www.dspace.org F. Duijnhouwer, and C. Widdows, “Open Source Maturity Model, Capgemini Expert Letter”, 2003, http://bolsa.info.unlp.edu.ar/campamento/campamento/documentos/G B_Expert_Letter_Open_Source_Maturity_Model_1.5.3.pdf Date accessed: 9th December, 2012 Business Readiness Rating. Business readiness rating for open source. http://www.openbrr.org. QSOS. Method for qualification and selection of open source software (qsos) version 1.6. http://www.qsos.org. G. Malak, H. Sahraoui, L. Badri, & M. Badri, “Modeling Web Quality Using a Probabilistic Approach: An Empirical Validation,” ACM Transactions on the Web, vol. 4, no. 3, 2010, doi: 10.1145/1806916.1806918 S. Antonia, and X. Michalis, “E-commerce system quality assessment using a model based on ISO 9126 and Belief Networks," Software Quality Journal, vol. 16, no. 1, 2008, pp. 107-129. U. Raja, and E. Barry, “Investigating quality in large-scale Open Source Software,” ACM SIGSOFT Software Engineering Notes, 2005, pp. 1-4 R. T. Watson, M. Boudreau, P. T. York, M. E. Greiner, and D. Wynn, “The Business of Open Source,” Communications of the ACM, vol. 51, no. 4, 2008, pp. 41-46 P. Potter, “How many Java developers are there in the world?” Plumbr, Available at: http://plumbr.eu/blog/how-many-javadevelopers-in-the-world Date accessed: 30th November, 2012. M. Aberdour, “Achieving Quality in Open Source Software,” IEEE Software, 2007, pp. 58 - 64