for the dtrace command is given in the dtrace(1) manual page. ..... The D language allows the programmer to specifying probes in the following way: .... The motivation behind them is to have a pragmatic way to carry state around probes in a.
Technical Report
UCAM-CL-TR-924 ISSN 1476-2986
Number 924
Computer Laboratory
OpenDTrace Specification version 1.0 George Neville-Neil, Jonathan Anderson, Graeme Jenkinson, Brian Kidney, Domagoj Stolfa, Arun Thomas, Robert N. M. Watson
August 2018
15 JJ Thomson Avenue Cambridge CB3 0FD United Kingdom phone +44 1223 763500 https://www.cl.cam.ac.uk/
c 2018 George Neville-Neil, Jonathan Anderson,
Graeme Jenkinson, Brian Kidney, Domagoj Stolfa, Arun Thomas, Robert N. M. Watson Approved for public release; distribution is unlimited. Sponsored by the Defense Advanced Research Projects Agency (DARPA) and the Air Force Research Laboratory (AFRL), under contracts FA8650-15-C-7558 (“CADETS”) as part of the DARPA Transparent Computing research program. The views, opinions, and/or findings contained in this report are those of the authors and should not be interpreted as representing the official views or policies, either expressed or implied, of the Department of Defense or the U.S. Government. Technical reports published by the University of Cambridge Computer Laboratory are freely available via the Internet: https://www.cl.cam.ac.uk/techreports/ ISSN 1476-2986
Abstract OpenDTrace is a dynamic tracing facility offering full-system instrumentation, a high degree of flexibility, and portable semantics across a range of operating systems. Originally designed and implemented by Sun Microsystems (now Oracle), user-facing aspects of OpenDTrace, such as the D language and command-line tools, are well defined and documented. However, OpenDTrace’s internal formats – the DTrace Intermediate Format (DIF), DTrace Object Format (DOF) and Compact C Trace Format (CTF) – have primarily been documented through source-code comments rather than a structured specification. This technical report specifies these formats in order to better support the development of more comprehensive tests, new underlying execution substrates (such as just-in-time compilation), and future extensions. We not only cover the data structures present in OpenDTrace but also include a complete reference of all the low level instructions that are used by the byte code interpreter, all the built in global variables and subroutines. Our goal with this report is to provide not only a list of what is present in the code at any point in time, the what, but also explanations of how the system works as a whole, the how, and motivations for various design decisions that have been made along the way, the why. Throughout this report we use the name OpenDTrace to refer to the open-source project but retain the name DTrace when referring to data structures such as the DTrace Intermediate Format. OpenDTrace builds upon the foundations of the original DTrace code but provides new features, which were not present in the original. This document acts as a single source of truth for the current state of OpenDTrace as it is currently implemented and deployed.
3
Acknowledgments The authors of this report thank the creators of DTrace, including Bryan Cantril, Adam Leventhal and Michael Shapiro for a spectacular contribution to the field of operating-system design, and in particular for designing the data structures, instructions, and other elements of DTrace described in this specification. Some of the text in this specification has been excerpted from the excellent comments present in the original source code. One cannot work with DTrace without running across the work of Brendan Gregg, author of the DTrace Toolkit, as well as DTrace: Dynamic Tracing in Oracle Solaris, macOS and FreeBSD, and to him we also owe a debt of thanks. Several people, including some of the original developers of DTrace, reviewed this report during various stages of its development and so we’d like to extend our thanks to Matthew Ahrens, Mark Johnston, Samuel Lepetit, Adam Leventhal, and David Pacheco. The authors of this report also thank other members of the CADETS team, and our past and current research collaborators at BAE Systems, the University of Cambridge, and Memorial University Newfoundland: David Chisnall Silviu Chiricescu Brooks Davis Khilan Gudka Ben Laurie Ilias Marinos Peter G. Neumann Greg Sullivan Rip Sohan Amanda Strnad Bjoern Zeeb The port of DTrace to FreeBSD was carried out in 2007 by John Birrell who, sadly, passed away in 2009, and we dedicate this report to his memory. Finally, we are grateful to Angelos Keromytis, DARPA Transparent Computing program manager, who has offered both technical insight and support throughout this work.
4
Contents 1
Introduction 1.1 Background . . . . . . . 1.2 The OpenDTrace Project 1.3 Version History . . . . . 1.4 Document Structure . . .
. . . .
. . . .
. . . .
. . . .
. . . .
. . . .
. . . .
. . . .
. . . .
. . . .
. . . .
. . . .
. . . .
. . . .
. . . .
. . . .
. . . .
. . . .
. . . .
. . . .
. . . .
. . . .
. . . .
. . . .
. . . .
. . . .
. . . .
. . . .
. . . .
11 11 12 13 13
2
OpenDTrace Architecture 15 2.1 Probe Life Cycle . . . . . . . . . . . . . . . . . . . . . . . . . . . . . . . . . 16 2.2 Trace Records . . . . . . . . . . . . . . . . . . . . . . . . . . . . . . . . . . . 18 2.3 Privilege Model . . . . . . . . . . . . . . . . . . . . . . . . . . . . . . . . . . 18
3
The D Language 3.1 Example Script . . . . . . . . 3.2 Language grammar . . . . . . 3.3 Safety . . . . . . . . . . . . . 3.4 Variables . . . . . . . . . . . 3.4.1 Global variables . . . 3.4.2 Built-in variables . . . 3.4.3 Thread-local variables 3.4.4 Clause-local variables 3.5 Aggregations . . . . . . . . . 3.6 Subroutines . . . . . . . . . . 3.7 Translators . . . . . . . . . . 3.8 Multithreading . . . . . . . . 3.8.1 Global variables . . .
. . . . . . . . . . . . .
. . . . . . . . . . . . .
. . . . . . . . . . . . .
. . . . . . . . . . . . .
. . . . . . . . . . . . .
. . . . . . . . . . . . .
. . . . . . . . . . . . .
. . . . . . . . . . . . .
. . . . . . . . . . . . .
. . . . . . . . . . . . .
. . . . . . . . . . . . .
. . . . . . . . . . . . .
. . . . . . . . . . . . .
. . . . . . . . . . . . .
. . . . . . . . . . . . .
. . . . . . . . . . . . .
. . . . . . . . . . . . .
. . . . . . . . . . . . .
. . . . . . . . . . . . .
. . . . . . . . . . . . .
. . . . . . . . . . . . .
. . . . . . . . . . . . .
. . . . . . . . . . . . .
. . . . . . . . . . . . .
. . . . . . . . . . . . .
. . . . . . . . . . . . .
19 19 20 25 25 25 26 26 26 26 27 27 28 28
4
Compact C Type Format (CTF) 31 4.1 On-Disk Format . . . . . . . . . . . . . . . . . . . . . . . . . . . . . . . . . . 31
5
Trace buffer 5.1 Enabling . . . . . . . . . . . . . . . . . . . . 5.1.1 OpenDTrace trace buffer . . . . . . . 5.1.2 Trace metadata . . . . . . . . . . . . 5.2 Aggregations . . . . . . . . . . . . . . . . . 5.2.1 OpenDTrace aggregation trace buffer 5.2.2 Data structures . . . . . . . . . . . . 5
. . . . . .
. . . . . .
. . . . . .
. . . . . .
. . . . . .
. . . . . .
. . . . . .
. . . . . .
. . . . . .
. . . . . .
. . . . . .
. . . . . .
. . . . . .
. . . . . .
. . . . . .
. . . . . .
. . . . . .
. . . . . .
35 35 35 36 42 42 43
6
OpenDTrace Object Format (DOF) 49 6.1 Introduction . . . . . . . . . . . . . . . . . . . . . . . . . . . . . . . . . . . . 49 6.1.1 Stable Storage Format . . . . . . . . . . . . . . . . . . . . . . . . . . 49
7
OpenDTrace Intermediate Format (DIF) 7.1 The DIF Interpreter . . . . . . . . . . . . . . 7.1.1 Registers . . . . . . . . . . . . . . . 7.1.2 Tables . . . . . . . . . . . . . . . . . 7.1.3 Math Instructions . . . . . . . . . . . 7.1.4 Comparison and Test Instructions . . 7.1.5 Branching Instructions . . . . . . . . 7.1.6 Subroutine Calls . . . . . . . . . . . 7.1.7 Variables . . . . . . . . . . . . . . . 7.1.8 Scalars . . . . . . . . . . . . . . . . 7.1.9 Arrays . . . . . . . . . . . . . . . . . 7.2 Instruction Format . . . . . . . . . . . . . . 7.2.1 Register Format (R-Format) . . . . . 7.2.2 Branch Format (B-Format) . . . . . . 7.2.3 Wide-Immediate Format (W-Format)
8
Instruction Reference 8.1 Instruction List . . . . 8.2 Individual Instructions AND . . . . . . . . . . OR . . . . . . . . . . . SLL . . . . . . . . . . SRL . . . . . . . . . . XOR . . . . . . . . . . SUB . . . . . . . . . . ADD . . . . . . . . . . MUL . . . . . . . . . SDIV . . . . . . . . . UDIV . . . . . . . . . SREM . . . . . . . . . UREM . . . . . . . . . NOT . . . . . . . . . . MOV . . . . . . . . . CMP . . . . . . . . . . TST . . . . . . . . . . BA . . . . . . . . . . . BE . . . . . . . . . . . BNE . . . . . . . . . . BG . . . . . . . . . . . BGU . . . . . . . . . . BGE . . . . . . . . . . BGEU . . . . . . . . .
. . . . . . . . . . . . . . . . . . . . . . . . .
. . . . . . . . . . . . . . . . . . . . . . . . .
. . . . . . . . . . . . . . . . . . . . . . . . .
. . . . . . . . . . . . . . . . . . . . . . . . .
. . . . . . . . . . . . . . . . . . . . . . . . .
. . . . . . . . . . . . . . . . . . . . . . . . .
. . . . . . . . . . . . . . . . . . . . . . . . .
. . . . . . . . . . . . . . . . . . . . . . . . . 6
. . . . . . . . . . . . . . . . . . . . . . . . .
. . . . . . . . . . . . . . . . . . . . . . . . .
. . . . . . . . . . . . . . . . . . . . . . . . .
. . . . . . . . . . . . . . . . . . . . . . . . .
. . . . . . . . . . . . . .
. . . . . . . . . . . . . . . . . . . . . . . . .
. . . . . . . . . . . . . .
. . . . . . . . . . . . . . . . . . . . . . . . .
. . . . . . . . . . . . . .
. . . . . . . . . . . . . . . . . . . . . . . . .
. . . . . . . . . . . . . .
. . . . . . . . . . . . . . . . . . . . . . . . .
. . . . . . . . . . . . . .
. . . . . . . . . . . . . . . . . . . . . . . . .
. . . . . . . . . . . . . .
. . . . . . . . . . . . . . . . . . . . . . . . .
. . . . . . . . . . . . . .
. . . . . . . . . . . . . . . . . . . . . . . . .
. . . . . . . . . . . . . .
. . . . . . . . . . . . . . . . . . . . . . . . .
. . . . . . . . . . . . . .
. . . . . . . . . . . . . . . . . . . . . . . . .
. . . . . . . . . . . . . .
. . . . . . . . . . . . . . . . . . . . . . . . .
. . . . . . . . . . . . . .
. . . . . . . . . . . . . . . . . . . . . . . . .
. . . . . . . . . . . . . .
. . . . . . . . . . . . . . . . . . . . . . . . .
. . . . . . . . . . . . . .
. . . . . . . . . . . . . . . . . . . . . . . . .
. . . . . . . . . . . . . .
. . . . . . . . . . . . . . . . . . . . . . . . .
. . . . . . . . . . . . . .
. . . . . . . . . . . . . . . . . . . . . . . . .
. . . . . . . . . . . . . .
. . . . . . . . . . . . . . . . . . . . . . . . .
. . . . . . . . . . . . . .
. . . . . . . . . . . . . . . . . . . . . . . . .
. . . . . . . . . . . . . .
53 53 53 54 54 54 54 54 55 55 55 55 55 56 56
. . . . . . . . . . . . . . . . . . . . . . . . .
57 57 61 62 63 64 65 66 67 68 69 70 71 72 73 74 75 76 77 78 79 80 81 82 83 84
BL . . . . BLU . . . BLE . . . BLEU . . LDSB . . LDSH . . LDSW . . LDUB . . LDUH . . LDUW . LDX . . . RET . . . NOP . . . SCMP . . LDGA . . LDGS . . STGS . . LDTA . . LDTS . . STTS . . SRA . . . PUSHTR PUSHTV POPTS . FLUSHTS ALLOCS COPYS . STB . . . STH . . . STW . . . STX . . . ULDSB . ULDSH . ULDSW . ULDUB . ULDUH . ULDUW ULDX . . RLDSB . RLDSH . RLDSW . RLDUB . RLDUH . RLDUW . RLDX . . SETX . .
. . . . . . . . . . . . . . . . . . . . . . . . . . . . . . . . . . . . . . . . . . . . . .
. . . . . . . . . . . . . . . . . . . . . . . . . . . . . . . . . . . . . . . . . . . . . .
. . . . . . . . . . . . . . . . . . . . . . . . . . . . . . . . . . . . . . . . . . . . . .
. . . . . . . . . . . . . . . . . . . . . . . . . . . . . . . . . . . . . . . . . . . . . .
. . . . . . . . . . . . . . . . . . . . . . . . . . . . . . . . . . . . . . . . . . . . . .
. . . . . . . . . . . . . . . . . . . . . . . . . . . . . . . . . . . . . . . . . . . . . .
. . . . . . . . . . . . . . . . . . . . . . . . . . . . . . . . . . . . . . . . . . . . . .
. . . . . . . . . . . . . . . . . . . . . . . . . . . . . . . . . . . . . . . . . . . . . .
. . . . . . . . . . . . . . . . . . . . . . . . . . . . . . . . . . . . . . . . . . . . . .
. . . . . . . . . . . . . . . . . . . . . . . . . . . . . . . . . . . . . . . . . . . . . .
. . . . . . . . . . . . . . . . . . . . . . . . . . . . . . . . . . . . . . . . . . . . . .
. . . . . . . . . . . . . . . . . . . . . . . . . . . . . . . . . . . . . . . . . . . . . .
. . . . . . . . . . . . . . . . . . . . . . . . . . . . . . . . . . . . . . . . . . . . . .
. . . . . . . . . . . . . . . . . . . . . . . . . . . . . . . . . . . . . . . . . . . . . .
. . . . . . . . . . . . . . . . . . . . . . . . . . . . . . . . . . . . . . . . . . . . . . 7
. . . . . . . . . . . . . . . . . . . . . . . . . . . . . . . . . . . . . . . . . . . . . .
. . . . . . . . . . . . . . . . . . . . . . . . . . . . . . . . . . . . . . . . . . . . . .
. . . . . . . . . . . . . . . . . . . . . . . . . . . . . . . . . . . . . . . . . . . . . .
. . . . . . . . . . . . . . . . . . . . . . . . . . . . . . . . . . . . . . . . . . . . . .
. . . . . . . . . . . . . . . . . . . . . . . . . . . . . . . . . . . . . . . . . . . . . .
. . . . . . . . . . . . . . . . . . . . . . . . . . . . . . . . . . . . . . . . . . . . . .
. . . . . . . . . . . . . . . . . . . . . . . . . . . . . . . . . . . . . . . . . . . . . .
. . . . . . . . . . . . . . . . . . . . . . . . . . . . . . . . . . . . . . . . . . . . . .
. . . . . . . . . . . . . . . . . . . . . . . . . . . . . . . . . . . . . . . . . . . . . .
. . . . . . . . . . . . . . . . . . . . . . . . . . . . . . . . . . . . . . . . . . . . . .
. . . . . . . . . . . . . . . . . . . . . . . . . . . . . . . . . . . . . . . . . . . . . .
. . . . . . . . . . . . . . . . . . . . . . . . . . . . . . . . . . . . . . . . . . . . . .
. . . . . . . . . . . . . . . . . . . . . . . . . . . . . . . . . . . . . . . . . . . . . .
. . . . . . . . . . . . . . . . . . . . . . . . . . . . . . . . . . . . . . . . . . . . . .
. . . . . . . . . . . . . . . . . . . . . . . . . . . . . . . . . . . . . . . . . . . . . .
. . . . . . . . . . . . . . . . . . . . . . . . . . . . . . . . . . . . . . . . . . . . . .
. . . . . . . . . . . . . . . . . . . . . . . . . . . . . . . . . . . . . . . . . . . . . .
. . . . . . . . . . . . . . . . . . . . . . . . . . . . . . . . . . . . . . . . . . . . . .
. . . . . . . . . . . . . . . . . . . . . . . . . . . . . . . . . . . . . . . . . . . . . .
. . . . . . . . . . . . . . . . . . . . . . . . . . . . . . . . . . . . . . . . . . . . . .
. . . . . . . . . . . . . . . . . . . . . . . . . . . . . . . . . . . . . . . . . . . . . .
. . . . . . . . . . . . . . . . . . . . . . . . . . . . . . . . . . . . . . . . . . . . . .
85 86 87 88 89 90 91 92 93 94 95 96 97 98 99 100 101 102 103 104 105 106 107 108 109 110 111 112 113 114 115 116 117 118 119 120 121 122 123 124 125 126 127 128 129 130
SETS . CALL . LDGAA LDTAA STGAA STTAA LDLS . STLS . XLATE XLARG 9
. . . . . . . . . .
. . . . . . . . . .
. . . . . . . . . .
. . . . . . . . . .
. . . . . . . . . .
. . . . . . . . . .
. . . . . . . . . .
. . . . . . . . . .
. . . . . . . . . .
. . . . . . . . . .
Built-in Global Variables 9.1 Built-in Variables reference arg09 . . . . . . . . . . . args . . . . . . . . . . . . caller . . . . . . . . . . . cpu . . . . . . . . . . . . . cpucycles . . . . . . . . . cpuinstrs . . . . . . . . . . cuthread . . . . . . . . . . distpatchaddr . . . . . . . epid . . . . . . . . . . . . errno . . . . . . . . . . . . execname . . . . . . . . . gid . . . . . . . . . . . . . id . . . . . . . . . . . . . ipl . . . . . . . . . . . . . machtimestamp . . . . . . pid . . . . . . . . . . . . . ppid . . . . . . . . . . . . XOR . . . . . . . . . . . . stackdepth . . . . . . . . . tid . . . . . . . . . . . . . ucaller . . . . . . . . . . . uid . . . . . . . . . . . . . uregs . . . . . . . . . . . . ustackdepth . . . . . . . . vcycles . . . . . . . . . . vinstr . . . . . . . . . . . timestamp . . . . . . . . . walltimestamp . . . . . . .
. . . . . . . . . .
. . . . . . . . . . . . . . . . . . . . . . . . . . . . .
. . . . . . . . . .
. . . . . . . . . . . . . . . . . . . . . . . . . . . . .
. . . . . . . . . .
. . . . . . . . . . . . . . . . . . . . . . . . . . . . .
. . . . . . . . . .
. . . . . . . . . . . . . . . . . . . . . . . . . . . . .
. . . . . . . . . .
. . . . . . . . . . . . . . . . . . . . . . . . . . . . .
. . . . . . . . . .
. . . . . . . . . . . . . . . . . . . . . . . . . . . . .
. . . . . . . . . .
. . . . . . . . . . . . . . . . . . . . . . . . . . . . .
. . . . . . . . . .
. . . . . . . . . . . . . . . . . . . . . . . . . . . . .
. . . . . . . . . .
. . . . . . . . . . . . . . . . . . . . . . . . . . . . .
. . . . . . . . . .
. . . . . . . . . . . . . . . . . . . . . . . . . . . . .
. . . . . . . . . .
. . . . . . . . . . . . . . . . . . . . . . . . . . . . .
. . . . . . . . . .
. . . . . . . . . . . . . . . . . . . . . . . . . . . . .
. . . . . . . . . .
. . . . . . . . . . . . . . . . . . . . . . . . . . . . .
. . . . . . . . . .
. . . . . . . . . . . . . . . . . . . . . . . . . . . . .
. . . . . . . . . .
. . . . . . . . . . . . . . . . . . . . . . . . . . . . .
. . . . . . . . . .
. . . . . . . . . . . . . . . . . . . . . . . . . . . . .
. . . . . . . . . .
. . . . . . . . . . . . . . . . . . . . . . . . . . . . .
. . . . . . . . . .
. . . . . . . . . . . . . . . . . . . . . . . . . . . . .
. . . . . . . . . .
. . . . . . . . . . . . . . . . . . . . . . . . . . . . .
. . . . . . . . . .
. . . . . . . . . . . . . . . . . . . . . . . . . . . . .
. . . . . . . . . .
. . . . . . . . . . . . . . . . . . . . . . . . . . . . .
. . . . . . . . . .
. . . . . . . . . . . . . . . . . . . . . . . . . . . . .
. . . . . . . . . .
. . . . . . . . . . . . . . . . . . . . . . . . . . . . .
. . . . . . . . . .
. . . . . . . . . . . . . . . . . . . . . . . . . . . . .
. . . . . . . . . .
. . . . . . . . . . . . . . . . . . . . . . . . . . . . .
. . . . . . . . . .
. . . . . . . . . . . . . . . . . . . . . . . . . . . . .
. . . . . . . . . .
. . . . . . . . . . . . . . . . . . . . . . . . . . . . .
. . . . . . . . . .
131 132 133 134 135 136 137 138 139 140
. . . . . . . . . . . . . . . . . . . . . . . . . . . . .
141 141 142 143 144 145 146 147 148 149 150 151 152 153 154 155 156 157 158 159 160 161 162 163 164 165 166 167 168 169
10 Built-in Subroutines 171 10.1 Subroutine calling mechanism . . . . . . . . . . . . . . . . . . . . . . . . . . 171 10.2 Subroutine list . . . . . . . . . . . . . . . . . . . . . . . . . . . . . . . . . . . 171 10.3 Subroutine reference . . . . . . . . . . . . . . . . . . . . . . . . . . . . . . . 174 8
alloca . . . . . . . . basename . . . . . . bcopy . . . . . . . . cleanpath . . . . . . copyin . . . . . . . . copyinto . . . . . . . copyinstr . . . . . . copyout . . . . . . . copyoutstr . . . . . . copyoutmbuf . . . . ddi pathname . . . . dirname . . . . . . . getmajor . . . . . . . getminor . . . . . . . getf . . . . . . . . . htonl . . . . . . . . . hotnll . . . . . . . . htons . . . . . . . . . index . . . . . . . . inet-ntop . . . . . . . inet-ntoa . . . . . . . inet-ntoa6 . . . . . . json . . . . . . . . . lltostr . . . . . . . . memref . . . . . . . memstr . . . . . . . msgdsize . . . . . . msgsize . . . . . . . mutex-owned . . . . mutex-owner . . . . mutex-type-adaptive mutex-type-spin . . . ntohl . . . . . . . . . ntohll . . . . . . . . ntohs . . . . . . . . . progenyof . . . . . . rand . . . . . . . . . random . . . . . . . rindex . . . . . . . . rw-read-held . . . . . rw-write-held . . . . rw-iswriter . . . . . . speculation . . . . . strlen . . . . . . . . strjoin . . . . . . . . strchr . . . . . . . .
. . . . . . . . . . . . . . . . . . . . . . . . . . . . . . . . . . . . . . . . . . . . . .
. . . . . . . . . . . . . . . . . . . . . . . . . . . . . . . . . . . . . . . . . . . . . .
. . . . . . . . . . . . . . . . . . . . . . . . . . . . . . . . . . . . . . . . . . . . . .
. . . . . . . . . . . . . . . . . . . . . . . . . . . . . . . . . . . . . . . . . . . . . .
. . . . . . . . . . . . . . . . . . . . . . . . . . . . . . . . . . . . . . . . . . . . . .
. . . . . . . . . . . . . . . . . . . . . . . . . . . . . . . . . . . . . . . . . . . . . .
. . . . . . . . . . . . . . . . . . . . . . . . . . . . . . . . . . . . . . . . . . . . . .
. . . . . . . . . . . . . . . . . . . . . . . . . . . . . . . . . . . . . . . . . . . . . .
. . . . . . . . . . . . . . . . . . . . . . . . . . . . . . . . . . . . . . . . . . . . . . 9
. . . . . . . . . . . . . . . . . . . . . . . . . . . . . . . . . . . . . . . . . . . . . .
. . . . . . . . . . . . . . . . . . . . . . . . . . . . . . . . . . . . . . . . . . . . . .
. . . . . . . . . . . . . . . . . . . . . . . . . . . . . . . . . . . . . . . . . . . . . .
. . . . . . . . . . . . . . . . . . . . . . . . . . . . . . . . . . . . . . . . . . . . . .
. . . . . . . . . . . . . . . . . . . . . . . . . . . . . . . . . . . . . . . . . . . . . .
. . . . . . . . . . . . . . . . . . . . . . . . . . . . . . . . . . . . . . . . . . . . . .
. . . . . . . . . . . . . . . . . . . . . . . . . . . . . . . . . . . . . . . . . . . . . .
. . . . . . . . . . . . . . . . . . . . . . . . . . . . . . . . . . . . . . . . . . . . . .
. . . . . . . . . . . . . . . . . . . . . . . . . . . . . . . . . . . . . . . . . . . . . .
. . . . . . . . . . . . . . . . . . . . . . . . . . . . . . . . . . . . . . . . . . . . . .
. . . . . . . . . . . . . . . . . . . . . . . . . . . . . . . . . . . . . . . . . . . . . .
. . . . . . . . . . . . . . . . . . . . . . . . . . . . . . . . . . . . . . . . . . . . . .
. . . . . . . . . . . . . . . . . . . . . . . . . . . . . . . . . . . . . . . . . . . . . .
. . . . . . . . . . . . . . . . . . . . . . . . . . . . . . . . . . . . . . . . . . . . . .
. . . . . . . . . . . . . . . . . . . . . . . . . . . . . . . . . . . . . . . . . . . . . .
. . . . . . . . . . . . . . . . . . . . . . . . . . . . . . . . . . . . . . . . . . . . . .
. . . . . . . . . . . . . . . . . . . . . . . . . . . . . . . . . . . . . . . . . . . . . .
. . . . . . . . . . . . . . . . . . . . . . . . . . . . . . . . . . . . . . . . . . . . . .
. . . . . . . . . . . . . . . . . . . . . . . . . . . . . . . . . . . . . . . . . . . . . .
. . . . . . . . . . . . . . . . . . . . . . . . . . . . . . . . . . . . . . . . . . . . . .
. . . . . . . . . . . . . . . . . . . . . . . . . . . . . . . . . . . . . . . . . . . . . .
. . . . . . . . . . . . . . . . . . . . . . . . . . . . . . . . . . . . . . . . . . . . . .
175 176 177 178 179 180 181 182 183 184 185 186 187 188 189 190 191 192 193 194 195 196 197 198 199 200 201 202 203 204 205 206 207 208 209 210 211 212 213 214 215 216 217 218 219 220
strrchr . . . . . . strstr . . . . . . . strtoll . . . . . . strtok . . . . . . substr . . . . . . sx-read-held . . . sx-exclusive-held sx-isexclusive . . tolower . . . . . toupper . . . . . uuidstr . . . . . . A Code Organization A.1 Open Solaris . A.2 Illumos . . . A.3 FreeBSD . . A.4 macOS . . . .
. . . .
. . . .
. . . . . . . . . . .
. . . .
. . . . . . . . . . .
. . . .
. . . . . . . . . . .
. . . .
. . . . . . . . . . .
. . . .
. . . . . . . . . . .
. . . .
. . . . . . . . . . .
. . . .
. . . . . . . . . . .
. . . .
. . . . . . . . . . .
. . . .
. . . . . . . . . . .
. . . .
. . . . . . . . . . .
. . . .
. . . . . . . . . . .
. . . .
10
. . . . . . . . . . .
. . . .
. . . . . . . . . . .
. . . .
. . . . . . . . . . .
. . . .
. . . . . . . . . . .
. . . .
. . . . . . . . . . .
. . . .
. . . . . . . . . . .
. . . .
. . . . . . . . . . .
. . . .
. . . . . . . . . . .
. . . .
. . . . . . . . . . .
. . . .
. . . . . . . . . . .
. . . .
. . . . . . . . . . .
. . . .
. . . . . . . . . . .
. . . .
. . . . . . . . . . .
. . . .
. . . . . . . . . . .
. . . .
. . . . . . . . . . .
. . . .
. . . . . . . . . . .
. . . .
. . . . . . . . . . .
. . . .
. . . . . . . . . . .
. . . .
. . . . . . . . . . .
. . . .
. . . . . . . . . . .
. . . .
. . . . . . . . . . .
. . . .
. . . . . . . . . . .
221 222 223 224 225 226 227 228 229 230 231
. . . .
233 233 233 233 234
Chapter 1 Introduction OpenDTrace is a dynamic tracing facility integrated into the Solaris, FreeBSD, and macOS operating systems—with ports also available for Linux and Windows. Dynamic tracing allows system administrators and software developers to develop short scripts (in the D programming language) that instruct OpenDTrace to instrument aspects of system operation, gather data, and present it for human interpretation or mechanical processing. While there is excellent documentation available for the D programming language, command-line tools, and OpenDTrace-based investigation and operation, the internal formats to OpenDTrace are generally documented via the source code. This report acts as a de facto specification for those formats, including the DTrace Intermediate Format (DIF), which is a bytecode that D scripts are compiled into for safe execution within the kernel, and the DTrace Object Format (DOF), which bundles together complete scripts along with their associated constants and metadata.
1.1
Background
The original DTrace code was designed and developed by Sun Microsystems to solve a particular problem, being able to instrument systems that were currently deployed, without requiring the recompilation of any code [2]. The DTrace system was written in a portable style typical of code from the Sun Microsystems Kernel Development group in the early 2000s. Shortly after the release of the original DTrace system a port was made, by John Birrell, to the FreeBSD Operating System. A port was also made by Apple to their macOS at about the same time. DTrace gained popularity as a dynamic tracing system throughout the first decade of the 21st Century and its usage is well documented [5][6][3]. The OpenDTrace system is meant to capture information about systems at run time, without the need to stop the program or kernel being investigated. A tracing system captures the program state of a running program and can show changes in that state over time. The person who is initiating the trace must decide before starting what information they wish to capture. Tracing systems have an important design constraint, which is the need to make the tracing system itself have as low an impact on overall system performance as possible. From the perspective of the user the OpenDTrace model is one of Plan, Capture and Analyze. The Plan phase is where the user writes brief scripts, in the D language, that describe the probe points from which they wish to capture data. Conditions can be placed upon when these probe points are active, so that the amount of data captured in the next phase, can be narrowed down to only what is absolutely necessary to feed the analysis and answer the question 11
we are asking of the system. The Capture phase is triggered by the dtrace program pushing the plan, in the form of compiled code, into the operating system’s kernel which activates the required probe points. The OS kernel captures the data into buffers which are eventually fed out to user space, where they can be analyzed. The Analysis is undertaken in user space where the previously written plan, in the form of D scripts, directs the OpenDTrace library to extract, display and or aggregate the captured data. Many workflows currently require some form of post-processing of the data captured for analysis, and this post-processing is currently carried out on unstructured text. OpenDTrace is made up of several components, including kernel code, user space libraries, and command line tools. The OpenDTrace system uses information generated during code compilation to expose a set of trace points with which users and programs can interact. These trace points can be the entry and exit points of functions as well as system calls, or they can be arbitrary points in the instruction stream, marked out with a set of standardized macros. From the user’s point of view tracing is activated by a command line program, dtrace, but any program that is compiled with the OpenDTrace libraries may initiate tracing, so long as it has sufficient privileges. The OpenDTrace privilege model is relatively simple, any program that wishes to trace another program must be running with root privileges. Some operating systems, such as Illumos, provide a more nuanced privilege model, the details of which are discussed further in Section 2.3. Tracepoints are collected into one of many providers which dictate the capabilities of the tracepoint and how it interacts with the overall tracing system. Providers exist for system calls (syscall), function boundary tracing (fbt), timing services (profile), as well as specific subsystems such as the network (ip, tcp), filesystem (vfs) and process scheduler (proc). Arbitrary trace points can be added to the kernel via the statically defined trace point (sdt) provider. User space programs are traced either with the pid provider or using the statically defined trace point (usdt) provider.
1.2
The OpenDTrace Project
The OpenDTrace project exists to be a single, cross platform, upstream source of tracing code. Based initially on the DTrace code that was written by Sun Microsystems, now Oracle, for the OpenSolaris and then Illumos operating system the code has already been ported to FreeBSD, by John Birrell, and macOS, by engineers working internally at Apple Computer. OpenDTrace combines all of these divergent ports into a single source tree that can be deployed on any of these three operating systems, with a unified set of features. The OpenDTrace project maintains its own organization on github (https://github.com/opendtrace) with a set of repositories, including one for documentation (https://github.com/opendtrace/documentation) from whence this specification originates. The OpenDTrace team welcome contributions of code, bug fixes, and other information via pull requests to the relevant repositories within the github organization. 12
1.3
Version History
0.1 This is the first version of the OpenDTrace Formats Specification, made available for early review and collaborative development.
1.4
Document Structure
This report specifies a number of aspects of OpenDTrace’s operation: The Architecture of OpenDTrace described in Chapter 2 gives a general overview of the internals of the OpenDTrace system, including the relationship of the major components, privilege model, and other, overarching, concerns. The D Language described in Chapter 3 provides a full description of the D language, which is the domain specific scripting language used to create more complex data queries and to perform data reduction after tracepoint data has been captured. The Compact Trace Format (CTF) described in Chapter 4 explains the data extracted from compiled object code that is used by OpenDTrace to create trace points and extract function arguments and types. The OpenDTrace Object Format (DOF) described in Chapter 6 is a file-like format linking together a set of sections describing OpenDTrace code, string constants, and other aspects of a complete compiled OpenDTrace script. The OpenDTrace Intermediate Format (DIF) is the bytecode that the executable elements of OpenDTrace scripts are compiled to. This is a simple RISC-like instruction set with constrained execution properties (e.g., only forward branches). Chapter 7 describes the instruction format and common instruction semantics. DTrace Instructions are the individual RISC instructions performing a variety of operations including register access, memory access, arithmetic operations, and calling various built-in subroutines available to scripts in execution. Chapter 8 enumerates the instructions, their arguments, and their semantics. Built-in Global Variables are a set of implementation-defined variables always available to scripts. This includes DTrace state (such as the current probe ID) and state from the instrumented probe context (e.g., the current process ID). Chapter 9 specifies these variables. Built-in Subroutines are available to scripts, providing access to higher-level behavior, such as memory copying, string comparison, and so on. Chapter 10 describes the available built-in subroutines. Code Organization for the DTrace implementation varies by operating system. Appendix A describes the high-level layout of the DTrace code in several operating systems incorporating DTrace support.
13
14
Chapter 2 OpenDTrace Architecture
dtrace(1)
Object Code
CTF Section
ctfconvert
libdtrace
Kernel Module
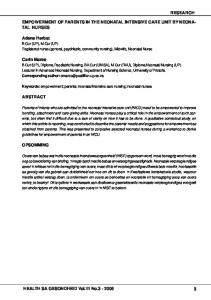
Figure 2.1: OpenDTrace Components The components that make up OpenDTrace interact with each other to implement an operational model for dynamic tracing. At the highest level there are several components to OpenDTrace: tools, such as ctfconvert which take compiled object code and generate new ELF/DWARF sections that capture type information, the kernel module, which is responsible for adding and removing trace points at run time, and the libraries, which tie all of the components together. Users interact with OpenDTrace via the dtrace command line tool. The OpenDTrace kernel module is the heart of the DTrace framework. This module is responsible for the coordination of all other components used in instrumentation. It keeps track of all registered providers and informs them when to enable or disable their probes. When a probe fires, the OpenDTrace kernel module is responsible for executing the necessary instrumentation code and providing the data to any consumers. The kernel module is also the intermediary between the DTrace user interface and the providers. When compiling user scripts, the kernel module provides the D compiler with probe arguments and types. Once compiled, scripts are pushed into the kernel as Enabling Control Blocks (ECBs) to be executed when probes fire. After each ECB is executed, the data is handed back to user space where the dtrace command line tool, or other programs linked against the OpenDTrace libraries can manipulate or display the data to end users. Providers in OpenDTrace encapsulate the probe points that are used to instrument code and provide data to the end user. A provider defines both a set of probe points as well as the standard by which the system interacts with that set of probe points. For example, the Function 15
Boundary Tracepoint (fbt) provider, not only gives D scripts access to function entry points and their arguments, but also access to the return from a function. The fbt provider, following the C ABI standard, defines a return trace point to have only two arguments: zero (0) and one (1). The zero’th argument to any return probe always contains the return value and the first argument contains return address. The return probe is specific to the fbt provider, and no other provider has such a definition. OpenDTrace has a base set of providers that are shipped as part of the system, but developers are free to create their own, to expose more or different information from their code. Providers can be developed either for the kernel, in which case they are defined as kernel modules, or for user space, as part of the Userland Statically Defined Tracing (USDT) system. A provider is simply a collection of probe points. Probe points are functions that are run when certain points in the code are reached. The probe gathers data of interest and passes data back into the OpenDTrace kernel module for further processing. Since the overhead of probes should be avoided when data is not required, the provider is responsible for tracking when probes are enabled and implementing a mechanism for the kernel module to update their state. The user space interface to OpenDTrace is the drace(1) command line utility. The dtrace command line utility handles all run time interaction with the OpenDTrace system, such as submitting scripts for execution as well as configuring options as memory usage, and how often the system should flush data from the kernel. The complete syntax and set of options for the dtrace command is given in the dtrace(1) manual page. The majority of the DTrace CLI functionality is provided through calls to the DTrace userspace library, libdtrace, which is responsible for setting DTrace options, compiling D scripts, and passing compiled D code to the kernel for execution. The libdtrace library provides the mechanism for all interactions with DTrace in the kernel.
2.1
Probe Life Cycle
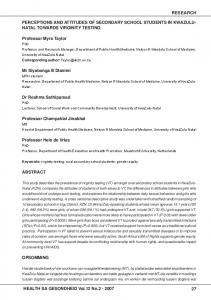
An example of instrumentation with OpenDTrace is shown in Figure 2.2. We assume that the OpenDTrace kernel module has already been loaded during system boot. We ignore the execution of code within any of the providers and only discuss the interactions between components. Internal functions of interest within the kernel module and CLI are shown. When a provider is first loaded it registers itself with the OpenDTrace kernel module (1). The registration process causes the provider to enumerate all of its available probes, which are also disabled by default. The provider and kernel module remain idle until instrumentation is requested. Instrumentation is requested via the dtrace command in cooperation with the libdtrace library. The the user provides a D script, specifying the code to be run when a probe fires (2). When the dtrace command executes it initializes the libdtrace library, which in turn causes the kernel module to initialize its tracing state and set up memory buffers to stored the trace data. The libdtrace library then compiles the D script (3). As part of this process the compiler queries the kernel module to determine the arguments for probes of interest via an ioctl (3a). The kernel in turn queries the provider for a description of the probe arguments which are returned to the compiler. If the arguments discovered by the kernel module do not match those supplied in the D script the compiler will signal an error and abort compilation of the D script. If the script did not supply any type information, the compilation will complete and any mismatch 16
Kernel
Userland
Provider
8. Display Results
2. Script Input
5. dtrace_probe(…)
4. dtps_enable(…)
3b. dtps_getargdesc(…)
1. dtrace_register(…)
script.d
3a. DTRACEIOC_PROBEARG (ioctl)
dtrace.ko
3c. DTRACEIOC_ENABLE (ioctl)
DTrace CLI (libdtrace)
7. copyout(…) 3. Compile Script
6. Process ECBs
Figure 2.2: Lifecycle of an OpenDTrace Probe
17
will result in a runtime error. The result of the D script compilation is a set of Enabling Control Blocks (ECB)s. An ECB is created for each enabling, or probe point, as well as for each action statement in a D language clause. The ECBs are provided to the kernel module (3c) which stores them, with others, in a tree like structure. Once an ECB is safely stored in the kernel, the kernel module tells the provider to enable the probes that are to be instrumented. Enabling a probe means telling the provider that at the right point, decided by the provider, the control will be transferred to DTrace. The function boundary tracepoint (fbt) and fasttrap providers which allow tracing of kernel code and user space code, respectively, both operate under the same model. They both find the instruction in the program at which the tracepoint is to be placed and swap the regular instruction with a an architecture dependent break-point instruction when tracing is enabled. The profile provider is completely different from the fbt or fasttrap providers as it fires its probes on a periodic basis. When code execution reaches a point that has an enabled probe, the probe fires and a call is made into the kernel module (5). The kernel module then walks through the tree of ECBs, executing any that match the probe that was fired (6). The captured data is written into the buffer created when libdtrace was initialized. At a later point the data is copied out of the kernel by the library (7), and then the final results are made available to the end user (8).
2.2
Trace Records
When tracing is enabled the OpenDTrace modules in the kernel produce a stream of records which are consumed by user level processes, such as the dtrace(1) command, and turned into various types of output. Records are communicated in a buffer structure which is shared between the kernel and user space. Buffers contain one of two types of data. Either the data is a plain record, or it is an aggregation. All data is arranged as a stream of bytes where the current header gives the extent of the data, indicating where the next record can be found. The details of the buffer structure are described in Chapter 5. Plain records contain the data requested by the D script along with optional formatting information and arguments. Aggregations are treated specially because they are not simply raw data buffers, but instead, contain information that describes deltas, normalized data, and information on data binning.
2.3
Privilege Model
The OpenDTrace privilege model is relatively simple, any program that wishes to trace another program, or the operating system kernel, must be a privileged user from the perspective of each provider.
18
Chapter 3 The D Language The D language is a language inspired by the AWK programming language [1] and the C programming language [2][4]. In this chapter, we give a formal definition of the D programming language that is a part of OpenDTrace, as well as elaborate on its properties in multi-threaded environments.
3.1
Example Script
Before describing the full grammar in detail we present a brief, example, D script, called a one liner. D one liners are the most frequently used D scripts because they are an easy way to start tracing a system without writing a file full of D code. D scripts are a collection of one or more probe points with optional actions and filtering predicates. Figure 3.1 shows a simple, but descriptive, D script. The script prints out the size of the data that a program attempts to write using the write(2) system call as well as name of the program that made the write call. Starting from the left hand side of Figure 3.1 we see the probe point in red. The probe point includes the provider name, syscall as well as the function, write, and the fact that we want to look at the entry into the system call. Moving to the far right of Figure 3.1 we see the action that will be taken whenever the probe point fires. Actions are written in the D language which is an interpreted subset of the C language and so this script should be familiar to most C or C++ programmers. D has a large set of built-in subroutines, described in Chapter 10, which includes familiar functions such as printf(). Each probe point can have up to six (6) arguments, numbered from arg0 to arg5, and in this example we are interested in arg2, which is the nbytes argument to the write system call. We want to know which program made the call to write and so we also print the execname which a D built in variable that contains the name of the program that caused the probe to fire. Coming back to the middle of Figure 3.1 we see text marked in green, which is a predicate. Probe
Predicate
Action
syscall::write:entry /arg2 != 0/ { printf(“%s write size % d\n", execname, arg2); } Provider
Function
Subroutine
Figure 3.1: D One Liner 19
Built in variable
Predicates are used to filter when probes fire allowing the script writer to reduce the amount of data collected during tracing. A system call such as write is called frequently on a busy system and without a predicate the script will collect quite a bit of data, much of which may not be relevant to the issue that we are trying to investigate. The predicate in Figure 3.1 allows the probe to fire if, and only if, the length of the buffer passed to the write system call is not equal to zero (0). More complex Boolean expressions are possible within predicates but we want to have a simple example. With this example in mind we now turn to the formal grammar for the D language.
3.2
Language grammar
In this section, we will define the grammar of the D language and explain how each part fits together when interacting with DTrace. Terminals are represented using lower case, while non-terminals are written as CamelCase. We define the tab character, ‘\t’ and space, ‘ ’ as separators. We first define a number of auxiliary constructs to define the rest of the grammar. hletteri
::= ‘A’ ... ‘Z’ | ‘a’ ... ‘z’ | ‘ ’;
hWordi
::= hletteri { hletteri } ;
In D, ‘ ’ is considered a letter, which can be used at the start of a name. As in C, separators can either be tabs or white space characters. Additionally, we define number constants that are supported in D: hdec digiti
::= ‘1’ | ‘2’ | ‘3’ | ‘4’ | ‘5’ | ‘6’ | ‘7’ | ‘8’ | ‘9’ ;
hDecDigitWithZeroi
::= ‘0’ | hdec digiti ;
hbin digiti
::= ‘0’ | ‘1’ ;
hoct digiti
::= ‘0’ | ‘1’ | ‘2’ | ‘3’ | ‘4’ | ‘5’ | ‘6’ | ‘7’ ;
hHexDigiti
::= hDecDigitWithZeroi | ‘A’ ... ‘F’ | ‘a’ ... ‘f’ ;
hIntegeri
::= | | |
hIdentifieri
::= hWordi { ( hDecDigitWithZeroi | hWordi ) } ;
hIdentifierOrStringi
::= [ ‘"’ ] hIdentifieri [ ‘"’ ] ;
hVarListi
::= hIdentifieri { ‘,’ hIdentifieri } ;
hdec digiti hDecDigitWithZeroi ‘0b’ hbin digiti ‘0’ hoct digiti ‘0x’ hHexDigiti
20
In D, there are many ways to access types. There are a number of builtin types, as well as mechanisms to define these types. Similar to the C language, D supports a number of primitive integer and floating point types, as well as a string and userland type. hTypei
::= | | | | | | | | | | | | | |
‘char’ ‘short’ ‘int’ ‘signed’ ‘unsigned’ ‘long’ ‘long long’ ‘userland’ ‘string’ ‘void’ ‘float’ ‘double’ hTypedefNamei hStructOrUnionSpeci hEnumSpecifieri ;
In the above type specification, we introduce three new non-terminals that we further have to specify: TypedefName, StructOrUnionSpec and EnumSpecifier. TypedefName represents a type that is defined to be an alias to another type, much like in C: hTypedefNamei
::= hIdentifieri ;
The StructOrUnionSpec represents a way to specify a D struct or union type. These language primitives are compatible with their C counterparts and ensure ABI compatibility. This is important when tracing the kernel, but also allows trivial translation to other ABIs. Moreover, enum definitions exist in D with the same syntax as they have in C. Finally, D has a notion of translators – we specify all of these as a part of a type specifier as follows: hStructOrUnionSpeci
::= hModifieri ( ‘struct’ | ‘union’ ) [ hIdentifieri ] ‘{’ hStructDeclListi ‘}’ [ hVarListi ] ‘;’ | ( ‘struct’ | ‘union’ ) hIdentifieri [ hVarListi ] ‘;’ ;
hStructDeclListi
::= hTypei hVarListi ‘;’ { hTypei hVarListi ‘;’ } ;
hEnumSpecifieri
::= hModifieri ‘enum’ [ hIdentifieri ] ‘{’ hEnumDeclListi ‘}’ [ hVarListi ] ‘;’ | ‘enum’ hIdentifieri [ hVarListi ] ‘;’ ;
hEnumDeclListi
::= hIdentifieri [ ‘=’ hIdentifieri ] [ ‘,’ ] ;
hIdentPtrFollowi
::= hIdentifieri { ‘->’ hIdentifieri } ;
hTranslatorIdenti
::= | | |
hIdentifierOrStringi hIdentifierPtrFollowi hSubroutinei ‘(’ hSubroutineArgsi ‘)’ hTranslatorIdenti [ ‘?’ hTranslatorIdenti ‘:’ hTranslatorIdenti ] ; 21
hTranslatorSpeci
::= ‘translator’ hIdentifieri ‘’ ‘{’ hIdentifieri ‘=’ hTranslatorIdenti ‘;’ { hIdentifieri ‘=’ hTranslatorIdenti ‘;’ } ‘}’ ‘;’ ;
hTypeSpecifieri
::= hStructOrUnionSpeci | hEnumSpecifieri | hTranslatorSpeci ;
Here we introduce a new non-terminal, Modifier which encapsulates the modifiers that may occur before a struct or enum definition. Moreover, we introduce Subroutine and SubroutineArgs which will be defined later on. Modifier is defined as follows: hModifieri
::= | | | | | |
‘const’ ‘volatile’ ‘typedef’ ‘register’ ‘restrict’ ‘static’ ‘extern’ ;
Even though Modifier is permissive in terms of what keywords are allowed, the definitions of these keywords are equivalent to those in C and may only be used when appropriate. The compiler may choose to emit a warning and ignore modifiers that are not applicable or it may choose to be more strict and treat misuse of a modifier as an error. Using these modifiers when not applicable is considered undefined behavior. D is a domain-specific language used for tracing and provides probes in the operating system kernel. The D language allows the programmer to specifying probes in the following way: hProbeSymboli
::= | | | | | | | |
hletteri hDecDigitWithZeroi ‘*’ ‘+’ ‘\’ ‘?’ ‘!’ ‘[’ ‘]’ ;
hProbeIdenti
::= hProbeSymboli { hProbeSymboli } ;
hProbeSpecifieri
::= | | |
hProbeIdenti [ hProbeIdenti ] ‘:’ [ hProbeIdenti ] [ hProbeIdenti ] ‘:’ [ hProbeIdenti ] ‘:’ [ hProbeIdenti ] [ hProbeIdenti ] ‘:’ [ hProbeIdenti ] ‘:’ [ hProbeIdenti ] ‘:’ [ hProbeIdenti ] ;
This provides us with a way to specify the provider, module, function and name of a DTrace probe in D. The reason symbols such as ‘*’ are allowed is because D allows the user to 22
write glob expressions much like a Unix shell does. D defines a complete set of operators for the language. For clarity We split the operators into three different parts – binary operators, prefix unary operators and postfix unary operators. We intentionally avoid the use of a ternary ‘?’ operator here, as it is specified as a part of allowed expressions. hpre un operatori
::= | | |
hpost un operatori
::= ‘++’ | ‘--’ ;
hbin operatori
::= | | | | | | | | | | | | | | | | | | | | |
‘++’ ‘--’ ‘!’ ‘˜’ ;
‘+’ ‘-’ ‘*’ ‘=’ ‘/’ ‘%’ ‘==’ ‘&&’ ‘||’ ‘|’ ‘&’ ‘ˆ’ ‘=’ ‘&=’ ‘|=’ ‘ˆ=’ ‘˜=’ ‘+=’ ‘-=’ ‘*=’ ‘/=’ ‘%=’ ;
A probe clause in a D script consists of an optional predicate. A predicate contains a logical expression in propositional logic: hPredicatei
::= ‘/’ hLogicExpressioni ‘/’ ;
hLogicExpressioni
::= hExpressioni ;
We define Expression, which encapsulates scalar and array expressions and AggExpression which works with aggregations as: 23
hArrayIndicesi
::= ( hIdentifieri | hIntegeri ) { ( hIdentifieri | hIntegeri ) } | hIdentifierOrStringi | hArrayIndicesi ‘,’ hArrayIndicesi ;
hThisOrSelf i
::= ‘this->’ | ‘self->’ ;
hExpressioni
::= | | | | | | |
hXLatei
::= ‘xlate ’ ‘(’ hXLateMethodi ‘)’ ;
hXLateMethodi
::= hSubroutinei ‘(’ hSubroutineArgsi ‘)’ | hIdentifierOrStringi ;
hAggExpressioni
::= ‘@’ [ hIdentifieri ] [ ‘[’ hArrayIndicesi ‘]’ ] ‘=’ hAggFunci ; | hAggSubroutinei ‘(’ hAggSubroutineArgsi ‘)’ ;
hExpressioni hbin operatori hExpressioni hpre un operatori hExpressioni hExpressioni hpost un operatori hExpressioni ‘?’ hExpressioni ‘:’ hExpressioni hSubroutinei ‘(’ hSubroutineArgsi ‘)’ hThisOrSelf i hIdentifieri [ ‘[’ hArrayIndicesi ‘]’ ] hIdentifierOrStringi hXLatei ;
In order to provide a full definition, we need to define Subroutine, AggFunc and AggSubroutine. The definitions of these elements varies depending on what subroutines, aggregating functions and aggregating subroutines are actually available as a part of the D runtime, which in turn, depends on the currentl DTrace implementation. The same problem presents itself with SubroutineArgs and AggSubroutineArgs which depend on Subroutine and AggSubroutine, so we are unable to specify completely without significantly limiting what aggregations and subroutines can be implemented. D allows for explicit declarations of variables. We specify this as: hDeclarationi
::= [ (‘this’ | ‘self’) ] hTypei hIdentifieri ;
We are able to define what a definition of a probe looks like: hProbeDefinitioni
::= hProbeSpecifieri [ hPredicatei ] ‘{’ { hStatementi } ‘}’ ;
hStatementi
::= hExpressioni ‘;’ | hAggExpressioni ‘;’ | hDeclarationi ‘;’ ;
Note that this only defines a single probe clause, not the full syntax of the D script. D scripts can have additional preprocessor statements in them and definitions of variables user-defined types outside of probe clauses. In the specification, we will avoid talking about compiler-specific preprocessor statements and the C preprocessor that can be run on the D script, as how this will be implemented and what parts of it will be supported is entirely up to the compiler writer. We define the D script as follows: 24
hVarDecli
::= hModifieri hTypei hIdentifieri [ ‘[’ hTypei hIdentifieri ‘]’ ] ;
hDScripti
::= | | | | |
3.3
hDScripti hPreprocessorStatementi hDScripti hDScripti hTypeSpecifieri hDScripti hDScripti hProbeDefinitioni hDScripti hDScripti hVarDecli [ ‘=’ hExpressioni ] hDScripti ‘;’ ‘’ ;
Safety
The D language will look familiar to anyone who has programmed in C or its close linguistic relatives, but in order to provide certain safety guarantees there are features of C-like languages that are missing from D. The most obviously missing feature is the lack of any sort of looping mechanism. Once they are compiled into byte code D scripts are loaded into the kernel where they run to completion. A script that was allowed to loop might, due to error or intent, loop forever, causing the operating system kernel to lock up and require a system reset. D lacks any form of loops to prevent such errors from occurring. By default, OpenDTrace runs in a mode where memory can be read but not written by D language scripts. A command line option to the dtrace (1) program, -w, puts OpenDTrace into destructive mode, where both reads and writes are possible. Although destructive mode is not a feature of the D language itself, it is an important part of the system’s overall commitment to safety.
3.4
Variables
DTrace implements three different scopes of variables: global, thread-local and clause-local. Global variables are visible to every probe and across all threads, allowing the user to write scripts that carry state across multiple threads should it be necessary and are identified with the variable name. Similar to global variables are D built-in variables such as execname, curthread, etc. We make a distinction between the two due to the difference between failures that they expose. A list of built-in variables can be found in Section 9.1. Thread-local variables are only visible within a single software thread, they are represented in source code as prefixed with self->. A thread-local variable is identified with its name and a thread ID. Clause-local variables are prefixed with this-> and are visible only within a single probe firing. This means that a clause-local variable will be visible across multiple clauses of the same probe, allowing the programmer to carry state associated with a clause-local variable across them.
3.4.1
Global variables
Any variable introduced in a D script that is not declared as part of a this-> or self-> is considered to be global in scope, meaning that it can be accessed from any action associated 25
with a probe when a set of probes are simultaneously activated. Global variables are allocated and instantiated when they are first assigned to. Global variables, however, are subject to the semantics of the underlying architecture’s cache coherence mechanism. Global variables exhibit two failure modes: • The variable could not be allocated. • The use of a global variable has caused a fault. The former eventually manifests through the latter failure mode at every program point where the variable is dereferenced, but we have included it as a separate failure mode because DTrace currently increments a counter to indicate that a variable could not be allocated and because whenever a D variable that was not mapped is used, but not dereferenced as a pointer, it behaves as if the value of that variable is zero (0).
3.4.2
Built-in variables
Similarly to global variables, built-in variables are accessible to the programmer at any point in the script. The main difference between built-in variables and global variables are their semantics. D built-in variables are not mutable and are thus not subject to the concurrency semantics of the underlying architecture. Unlike global variables, built-in variables are guaranteed to never cause a page fault and thus can be accessed safely. It is up to the DTrace implementation to ensure that access to these variables is race-free and reliable.
3.4.3
Thread-local variables
As previously mentioned, thread-local variables are identified with their name and a thread ID. The motivation behind them is to have a pragmatic way to carry state around probes in a race-free way, as a thread can only be scheduled on a single CPU. The failure modes exposed by thread-local variables are the those of global variables – however, thread-local variables do not suffer the problem of relying on the underlying architecture’s cache coherence semantics under the assumption that each software thread can only be scheduled on one CPU and runs with interrupts off in the DTrace probe context.
3.4.4
Clause-local variables
Clause-local variables in DTrace are defined across a single probe. Note that this does not mean that they are only usable within a single probe clause, but instead for all of the clauses of a given probe. If a clause-local variable is used before it is defined in a given probe firing, its value is undefined and depends on the implementation. A good compiler will warn the programmer about such misuse of a clause-local variable.
3.5
Aggregations
The ability to aggregate data during data collection, and to then process the data via several types of statistical analysis, is one of the key features of OpenDTrace. The data for an aggregation is collected, like all other trace data, by the kernel, while the data processing is carried out in user space by the libdtrace library functions. 26
Function count min max avg sum stddev quantize lquantize llquantize
Pseudo-code x=x+1 x = x > arg ? arg : x x = x > arg ? x : arg x = sum / len x = x + arg N/A N/A N/A N/A
Description Counts the number of occurrences of some argument Computes the minimum of all values seen Computes the maximum of all values seen Averages out the values seen Sums up all of the values that are seen The standard deviation over a set of values Power-of-two frequency distribution over a set of values Linear frequency distribution over a specified range. Linear frequency distribution within a logarithmic distribution
Table 3.1: Aggregation Functions Aggregating functions are a set of functions that can operate on partial data and achieve the same result as if they had operated on all of the data at once. There are nine (9) aggregating functions, which are listed in Table 3.1. The first five aggregating functions (count(), min(), max(), avg(), and sum()) are simple enough that pseudo-code can be supplied within Table 3.1 while the next three functions: stddev(), quantize() and lquantize(), should be understood in their mathematical expression. The llquantize() function is specific to OpenDTrace, and was written by Bryan Cantrill while at Joyent. The purpose of llquantize() is to aggregate data logarithmically over a specified range of magnitudes, but use a frequency distribution within each of the magnitude.
3.6
Subroutines
OpenDTrace subroutines are built into the D language and run inside the operating system kernel. The programmer cannot create their own subroutines inside the D language itself, but new ones can be added as a part of the D language runtime. All of the parameters are type-checked during every call, however the safety of using these subroutines depends on the safety of DTrace action and the DIF emulator. The subroutines currently supported are given in Table 10.2.
3.7
Translators
OpenDTrace translators serve the purpose of providing a way to translate between different data types for D scripts. The main motivation behind translators is to translate C types that are a part of the operating system to a stable user-defined data type to avoid having to change the script when the operating system implementation changes, however, they do work for any D type. In a sense, translators define a two way map1 between two types. This enables the compiler to translate between these two data types either as a part of the runtime or statically at compile-time. 1
A translator creates an isomorphism between types.
27
dtrace:::BEGIN { num_syscalls = 0; } syscall:::entry { num_syscalls++; } dtrace:::END { printf("Number of syscalls: %d\n", num_syscalls); }
Figure 3.2: Global Variable Usage
3.8
Multithreading
When tracing, OpenDTrace guarantees that it can not be preempted inside of a probe firing, but it does not guarantee that everything in the executing DIF will be thread-safe. OpenDTrace does not allow access to locking primitives, because a programming error might violate the safety guarantees that OpenDTrace was designed to provide. The memory that OpenDTrace works with is currently guaranteed to be sequentially consistent, however, this is not a good assumption to make across implementations and one should instead rely on the underlying multicore semantics of the CPU.
3.8.1
Global variables
Global variables are not stored in thread-local storage, while thread-local and clause-local variables are. In a multithreaded environment, global variables should be used sparingly. While it is evident that a value stored in a global variable may be overwritten by another probe at any time, there is more subtle behavior at hand. Consider the script in Figure 3.2. Because DIF performs all of its operations on a virtual machine’s registers as opposed to variables in memory, the ++ operator is not atomic. Compiling the syscall:::entry clause from Figure 3.2 generates the DIF shown in Figure 3.3. This DIF section is safe, as long as the num syscalls variable is not visible from any other thread. If it is visible and accessible from another thread, it suffers from a race condition which results in wrong information being given to the user. The race condition is shown in Figure 3.4. It is clear that the value in the r2 register will be lost because the register r4 is stored to the same location afterwards. It is worth noting that this behavior is not observed because the thread was preempted, but simply by the fact that DTrace does not guarantee any ordering outside of each CPU core. This behavior applies to all of the operations performed on global variables and as a result, they should only be used in probes that are guaranteed to fire on a 28
ldgs setx add stgs
%r1, %r2, %r2, %r2,
num_syscalls inttab[0] %r1, %r2 num_syscalls
/* /* /* /*
Load the current value into %r1 */ Load 1 into %r2 */ Add %r1 and %r2 and store into %r2 */ Store the result back into num_syscalls */
Figure 3.3: DIF Assembly
Thread 1 ldgs %r1, num_syscalls
Thread 2 ldgs %r3, num_syscalls setx %r4, inttab[0] add %r4, %r3, %r4
setx %r2, inttab[0] add %r2, %r1, %r2 stgs %r2, num_syscalls stgs %r4, num_syscalls
Figure 3.4: Race Condition single thread. Often the desired behavior with global variables can be achieved through aggregations. The script shown in Figure 3.2 ought to be written using an equivalent aggregation function, as shown in Figure 3.5.
syscall:::entry { @num_syscalls = count(); } dtrace:::END { printa(@num_syscalls); }
Figure 3.5: Avoiding the race condition 29
30
Chapter 4 Compact C Type Format (CTF) The Compact C Type Format (CTF) encapsulates all of the information needed by OpenDTrace to understand C language types such as integers, strings, floats and structures, as they are represented in the program that is being traced. The goal of having another section just for C type information is to provide a compact representation of the information that usually appears in the debugging sections of object files and executables. The CTF section gives D scripts programmatic access to the names of types making it easier to implement features such as pretty printing of data. CTF only contains data types it does not contain other debugging information, which allows it to be far more compact. The debugging sections on a debug build of the FreeBSD kernel in 2017 take up 78 megabytes of space, while the CTF section in the same kernel take up only 800 kilobytes.
4.1
On-Disk Format
CTF data is stored in its own ELF section within an object file or executable. It is meant to be stored in a format that is both compact and which is properly aligned so that it can be accessed using the mmap (2) system call. File Header
Type Labels
Function Information
Data Objects
Data Types
String Table
Figure 4.1: CTF Stable Storage Format Figure 4.1 shows all of the components of the CTF section as they would be found on stable storage. The file header stores a magic number and version information, encoding flags, and the byte offset of each of the sections relative to the end of the header itself. As of this writing the most current version of CTF is version two (2). The preamble, including the magic number, version and flags, take up the first 32 bits of the header, the remaining fields take up 32 bits each, independent of the word size of the architecture. The CTF section makes heavy use of references between the sub-sections to fully describe the data-types in a program as well as the functions, the function’s argument list, and the function’s return value. The data objects and functions sections depend upon the type section, which encodes all of the data-types that have been during the CTF conversion process. Each type has a unique number and name, as well as a size and encoding. Types may refer 31
31
16
magic
8
version
0
flags
reference to parent label reference to basename of parent label section offset function section offset type section offset string section offset size of string section (bytes)
Figure 4.2: Overall CTF section encoding 31
16
0
name size or type
info
Figure 4.3: A simple type to other, more primitive types by use of a reference, e.g. a uint32_t will actually refer to a unsigned int. Types are broken up by what they represent, referred to as their kind. Table 4.1 lists the kinds of base data types that are encoded by CTF. Complex data types, such as structures, are also contained in the types section, and are encoded as a structure with a name that references the string table. A simple type, one who’s size is less than 64 Kbytes, is stored in a ctf_stype, shown in Figure 4.3. The name is a reference to a string in the string table. The info field is encoded differently for each type, as will be explained fully in the rest of this chapter. The last field is either the size, in bytes, of the structure or it is a reference to another type, encoded using the referenced type’s ID. The majority of types in a C program will fit within a ctf_stype. Types that are larger than 64Kbytes are encoded using a ctf_type structure, shown in Figure 4.4. The name and info fields of this, larger, ctf_type are the same as the smaller ctf_stype, but the size field is always set to CTF_LSIZE_SENT, the sentinel value that 31
16
0
name size or type
info
high 32 bits of size (in bytes) low 32 bits of size (in bytes)
Figure 4.4: A large type 32
CTF_K_UNKNOWN CTF_K_INTEGER CTF_K_FLOAT CTF_K_POINTER CTF_K_ARRAY CTF_K_FUNCTION
CTF_K_STRUCT CTF_K_UNION CTF_K_ENUM CTF_K_FORWARD CTF_K_TYPEDEF CTF_K_VOLATILE CTF_K_CONST CTF_K_RESTRICT
unknown type (used for padding) variant data is CTF_INT_DATA() (see below) variant data is CTF_FP_DATA() (see below) ctf_type is referenced type variant data is single ctf_array_t ctt_type is return type variant data is list of argument types (ushort_t’s) variant data is list of ctf_member_t’s variant data is list of ctf_member_t’s variant data is list of ctf_enum_t’s no additional data; ctt_name is tag ctf_type is referenced type ctf_type is base type ctf_type is base type ctf_type is base type
Table 4.1: Kinds of CTF Base Types 10 9
15
kind
0
r
vlen
Figure 4.5: Info field encoding tells the consumer that this is a larger structure. A ctf_type structure can encode an extremely large type, since it provides 64 bits for the size, and that size is expressed in bytes. The info field, shown in Figure 4.5, is further broken down into a number of sub-fields which encoded the kind, vlen (variable length) and whether or not this is a root type isroot. Each of the integral types, such as integers, floats, pointers, arrays, etc. has its own encoding. Integers are the simplest type and are unsigned by default. An integer type is encoded in a single, 32 bit, field, as seen in Figure 4.6. The flags field indicates whether the integer is signed, contains character data, is a boolean or is to be displayed with a vargs style of formatting. Floating point numbers have the exact same fields to describe them but a larger number of possible flags, to match the larger number of ways in which floating point numbers may be stored. The flags and descriptions of the currently supported floating point encodings are given in Table 4.1. The functions section encodes the function name, as well as its arguments and return value. The types of the arguments and the return value reference the types section. The arguments to the function are encoded as a list. All strings are encoded in the string table and are referenced by a numeric id from the other sections. 31
16
24
flags
offset
0
size in bits
Figure 4.6: Integral type encoding 33
CTF_FP_SINGLE CTF_FP_DOUBLE CTF_FP_CPLX CTF_FP_DCPLX CTF_FP_LDCPLX CTF_FP_LDOUBLE CTF_FP_INTRVL CTF_FP_DINTRVL CTF_FP_LDINTRVL CTF_FP_IMAGRY CTF_FP_DIMAGRY CTF_FP_LDIMAGRY
IEEE 32-bit float encoding IEEE 64-bit float encoding Complex encoding Double complex encoding Long double complex encoding Long double encoding Interval (2x32-bit) encoding Double interval (2x64-bit) encoding Long double interval (2x128-bit) encoding Imaginary (32-bit) encoding Long imaginary (64-bit) encoding Long long imaginary (128-bit) encoding
Table 4.2: Floating Point Encodings for CTF
34
Chapter 5 Trace buffer OpenDTrace specifies an Application Binary Interface (ABI) between kernel and userspace in the form of trace and aggregations buffers along with the associated metadata used to interpret these buffers e.g. for further processing or formatting in order to generate results passed back to the user. This chapter specifies the format of the OpenDTrace trace and aggregation buffers, and metadata data structures used to interpret them.
5.1
Enabling
Each enabled probe is associated with a set of actions through its Enabling Control Block (ECB). When a probe fires these actions are performed. The execution of these actions potentially results in data being written into one or more trace buffers.
5.1.1
OpenDTrace trace buffer
Each OpenDTrace consumer is associated with a set of in-kernel, per-CPU buffers [2]. The format of the OpenDTrace trace buffer is shown in Figure 5.1. The length of the data for each trace record is not specified by the OpenDTrace trace buffer itself because trace records are specified as Type-Value (TV) rather than Type-Length-Value (TLV). Instead, a separate stream of metadata is used to interpret the trace buffer. The data structures describing the metadata stream are described in Section 5.1.2. EPID timestamp
data
... EPID timestamp
Record0
data
Recordn
Figure 5.1: OpenDTrace trace buffer format.
• EPID: identifies the enabling (that is, the enabled probe) that produced the trace record; the identifier type is dtrace epid t which corresponds to a unsigned 32 bit integer. These identifiers are unique for each OpenDTrace consumer. 35
• timestamp: the timestamp, in nanoseconds, of the trace record; the timestamp type is an unsigned 64 bit integer. • data: the data for the trace record; a sequence of octets the format of which is specified by the trace metadata see Section 5.1.2.
5.1.2
Trace metadata
The metadata required to interpret an enabled probe is constant over the lifetime of the enabling [2], which allows trace metadata to be queried from the kernel once, on first processing a given enabling, and is then cached locally. The separation of trace records and the metadata required to interpret them is an important design decision. The separation simplifies the runtime analysis of the trace data but comes at the expense of some flexibility, for example, the ability change an enabling at runtime. Figure 5.2 provides an overview of the data structures, and their relationships, used by libdtrace when interpreting the contents of a OpenDTrace trace buffer. struct dtrace probedata The struct dtrace probedata, shown in Figure 5.3, is used solely by libdtrace and collects the information required to process the OpenDTrace trace buffer, including the metadata describing the enabling, a pointer to the copy of the trace buffer and formatting information, such as the flow prefix and indent—used when the OpenDTrace is invoked with the flowindent option enabled. • The dtpda handle field contains a pointer to the handle returned to OpenDTrace consumer on invoking dtrace open(). • The dtpda edesc and dtpda pdesc fields are described in Sections 5.1.2 and 5.1.2 respectively. • The dtpda cpu field identifies the CPU on which the probe fired. • The dtpda data field contains a pointer to the OpenDTrace trace buffer (see Section 5.1.1). • The dtpda flow field specifies the flow type (either DTRACEFLOW ENTRY, DTRACEFLOW RETURN or DTRACEFLOW NONE). The flow field is set when the DTrace option flowindent is true; the value of dtpda flow depends on whether a return (::return) or entry (::entry) probe is being traced. • The dtpda prefix field contains a pointer to a C String containing the flow prefix (nominally “-i” for entry probes and “h-” for return probes). • The dtpda indent field specifies the value of the flow indent (that is the number of characters currently indented). • The dtpda timestamp field contains the timestamp of the trace record extracted from the OpenDTrace trace buffer (see Section 5.1.1). 36
struct dt pfarvg pfv dtp: dtrace hdl t * pfv format: char * pfv argv pfv argc: uint t pfv flags: uint t
struct dt pfarvgd
struct dt pfconv
pfd prefix: const char *
pfc name : const char *
pfd preflen: char *
pfc ofmt: const char *
pfd fmt: char[8]
pfc tstr: const char *
pfd flags: uint t
pfc check: dt pfcheck f
pfd width: int
pfc print: dt pfprint f
pfd dynwidth: int
pfc cctfp: ctf file t *
pfd prec: int
pfc ctype: ctf id t
pfd conv
pfc dctfp: ctf file t *
pfd rec
pfc dtype: ctf id t
pfd next: struct dt pfargd *
pfc next: struct dt conv * struct dtrace recdesc t
struct dtrace eprobedesc struct dtrace probedata dtpda handle: dtrace hdl t * pdtpda edesc dtpda pdesc dtpda cpu: processorid t
dtepd epid: dtrace epid t dtepd probeid: dtrace id t dtepd uarg: uint64 t dtepd size: uint32 t dtepd nrec: int
dtrd action: dtrace actkind t dtrd size: uint32 t dtrd offset: uint32 t dtrd alignment: uint16 t dtrd format: uint16 t dtrd arg: uint64 t
dtepd rec
dtpda data: caddr t dtpda flow: dtraace flowkind t dtpda prefix: const char * dtpda indent: int dtpda timestamp: uint64 t
dtpd id: dtrace id t dtpd provider: char [] dtpd mod: char [] dtpd func: char [] dtpd name: char [] struct dtrace probedesc
Figure 5.2: Overview of the data structures used to interpret the OpenDTrace trace buffer
37
struct dtrace probedata dtpda handle: dtrace hdl t * pdtpda edesc dtpda pdesc dtpda cpu: processorid t dtpda data: caddr t dtpda flow: dtraace flowkind t dtpda prefix: const char * dtpda indent: int dtpda timestamp: uint64 t Figure 5.3: Data structure used to aggregate the details of the trace buffer and the metadata required to interpret it. struct dtrace eprobedesc The struct dtrace eprobedesc (Figure 5.4) specifies an enabled probe. Specifically, struct eprobedesc contains metadata required to process the OpenDTrace trace buffer. The struct dtrace eprobedesc is returned from the kernel to userspace by invoking the EPROBE ioctl. struct dtrace eprobedesc dtepd epid: dtrace epid t dtepd probeid: dtrace id t dtepd uarg: uint64 t dtepd size: uint32 t dtepd nrec: int dtepd rec Figure 5.4: Data structure used to describe an enabled probe. • The dtepd epid field contains the enabled probe’s identifier; the identifier type is dtrace epid t which corresponds to a unsigned 32 bit integer. • The dtpd id field contains the probe’s identifier; the identifier type is dtrace id t which corresponds to a unsigned 32 bit integer. • The dtepd uarg field is a library argument1 . • The dtepd size field specifies the size of the OpenDTrace trace buffer (a pointer to the trace buffer is held in the struct dtrace probedata structure. 1
I’m uncertain when this is used, and whether it is relevant when in printing trace records
38
• The dtepd nrec field specifies the number of records in the dtepd rec field. • The dtepd rec field is a variable sized array (of dtepd nrecs entries); this data structure is described in Section 5.1.2. struct dtrace probedesc The struct dtrace probedesc (Figure 5.5) specifies a given probe. The dtrace probedesc structure is constructed within the kernel from the corresponding struct dof probedesc. The struct dtrace probedesc is returned from the kernel to userspace by invoking the PROBES ioctl. struct dtrace probedesc dtpd id: dtrace id t dtpd provider: char[] dtpd mod: char[] dtpd func: char[] dtpd name: char[] Figure 5.5: Data structure used to describe a probe. • The dtpd id field contains the probe’s identifier; the identifier type is dtrace id t which corresponds to a unsigned 32 bit integer. • The dtpda provider field contains a C string specifying the probe’s provider name; the provider type is an char array or size DTRACE PROVNAMELEN (nominally 64 characters). • The dtpda mod field contains a C string specifying the probe’s module name; the provider type is an char array or size DTRACE MODNAMELEN (nominally 64 characters). • The dtpda func field contains a C string specifying the probe’s function name; the provider type is an char array or size DTRACE FUNCNAMELEN (nominally 192 characters). • The dtpda name field contains a C string specifying the probe’s name; the provider type is an char array or size DTRACE NAMELEN (nominally 64 characters). struct dtrace recdesc The struct dtrace recdesc (Figure 5.6) specifies an individual trace record within the trace buffer. Each OpenDTrace action produces a separate trace record. And actions have a one-to-one correspondence with a DIFO (DTrace Intermediate Format Object). For example, printf("%s", probefunc) produce a single DIFO and therefore a single action and record. Whereas, prinf("%s %s", probefunc, arg0); will produce two DIFOs and therefore two actions and records. 39
struct dtrace recdesc t dtrd action: dtrace actkind t dtrd size: uint32 t dtrd offset: uint32 t dtrd alignment: uint16 t dtrd format: uint16 t dtrd arg: uint64 t dtrd uarg: uint64 t Figure 5.6: Data structure used to describe a individual record in the trace buffer. • The dtrd action field specifies the “action” of the trace record; for printf the action is DTRACEACT PRINTF. The value of dtrd action is used by libdtrace to determine how the trace record is processed. • The dtrd size field contains the size (in bytes) of the trace record; this is computed within the kernel based on the CTF (Compact Type Format) type of the value being written to the trace buffer. • The dtrd offset field contains the offset (in bytes) into the OpenDTrace trace buffer at which the trace record is located; the offset is computed within the kernel and is based on the size and alignment of the preceding records. • The dtrd alignment field contains the specified alignment (in bytes) of the trace record; the alignment is based on the trace record’s CTF type. • The dtrd format field contains an identifier used to lookup format information by invoking the function dt format lookup(). Format data is copied from the kernel to the userspace consumer by invoking the FORMAT ioctl. In the case of a printf action the format data is stored as a struct dt pfargv (see Section 5.1.2). • The dtrd arg field is unused when printing. • The dtrd uarg field is unused when printing. struct dt pfargv The struct dt pfargv (Figure 5.7) is used solely by libdtrace. This data structure acts as a container for data structures that define a set of format codes (such as %s or %2d) used by the printf action. • The pfv handle field contains a pointer to the handle returned to OpenDTrace consumer on invoking dtrace open(). • The pfv format field points to a C String containing the format string. For example, if the action is printf("\"event\": %s", probefunc);, the format string contains "\"event\": %s". 40
struct dt pfarvg pfv dtp: dtrace hdl t * pfv format: char * pfv argv pfv argc: uint t pfv flags: uint t Figure 5.7: Data structure used to describe the formatting of a printf action. • The pfv argv field is described in Section 5.1.2. • The pfv argc field contains the number of entries in the list pointed to by the pfv argv field. • The pfv flags field contains flags used for validating the the format arguments. struct dt pfargd The struct dt pfargd (Figure 5.8) is used solely by libdtrace. This data structure defines an individual printf format code (such as %s). struct dt pfarvgd pfd prefix: const char * pfd preflen: char * pfd fmt: char[8] pfd flags: uint t pfd width: int pfd dynwidth: int pfd prec: int pfd conv pfd rec pfd next: struct dt pfargd * Figure 5.8: Data structure used to describe a format code used by the printf action.
• The pfd prefix field points to C string that contains the format string passed to printf. • The pfd preflen field contains the length in bytes of the prefix (pfd prefix). For example, for the prefix ”\”event\”: %s” the pfd preflen will be 9 (the number of characters preceding the format code %s). 41
• The pfd fmt field contains the format code (for %s this field will contain the value s). • The pfd flags field contains a set of flags. As with printf in the C language, formatting flags can be used to control whether, for example, the printed values are left aligned or preceded by zeroes. • The pfd width field contains the width, for example when printing printf("%3d", value); the pfd width field contains three (3). • The pfd dynwidth field contains the dynamic width; for example, when printing printf("%*d", width, value); the dynwidth is the value of width. • The pfrdv prec field contains the precision. • The pfd conv field points to a data structure used to handle a specific format code (such as %s). The printf format conversion dictionary ( dtrace conversions) can be found in the file dt prinf.c. • The pfd rec field contains a pointer to the record that the format code (modifiers and flags) applies to. • The pfd next field contains a pointer to the next struct pfargd in the list or NULL if there are no further entries.
5.2 5.2.1
Aggregations OpenDTrace aggregation trace buffer
Figure 5.9 presents an overview of an OpenDTrace aggregation trace buffer: Record0 AGGID key
records
Recordn
value
... AGGID key
...
keys
Aggregation keys Aggregation metadata
Figure 5.9: OpenDTrace aggregation trace buffer.
42
value
• AGGID: identifies the aggregation corresponding to the trace record; the identifier type is dtrace aggid t which corresponds to a unsigned 32 bit integer. • key: the key of the aggregation entry. (Note that OpenDTrace supports compound keys such as @a[probefunc, arg0] = count();.) • value: the value corresponding to the key. In the case of an aggregation such as count() or min() the value contains the current count or minimum value respectively. In other cases, such as computing the average, the value may consist of a tuple. For example, as computing an average does not distribute over addition, when computing avg(timestamp - self->ts) the aggregating function stores both the running sum of timestamp - self->ts and the number of times the avg() function was called. These values are then used to compute the average at the point when the aggregation is actual printed (by libdtrace). Note that neither the length of the key (or keys) or the length of the aggregation value is specified by the OpenDTrace trace aggregation buffer. Instead, a separate stream of metadata is used to interpret the trace buffer. The data structures describing the metadata stream are described in Section 5.2.2.
5.2.2
Data structures
struct dtrace aggdesc The struct dtrace aggdesc, shown in Figure 5.10, contains the metadata required to interpret trace records from a given aggregation. The struct dtrace aggdesc is returned from the kernel to userspace by invoking the AGGDESC ioctl. struct dtrace aggdesc dtagd name: char * dtagd varid: dtrace aggvarid t dtagd flags: int dtagd id: dtrace aggid t dtagd epid: dtrace epid t dtagd size: uint32 t dtagd nrecs: int dtagd pad: uint32 t dtagd rec[1]: dtrace recdesc t Figure 5.10: Data structure used to describe an aggregation. • The dtagd name field is used to store the name of the aggregation (that is, the identifier used in the OpenDTrace script, for example, @a). It should be noted that this name is not known within the kernel and is therefore not returned by the AGGDESC ioctl call. 43
Correlating the AGGID (stored in the dtagd id field) with the userspace identifier and name is described in further detail below. • The dtagd varid field contains id assigned to the aggregation during the compilation. This value is not known within the kernel and is therefore not returned by the AGGDESC ioctl. • The dtagd flags field contains a set of flags that apply to the aggregation; in the current implementation a single flag DTRACE AGD PRINTED is present. When set, DTRACE AGD PRINTED indicates that the aggregation has been printed. • The dtagd id field contains the identifier assigned to the aggregation. Currently OpenDTrace identifies both aggregations and enablings with simple numerical identifiers (32-bit unsigned integers). The value of these identifiers depends on the current kernel state. For example aggregation identifiers are assigned by a kernel unit allocator (vmem alloc() on Illumos and alloc unr() of FreeBSD). The value returned by the allocator is clearly dependent on previous allocated/freed values, which in turn depends on the current OpenDTrace enablings. • The dtagd epid field contains the identifier of the enabling (that is, the enabled probe identifier). • The dtagd size field contains the size of the aggregation; that is, the total size of the aggregation trace record (see Figure 5.9). • The dtagd nrecs field contains the number of records in the dtagd rec field. • The dtagd pad field points to a data structure used to handle a specific format code (such as %s).2 . • The dtagd rec field is a variable sized array (of dtagd nrecs entries); this data structure is described in Section 5.1.2. As with probes, the struct dtrace recdesc data structures contain metadata necessary to parse trace records in the aggregation trace buffer (see Figure 5.9). In the case of aggregations, these data structures define the location of the key (or sets of keys) and the value; note that the value is always defined by the last record description. Both the kernel and userspace independently name aggregations. In the kernel, aggregations are named with a kernel specific unit allocator, such as alloc unr in FreeBSD. In contrast, userspace assigns an identifier to the aggregation at compilation time. The dtagd varid field is used to contain the compile time identifier for the aggregation. This is determined by inspecting the dtag rec[0].dtrd uarg field; that is, the first record description’s dtrd uarg field. The value of dtrd uarg is cast as a dtrace stmdesc t allowing the compiler assigned identifier and the user assigned name of the aggregation to be determined. With anonymous enablings the connection between the aggregation identifiers created at compilation and execution time is broken. Instead, all aggregations are assigned DTRACE AGGVARIDNONE3 2
The printf format conversion dictionary ( dtrace conversions) can be found in the file dt printf.c 3 Note as the aggregation name can’t be determined it cannot be included in the printed output.
44
struct dtrace aggkey The struct dtrace aggkey (Figure 5.10) is used to represent a key within a given aggregation. This data structure is used solely within the kernel and thus should be considered as part of the implementation and not part of a public ABI. struct dtrace aggkey dtak hashval: uint32 t dtak action: uint32 t dtak size: uint32 t dtak data: caddr t dtak next: struct dtrace aggkey * Figure 5.11: Data structure representing a key within the aggregation hash table.
• The dtak hashval field contains the hash value of the key; the hash value is computed using the Jenkins’s “one-at-a-time” hash function. • The dtak action field identifies the aggregating function that applies to this aggregation. The dtak action field is 4-bits in length allowing 16 aggregation functions, of which 9 are currently defined: 1. count(), 2. min(), 3. max(), 4. avg(), 5. sum(), 6. stddev(), 7. quantize() power of 2 quantization, 8. lquantize() linear quantization and 9. llquantize() log-linear quantization. • The dtak size field contains an offset from the start of the aggregation record to the value, thus it is the combined size of the aggregation and the key (or set of keys). • The dtak data field contains a pointer to the data corresponding to this key; that is, the key’s corresponding record in trace buffer (see Figure 5.9). • The dtak next field contains a pointer to the next aggregation key in this list (the hash table is implemented with separate chaining using a linked list). 45
struct dtrace aggbuffer The struct dtrace aggbuffer (Figure 5.11) specifies the metadata for an aggregation. The data structure is used solely within the kernel and thus should be considered as part of the implementation. 4 . struct dtrace aggbuffer dtagb hashsize: uintptr t dtagb free: uintptr t dtagb hash: dtrace aggkey t ** Figure 5.12: Data structure used to describe an aggregation. • The dtagb hashsize field is used to store the number of buckets in the hashtable used to stored aggregations; in the current implementation the hash table accounts for approximately 18 of the total buffer size5 . • The dtagb free field contains a pointer to the location in the OpenDTrace aggregation buffer where new aggregation keys are allocated; as show in Figure 5.9 allocation of keys occurs from the start of the hash table upwards towards the aggregation records. • The dtagb hash field contains a pointer to the hash table used to store aggregations. The relationship between the dtagb free and dtagb hash fields and the OpenDTrace aggregation buffer are shown in Figure 5.13.
4
The comments within the code suggest that the userspace copy of the aggregation buffer doesn’t contain the hash map and associated metadata. However, as the AGGSNAP ioctl is practical identical to the BUFSNAP ioctl, it appears that the data is in the buffer but unused by libdtrace 5 Despite the comment suggesting this value may be changed as a result of performance analysis, there is no evidence that this heuristic has ever been evaluated.
46
Aggregation records
...
dtagb free Aggregation keys dtagb hash struct dtrace aggkey * ...
dtagb hashsize
struct dtrace aggkey * struct dtrace aggbuffer
Figure 5.13: OpenDTrace aggregation trace buffer.
47
48
Chapter 6 OpenDTrace Object Format (DOF) 6.1
Introduction
OpenDTrace programs are persistently encoded in the DOF format so that they may be embedded in other programs (for example, in an ELF file) or in the DTrace driver configuration file for use in anonymous tracing. The DOF format is versioned and extensible so that it can be revised and so that internal data structures can be modified or extended compatibly. All DOF structures use fixed-size types, so the 32-bit and 64-bit representations are identical and consumers can use either data model transparently.
6.1.1
Stable Storage Format
File Header (dof_hdr_t)
Section Headers (dof_sec_t[…[)
Loadable Section Data
Non-Loadable Section Data
dof_hdr.df_loadsz dof_hdr.dofh_filesz
Figure 6.1: Stable Storage Format When a DOF file resides on stable storage it is stored in the format shown in Figure 6.1. The file header stores meta-data including a magic number, data model for the instrumentation, data encoding, and properties of the DIF code within. The header describes its own size and the size of the section headers. By convention, an array of section headers follows the file header, and then the data for all loadable sections and sections which cannot be loaded, also called unloadable sections. This data layout permits consumer code to easily download the headers and all loadable data into the DTrace driver in one contiguous chunk, omitting other extraneous sections. DOF sections are used both for stable storage and to pass data between user and kernel space, e.g. D programs are sent into the kernel as a dof_prog_rt section. The section headers describe the size, offset, alignment, and section type for each section. Sections are described using a set of #defines that tell the consumer what kind of data is expected. Sections can contain links to other sections by storing a dof_secidx_t, an index 49
into the section header array, inside of the section data structures. The section header includes an entry size so that sections with data arrays can grow their structures. The DOF data itself can contain many snippets of DIF (i.e. more than one DIF object or DIFO), which are represented themselves as a collection of related DOF sections. This allows us to change the set of sections associated with a DIFO over time, and also allows us to encode DIFOs that contain different sets of sections. When a DOF section wants to refer to a DIFO, it stores the dof_secidx_t of a section of type DOF_SECT_DIFOHDR. This section’s data is then an array of dof_secidx_t’s which in turn denote the sections associated with this DIFO. This loose coupling of the file structure (header and sections) to the structure of the DTrace program itself (enabling control block descriptions, action descriptions, and DIFOs) permits activities such as relocation processing to occur in a single pass without having to understand D program structure. Finally, strings are always stored in ELF-style string tables along with a string table section index and string table offset. Therefore strings in DOF are always arbitrary-length and not bound to the current implementation.
50
Name DOF_SECT_NONE DOF_SECT_COMMENTS DOF_SECT_SOURCE DOF_SECT_ECBDESC DOF_SECT_PROBEDESC DOF_SECT_ACTDESC DOF_SECT_DIFOHDR DOF_SECT_DIF DOF_SECT_STRTAB DOF_SECT_VARTAB DOF_SECT_RELTAB DOF_SECT_TYPTAB DOF_SECT_URELHDR DOF_SECT_KRELHDR DOF_SECT_OPTDESC DOF_SECT_PROVIDER DOF_SECT_PROBES DOF_SECT_PRARGS DOF_SECT_PROFFS DOF_SECT_INTTAB DOF_SECT_UTSNAME DOF_SECT_XLTAB DOF_SECT_XLMEMBERS DOF_SECT_XLIMPORT DOF_SECT_XLEXPORT DOF_SECT_PREXPORT DOF_SECT_PRENOFFS
Loadable N N N Y Y Y Y Y Y Y Y Y Y Y Y Y Y Y Y Y N Y Y Y Y Y Y
Comment null section compiler comments D program source code dof_ecbdesc_t dof_probedesc_t dof_actdesc_t array dof_difohdr_t (variable length) uint32_t array of byte code string table dtrace_difv_t array dof_relodesc_t array dtrace_diftype_t array dof_relohdr_t (user relocations) dof_relohdr_t (kernel relocations) dof_optdesc_t array dof_provider_t dof_probe_t array uint8_t array (probe arg mappings) uint32_t array (probe arg offsets) uint64_t array struct utsname structure dof_xlref_t array dof_xlmember_t array dof_xlator_t dof_xlator_t dof_secidx_t array (exported objs) uint32_t array (enabled offsets)
Table 6.1: DOF Section Descriptions
51
52
Chapter 7 OpenDTrace Intermediate Format (DIF) 7.1
The DIF Interpreter
The DTrace Intermediate Format (DIF) interpreter is a virtual machine that executes instructions on behalf of D scripts that are associated with predicates and actions. DIF is a simple, RISC-like, instruction set where each instruction consists of a 32-bit, native-endian integer whose most significant 8 bits contain an opcode allowing the remainder of the instruction to be decoded. While DIF is an interpreter on its own, it is just one of many actions that DTrace can execute. Its purpose is to gather arguments and set up state for all other actions. Each DIF object is executed separately with its own register file, as DIF does not have a notion of a stack. Each DIF object must end with a return instruction which will cause the value in the returned register to be written into the trace buffer. Before DIF is executed, DTrace will perform a sanity check for each of the DIF objects and ensure that they contain valid DIF. The constraints for each DIF instruction will be enumerated in the instruction description in Chapter 8. The following chapter describes the overall implementation of the DIF interpreter as well as how the various instructions are implemented, along with various implementation details. 1 A comprehensive description of OpenDTrace’s instructions are given in Chapter 8 and a full list and description of the built-in subroutines are given in Chapter 10.
7.1.1
Registers
The OpenDTrace virtual machine is made up of eight (8) integer registers and eight (8) tuple registers. The 0th integer register always contains the value zero (0). The tuple registers are used for handling any data type beyond a simple integer, such as strings, and pointers to memory. Each of the tuple registers is made up of a size and value, where the value is a pointer to memory and the size indicates how much memory OpenDTrace will attempt to address. It is the tuple registers that allow D scripts to work with data by reference. All operations are carried out using registers r1 and r2 as operands and rd as the destination for all results. 1
This specification describes the DTrace Intermediate Format version 2, as shipped in Illumos 5, FreeBSD 8-12, and macOS 10.5-10.13
53
Variable cc r cc n cc z cc v cc c
Meaning Value of r1 − r2 Comparison result is negative. Comparison result is 0. Overflow occurred. Is r1 < r2?
Table 7.1: Mathematical Operation Result Bits
7.1.2
Tables
Each DIF Object contains pointers to an integer, string and variable table which are optionally filled in as they are needed. The integer table acts as integer constants that will be operated on during the execution of a D program. The string table contains any string data allocated or used in a D program. Any variables that are used in the program are contained in the variable table.
7.1.3
Math Instructions
Instructions for mathematical operations in DIF have no concept of over or underflow. The division instructions set a flag to indicate a division by zero error.
7.1.4
Comparison and Test Instructions
DIF has three comparison instructions, cmp, scmp and tst which can set various result flags, shown in Table 7.1.4. The result flags are are later used by the branch instructions to determine whether or not the branch is taken. The result flags are never returned directly to the calling DIF program but are only used internally by the interpretation routine.
7.1.5
Branching Instructions
DIF has eleven branch instructions split into two types: signed and unsigned. The signed branching instructions take into account that the number may be negative, while the unsigned instructions are meant to be used with exclusively positive numbers. One thing all of the branching instructions have in common is that they load the new %pc register from the label field in the Branch Format described in Subsection 7.2.2.
7.1.6
Subroutine Calls
Within DIF subroutines are triggered via the CALL instruction. The arguments to these subroutines are passed through the tuple stack. The tuple stack itself is populated using pushtr and pushtv instructions and the return values of the subroutines are provided through the rd register. The subroutine identifier is placed in the idx field of the wide-immediate format (WFormat) described in Subsection 7.2.3. Any subroutine that is provided to DTrace must go via these mechanisms. None of the arguments to subroutines need to be validated before calling the subroutine, as they originate from the previously validated data using other DIF instructions which themselves have validated this data beforehand. 54
7.1.7
Variables
Variables in DIF are just numeric references to simple names within the D script. The space for variables is statically allocated on each invocation of a script. Additionally, variables are identified using the modified register format as described in Subsection 7.2.1 when working with arrays and the W-Format described in Subsection 7.2.3 when working with scalar variables.
7.1.8
Scalars
Scalar variables are loaded into registers using LDGS, LDTS and LDLS and stored to memory from registers using STGS, STTS and STLS for global, thread-local and clause-local scalar variables respectively.
7.1.9
Arrays
Similarly to scalar variables, array variables are loaded into registers using LDGAA and LDTAA and stored to using STGAA and STTAA for global and thread-local array variables respectively. Note that there are no instructions for clause-local array variables.
7.2
Instruction Format
Each instruction consists of a 32-bit, native-endian integer whose most significant 8 bits contain an opcode allowing the remainder of the instruction to be decoded. To ease parsing, three major formats (R, B, and W) are used for all OpenDTrace instructions, capturing different types of operations: register-to-register instructions accepting zero or more register operands; branch instructions accepting a target label as a single operand; and wide-immediate instructions that accept a 16-bit immediate used to capture both small constant values and also indices into various tables.
7.2.1
Register Format (R-Format)
This format accepts zero or more register operands, supporting instructions that include arithmetic and boolean operations, comparison and test operations, load and store operations, tuplestack operations, and the no-op instruction. 31
24 23
op
8 7
16 15
r1
r2
0
rd
op Mandatory 8-bit operation identifier r1, r2 Optional source registers providing input values to the operation rd Optional destination register acting as the destination of the operation A modified version of the Register Format is used when loading and storing data in array variables in OpenDTrace. The main difference between the regular Register Format and the modified one used for arrays, is that the r1 register location is used as the variable identificator, the r2 register itself contains the optional index in the array. 55
31
24 23
op
8 7
16 15
var
0
rd
r2
op Mandatory 8-bit operation identifier var The variable identifier r2 Optional register that contains the index of the array rd Optional destination register acting as the destination of the operation
7.2.2
Branch Format (B-Format)
This format accepts a single 24-bit integer operand identifying the label that is the branch target. It is used solely for the BRANCH instruction. 31
24 23
0
op
label
op Mandatory 8-bit operation identifier label Mandatory 24-bit integer label
7.2.3
Wide-Immediate Format (W-Format)
This format accepts an 8-bit register and 16-bit integer argument (frequently an index). It is used for a range of instructions including those to load values from integer and string constant tables, as well as those that store scalar values in variables. In addition to that, it is used in the CALL instruction in order to specify the rd register and the subroutine identifier. 31
8 7
24 23
op
idx
0
rs|rd
op Mandatory 8-bit operation identifier idx Mandatory 16-bit integer index rs|rd Optional 8-bit register acting as the source or destination of the operation
56
Chapter 8 Instruction Reference This chapter describes the DTrace instruction set. For a discussion of the DIF interpreter as well as an overview of how these instructions are handled see Chapter 7.
8.1
Instruction List
The tables (8.1, 8.2, 8.3, 8.4) in this section summarize all of the instructions available to the D virtual machine. The subroutines listed in in order by their index.
57
Name
Opcode
Description
OR XOR AND SLL SRL SUB ADD MUL SDIV UDIV SREM UREM NOT MOV CMP TST
1 2 3 4 5 6 7 8 9 10 11 12 13 14 15 16
Bitwise Or Bitwise Exclusive Or Bitwise And Shift Left Logical Shift Right Logical Subtract Add Multiply Divide (Signed) Divide (Unsigned) Remainder (Unsigned) Remainder (Signed) Bitwise Not Move Compare Test Equal to Zero See Table 8.3
LDSB LDSH LDSW LDUB LDUH LDUW LDX RET NOP
28 29 30 31 32 33 34 35 36
Load Byte (Signed) Load Halfword (Signed) Load Word (Signed) Load Byte (Unsigned) Load Halfword (Unsigned) Load Word (Unsigned) Load Doubleword Return No Operation See Table 8.4
SCMP LDGA LDGS STGS LDTA LDTS STTS SRA
39 40 41 42 43 44 45 46
String Compare Load from Global Array Load from Global Scalar Store to Global Scalar Load from Thread-Local Array Load from Thread-Local Scalar Store to Thread-Local Scalar Shift Right Arithmatic Table 8.1: R-Format Instruction List (Part 1)
58
Name
Opcode
Description
PUSHTR PUSHTV POPTS FLUSHTS
48 49 50 51
Push a reference onto the tuple stack Push a value onto the tuple stack Pop the tuple stack Flush the tuple stack See Table 8.4
ALLOCS COPYS STB STH STW STX ULDSB ULDSH ULDSW ULDUB ULDUH ULDUW ULDX RLDSB RLDSH RLDSW RLDUB RLDUH RLDUW RLDX
58 59 60 61 62 63 64 65 66 67 68 69 70 71 72 73 74 75 75 77
Allocate scratch space Copy memory of requested size Store byte Store halfword Store word Store doubleword Load user byte (signed) Load user halfword (signed) Load user word (signed) Load user byte (unsigned) Load user halfword (signed) Load user word (signed) Load user doubleword If accessible, load byte (signed) If accessible, load halfword (signed) If accessible, load word (signed) If accessible, load byte (unsigned) If accessible, load halfword (unsigned) If accessible, load word (unsigned) If accessible, load doubleword Table 8.2: R-Format Instruction List (Part 2)
59
Name
Opcode
Description
BA BE BNE BG BGU BGE BGEU BL BLU BLE BLEU
17 18 19 20 21 22 23 24 25 26 27
Unconditional branch Branch if equal to zero Branch if not equal to zero Branch if greater than (signed) Branch if greater than (unsigned) Branch if greater than or equal to (signed) Branch if greater than or equal to (unsigned) Branch if less than (signed) Branch if less than (unsigned) Branch if less than or equal to (signed) Branch if less than or equal to (unsigned) Table 8.3: B-Format Instruction List
Name
Opcode
Description
SETX SETS
37 38
Set register from integer table Set register from string table
CALL
47
Call subroutine
LDGAA LDTAA STGAA STTAA LDLS STLS
52 53 54 55 56 57
Load from global aggregation Load from thread-local aggregation Store to global aggregation Store to thread-local aggregation Load from local scalar Store to local scalar
XLATE XLARG
78 79
Illumos Only Illumos Only Table 8.4: W-Format Instruction List
60
8.2
Individual Instructions
The remainder of this chapter describes each of the instructions available in the D virtual machine in detail. The instructions are arranged in alphabetical order.
61
AND: Bitwise And Format AND %rd, %r1, %r2 31
24 23
0x03
8 7
16 15
r1
r2
0
rd
Description This instruction calculates the bitwise and of the values found in registers r1 and r2, placing the results in register rd. Pseudocode %rd = %r1 & %r2 Load-time constraints The registers r1, r2 and rd must be valid registers and rd must not be r0. Failure modes This instruction has no run-time failure modes beyond its constraints.
62
OR: Bitwise Or Format OR %rd, %r1, %r2 31
24 23
0x01
8 7
16 15
r1
r2
0
rd
Description This instruction calculates the bitwise or of the values found in registers %r1 and %r2, placing the results in register %rd. Pseudocode %rd = %r1 | %r2 Load-time constraints The registers r1, r2 and rd must be valid registers and rd must not be r0. Failure modes This instruction has no run-time failure modes beyond its constraints.
63
SLL: Shift Left Logical Format SLL %rd, %r1, %r2 31
24 23
0x04
8 7
16 15
r1
r2
0
rd
Description This instruction shifts the value found in register %r1 left by the number of bits found in register %r2, placing the results in register %rd. Pseudocode %rd = %r1 > %r2 Constraints Load-time constraints The registers r1, r2 and rd must be valid registers and rd must not be r0. Failure modes This instruction has no run-time failure modes beyond its constraints.
65
XOR: Bitwise Exclusive Or Format XOR %rd, %r1, %r2 31
24 23
0x02
8 7
16 15
r1
r2
0
rd
Description This instruction calculates the bitwise exclusive or of the values found in registers %r1 and %r2, placing the results in register %rd. Pseudocode %rd = %r1 ˆ %r2 Load-time constraints The registers r1, r2 and rd must be valid registers and rd must not be r0. Failure modes This instruction has no run-time failure modes beyond its constraints.
66
SUB: subtract the value in r2 from that in r1 Format SUB %rd, %r1, %r2 31
24 23
0x06
8 7
16 15
r1
r2
0
rd
Description The sub instruction takes the value in r2 and subtracts it from that in r1 placing the result in rd. Pseudocode %rd = %r1 - %r2 Load-time constraints The registers r1, r2 and rd must be valid registers and rd must not be r0. Failure modes This instruction has no run-time failure modes beyond its constraints.
67
ADD: add two values Format add %r1, %r2, %rd 31
24 23
0x07
8 7
16 15
r1
r2
0
rd
Description The add instruction adds the the values in r1 and r2 and pace the results in register rd. Pseudocode %rd = %r1 + %r2 Load-time constraints The registers r1, r2 and rd must be valid registers and rd must not be r0. Failure modes This instruction has no run-time failure modes beyond its constraints.
68
MUL: multiply two numbers Format MUL %rd, %r1, %r2 31
24 23
0x08
8 7
16 15
r1
r2
0
rd
Description The mul instruction multiplies two numbers, contained in r1 and r2, together and places the result in rd. Pseudocode %rd = %r1 * %r2 Load-time constraints The registers r1, r2 and rd must be valid registers and rd must not be r0. Failure modes This instruction has no run-time failure modes beyond its constraints.
69
SDIV: signed division Format SDIV %rd, %r1, %r2 31
24 23
0x09
8 7
16 15
r1
r2
0
rd
Description The sdiv instruction divides the value contained in r2 into that contained in r1 placing the results into rd. The values in both r1 and r2 are first promoted to signed, 64 bit values, before the division operation is carried out. Pseudocode %rd = (int64_t)%r1 / (inst64_t)%r2 Load-time constraints The registers r1, r2 and rd must be valid registers and rd must not be r0. Failure modes This instruction has no run-time failure modes beyond its constraints.
70
UDIV: unsigned division Format UDIV %rd, %r1, %r2 31
24 23
0x0A
8 7
16 15
r1
r2
0
rd
Description The udiv instruction divides the value contained in r2 into that contained in r1 placing the results into rd. Pseudocode %rd = %r1 / %r2 Load-time constraints The registers r1, r2 and rd must be valid registers and rd must not be r0. Failure modes This instruction has no run-time failure modes beyond its constraints.
71
SREM: divide two numbers and store the remainder Format SREM %rd, %r1, %r2 31
24 23
0x0B
8 7
16 15
r1
r2
0
rd
Description The srem instruction divides the value contained in r2 into that contained in r1 placing the remainder into rd. The values in both r1 and r2 are first promoted to signed, 64 bit values, before the division operation is carried out. The srem instruction follows the remainder definition in C99 and will return a negative remainder if applicable. Pseudocode %rd = (int64_t)%r1 % (inst64_t)%r2 Load-time constraints The registers r1, r2 and rd must be valid registers and rd must not be r0. Failure modes This instruction has no run-time failure modes beyond its constraints.
72
UREM: divide two numbers and store the remainder Format UREM %rd, %r1, %r2 31
24 23
0x0C
8 7
16 15
r1
r2
0
rd
Description The urem instruction divides the value contained in r2 into that contained in r1 placing the remainder into rd. Pseudocode %rd = %r1 % %r2 Load-time constraints The registers r1, r2 and rd must be valid registers and rd must not be r0. Failure modes This instruction has no run-time failure modes beyond its constraints.
73
NOT: negate a value Format NOT %rd, %r1 31
24 23
0x0C
8 7
16 15
r1
r2
0
rd
Description The not instruction negates the value found in r1 and places the result into rd. Pseudocode %rd = ˜%r1 Load-time constraints The registers r1 and rd must be valid registers, r2 must be r0 and rd must not be r0. Failure modes This instruction has no run-time failure modes beyond its constraints.
74
MOV: move a value Format MOV %rd, %r1, %r2 31
24 23
0x0D
8 7
16 15
r1
r2
0
rd
Description The mov instruction places the value found in r1 into rd. Pseudocode %rd = %r1 Load-time constraints The registers r1 and rd must be valid registers, r2 must be r0 and rd must not be r0. Failure modes This instruction has no run-time failure modes beyond its constraints.
75
CMP: compare two values Format CMP %rd, %r1, %r2 31
24 23
0x0E
8 7
16 15
r1
r2
0
rd
Description The cmp instruction compares the values in r1 and r2, via subtraction, and sets the various comparison bits based on the results. The comparison bits, shown in Table7.1.4, are used by the branch instructions to make decisions about where the program will execute next. Pseudocode cc_r cc_n cc_z cc_v cc_c
= = = = =
%r1 - %r2; cc_r < 0; cc_r == 0; 0; %r1 < %r2;
Load-time constraints The registers r1 and r2 must be valid registers, rd must be r0. Failure modes This instruction has no run-time failure modes beyond its constraints.
76
TST: Test the value in r1 Format TST %r1 31
24 23
0x0F
8 7
16 15
r1
r2
0
rd
Description The tst instruction checks the value in r1 to see if it is zero (0). Only the Z bit (cc z) is set by this instruction, all other comparison result registers, listed in Table7.1.4 are cleared. Pseudocode cc_n = cc_v = cc_c = 0; cc_z = %r1 == 0; Load-time constraints The register r1 be a valid register, rd and r2 must be r0. Failure modes This instruction has no run-time failure modes beyond its constraints.
77
BA: branch absolute Format BA label 31
24 23
0
0x11
label
Description The ba instruction branches to the label indicated by setting the Program Counter (pc) to the instruction indicated at the label. Pseudocode %pc = label Load-time constraints label must be greater than pc. Moreover, label must not go past the last address of the current DIF object. Failure modes This instruction has no run-time failure modes beyond its constraints.
78
BE: branch equal Format BE label 31
24 23
0
0x12
label
Description The be instruction sets the PC to a new label if, and only if the result of the last cmp or tst set the zero bit (cc z) to a value other than 0. Pseudocode if (cc_z) %pc = label Load-time constraints label must be greater than pc. Moreover, label must not go past the last address of the current DIF object. Failure modes This instruction has no run-time failure modes beyond its constraints.
79
BNE: branch not equal Format BNE label 31
24 23
0
0x13
label
Description The bne instruction sets the PC to a new label if, and only if the result of the last cmp resulted in the zero bit (cc z) being cleared, or set to 0. Pseudocode if (cc_z == 0) %pc = label Load-time constraints label must be greater than pc. Moreover, label must not go past the last address of the current DIF object. Failure modes This instruction has no run-time failure modes beyond its constraints.
80
BG: branch greater than Format BG label 31
24 23
0
0x14
label
Description The bg instruction sets the PC to a new label if, and only if the result of the last cmp resulted in the zero bit (cc z) being set to a value other than 0. Pseudocode if (cc_z) %pc = label Load-time constraints label must be greater than pc. Moreover, label must not go past the last address of the current DIF object. Failure modes This instruction has no run-time failure modes beyond its constraints.
81
BGU: branch greater than, unsigned Format BGU label 31
24 23
0
0x15
label
Description The bgu instruction sets the pc to the new label if, and only if, the result of the previous comparison shows that r1 was greater than r2. Pseudocode if ((cc_c | cc_z) == 0) pc = label; Load-time constraints label must be greater than pc. Moreover, label must not go past the last address of the current DIF object. Failure modes This instruction has no run-time failure modes beyond its constraints.
82
BGE: branch greater than or equal to Format BGE label 31
24 23
0
0x16
label
Description The bge instruction jumps to the supplied label if and only if the result of the previous comparison indicates that the value in register r1 was greater than or equal to the value in r2. Pseudocode if ((cc_n ˆ cc_v) == 0) pc = label; Load-time constraints label must be greater than pc. Moreover, label must not go past the last address of the current DIF object. Failure modes This instruction has no run-time failure modes beyond its constraints.
83
BGEU: branch greater than or equal to, unsigned Format BGEU label 31
24 23
0
0x17
label
Description The bgeu instruction jumps to the supplied label if and only if the result of the previous comparison indicates that the value in register r1 was greater than or equal to the value in r2. Pseudocode if (cc_c == 0) pc = label; Load-time constraints label must be greater than pc. Moreover, label must not go past the last address of the current DIF object. Failure modes This instruction has no run-time failure modes beyond its constraints.
84
BL: branch less than Format BL label 31
24 23
0
0x18
label
Description The bl instruction jumps to the specified label if and only if the result of the previous comparison instruction indicated that the value in r1 was strictly less than the value in r2. Pseudocode if (cc_n ˆ cc_v) pc = label Load-time constraints label must be greater than pc. Moreover, label must not go past the last address of the current DIF object. Failure modes This instruction has no run-time failure modes beyond its constraints.
85
BLU: branch less than, unsigned Format BL label 31
24 23
0
0x19
label
Description The blu instruction jumps to the specified label if and only if the result of the previous comparison instruction indicated that the value in r1 was strictly less than the value in r2. Pseudocode if (cc_c) pc = label Load-time constraints label must be greater than pc. Moreover, label must not go past the last address of the current DIF object. Failure modes This instruction has no run-time failure modes beyond its constraints.
86
BLE: branch less than or equal Format BL label 31
24 23
0
0x1A
label
Description The ble instruction jumps to the specified label if and only if the result of the previous comparison instruction indicated that the value in r1 was less than, or equal to, the value in r2. Pseudocode if (cc_z | (cc_n ˆ cc_v)) pc = label Load-time constraints label must be greater than pc. Moreover, label must not go past the last address of the current DIF object. Failure modes This instruction has no run-time failure modes beyond its constraints.
87
BLEU: branch less than or equal, unsigned Format BLEU label 31
24 23
0
0x1B
label
Description The bleu instruction jumps to the specified label if and only if the result of the previous comparison instruction indicated that the value in r1 was less than, or equal to, the value in r2. Pseudocode if (cc_c | cc_z) pc = label Load-time constraints label must be greater than pc. Moreover, label must not go past the last address of the current DIF object. Failure modes This instruction has no run-time failure modes beyond its constraints.
88
LDSB: load an 8 bit value Format LDSB %rd, %r1 31
24 23
0x1C
8 7
16 15
r1
r2
0
rd
Description The ldsb instruction loads the value pointed to by r1 into rd, the results register. This instruction is a signed instruction and will perform sign extension on the resulting register when applicable. Pseudocode %rd = %r1 Load-time constraints The registers r1 and rd must be valid registers, r2 must be r0 and rd must not be r0. This instruction is privileged and thus performs no access control checks. It is up to the OpenDTrace implementation to implement that constraint. Failure modes This instruction has no run-time failure modes beyond its constraints.
89
LDSH: load a 16 bit value Format LDSB %rd, %r1 31
24 23
0x1D
8 7
16 15
r1
r2
0
rd
Description The ldsh instruction loads a 16-bit value pointed to by r1 into rd, the results register. This instruction is a signed instruction and will perform sign extenstion on the resulting register when applicable. Pseudocode %rd = %r1 Load-time constraints The registers r1 and rd must be valid registers, r2 must be r0 and rd must not be r0. This instruction is privileged and thus performs no access control checks. It is up to the OpenDTrace implementation to implement that constraint. Failure modes This instruction has no run-time failure modes beyond its constraints.
90
LDSW: load a 32 bit value Format LDSB %rd, %r1 31
24 23
0x1E
8 7
16 15
r1
r2
0
rd
Description The ldsw instruction loads a 32-bit value pointed to by r1 into rd, the results register. This instruction is a signed instruction and will perform sign extension on the resulting register when applicable. Pseudocode %rd = %r1 Load-time constraints The registers r1 and rd must be valid registers, r2 must be r0 and rd must not be r0. This instruction is privileged and thus performs no access control checks. It is up to the OpenDTrace implementation to implement that constraint. Failure modes This instruction has no run-time failure modes beyond its constraints.
91
LDUB: load an unsigned 8 bit value Format LDUB %rd, %r1 31
24 23
0x1F
8 7
16 15
r1
r2
0
rd
Description The ldub instruction loads the value pointed to by r1 into rd, the results register. This is an unsigned instruction and will not perform sign extension in any case. Pseudocode %rd = %r1 Load-time constraints The registers r1 and rd must be valid registers, r2 must be r0 and rd must not be r0. This instruction is privileged and thus performs no access control checks. It is up to the OpenDTrace implementation to implement that constraint. Failure modes This instruction has no run-time failure modes beyond its constraints.
92
LDUH: load an unsigned 16 bit value Format LDSB %rd, %r1 31
24 23
0x20
8 7
16 15
r1
r2
0
rd
Description The lduh instruction loads a 16-bit value pointed to by r1 into rd, the results register. This is an unsigned instruction and will not perform sign extension in any case. Pseudocode %rd = %r1 Load-time constraints The registers r1 and rd must be valid registers, r2 must be r0 and rd must not be r0. This instruction is privileged and thus performs no access control checks. It is up to the OpenDTrace implementation to implement that constraint. Failure modes This instruction has no run-time failure modes beyond its constraints.
93
LDUW: load an unsigned 32 bit value Format LDSB %rd, %r1 31
24 23
0x21
8 7
16 15
r1
r2
0
rd
Description The lduw instruction loads a 32-bit value pointed to by r1 into rd, the results register. This is an unsigned instruction and will not perform sign extension in any case. Pseudocode %rd = %r1 Load-time constraints The registers r1 and rd must be valid registers, r2 must be r0 and rd must not be r0. This instruction is privileged and thus performs no access control checks. It is up to the OpenDTrace implementation to implement that constraint. Failure modes This instruction has no run-time failure modes beyond its constraints.
94
LDX: load 64 bit value Format LDX %rd, %r1 31
24 23
0x22
8 7
16 15
r1
r2
0
rd
Description The ldx instruction loads a 64 bit value pointed to by r1 into rd. Much like conventional RISC architectures, it does not perform sign extension, as this is considered to be the widest type. Pseudocode %rd = %r1 Load-time constraints The registers r1 and rd must be valid registers, r2 must be r0 and rd must not be r0. This instruction is privileged and thus performs no access control checks. It is up to the OpenDTrace implementation to implement that constraint. Failure modes This instruction has no run-time failure modes beyond its constraints.
95
RET: return Format RET %rd 8 7
31
0x23
0
rd
Description The ret instruction returns the value in rd. This instruction also sets the %pc register to the length of the DIFO text section. Pseudocode %pc = textlen Load-time constraints The registers r1 and r2 must be r0 and rd must be a valid register. Failure modes This instruction has no run-time failure modes beyond its constraints.
96
NOP: no operation Format NOP 31
0
0x24
0
Description The nop does nothing and has no side effects on the DTrace virtual machine. Pseudocode nop Load-time constraints The nop instruction has no load-time constraints. Failure modes This instruction has no run-time failure modes beyond its constraints.
97
SCMP: compare two strings Format SCMP %r1, %r2 31
24 23
0x27
8 7
16 15
r1
r2
0
rd
Description The scmp intruction compares the strings pointed to by r1 and r2 and sets the comparison bits for the DIF interpreter based on the result. The length of the the strings is derived by DTrace itself and the comparison is bounded by the DTRACEOPT_STRSIZE option set for the system. Pseudocode cc_r = strncmp(r1, r2, size); cc_n = cc_r < 0; cc_z = cc_r == 0; cc_v = cc_c = 0; Load-time constraints The registers r1 and r2 must be valid registers, rd must be r0. Failure modes The memory locations in r1 or r2 may be paged out, which causes a page fault.
98
LDGA: load a DTrace built-in variable Format LDGA %rd, var, %r2 31
24 23
op
8 7
16 15
var
r2
0
rd
Description The ldga instruction looks up the value of a DTrace built-in variable based on the value in var with an optional array index in the register %r2. Unlike the ldgs, the variable identifier is 8 bits long, and the other 8 bits are used to identify the register which contains the index of the array. Pseudocode index = %r2 %rd = var[index] Failure modes This instruction has no run-time failure modes beyond its constraints.
99
LDGS: Load a user defined variable Format LDGS %rd, %r1, %r2 31
8 7
24 23
0x29
var
0
rd
Description The ldgs instruction has two modes of operation and is intended to be used only for scalar values. The first mode of operation is when the value provided in var is less than DIF VAR OTHER UBASE. This will cause DTrace to look up a pre-defined scalar variable such as curthread, while the second mode of operation will result in looking up a user defined variable in a DIF program. The result of this instruction will be put into the register rd. Unlike the ldga instruction, the var field is 16 bits long, as opposed to 8 bits due to the fact that the variable that is being loaded is a scalar and does not require indexing operations. Pseudocode %rd = var Failure modes This instruction has no run-time failure modes beyond its constraints.
100
STGS: store a value into a variable Format STGS %rd, %r1, %r2 31
8 7
24 23
0x2A
var
0
rd
Description Similar to ldgs, the instruction stgs operates exclusively on scalar variables and can not contain indices. However, the instruction may allow loading of data by reference using the DIF TF BYREF flag, which allows loading of data bounded by the limits found in the dtrace vcanload() function. Unlike ldgs, stgs can not store to pre-defined variables in DTrace, and instead allows access only to user defined variables. The variable is accessed by the var field and is required to be large or equal to DIF VAR OTHER UBASE. The result of this operation is stored in the rd register. Pseudocode assert(var >= DIF_VAR_OTHER_UBASE) var -= DIF_VAR_OTHER_UBASE if (flags & DIF_TF_BYREF) var = copyin(%rd) else var = %rd Failure modes This instruction will fail if the supplied value in the var field is less than DIF VAR OTHER UBASE.
101
LDTA: Load thread local array UNIMPLEMENTED Format LDTA %rd, var, %r2 31
24 23
0x2B
8 7
16 15
var
r2
Description The ldta instruction is unimplemented and reserved for future use. Failure modes This instruction has no run-time failure modes beyond its constraints.
102
0
rd
LDTS: load a value from a thread local variable Format LDTS %rd, %r1, %r2 31
8 7
24 23
0x2C
variable
0
rd
Description The ldts instruction loads data from a thread local variable into the rd register by reference or by value. The DIF_TF_BYREF flag is used to determine the appropriate lookup. Pseudocode %rd = var Failure modes This instruction has no run-time failure modes beyond its constraints.
103
STTS: Store a value into thread local storage Format STTS %rd, %r1, %r2 31
8 7
24 23
0x2D
variable
0
rd
Description The stts instruction takes the value stored in rd and stores it directly, or by reference into a thread local variable. The DIF_TF_BYREF flag is used to determine the appropriate lookup. Pseudocode var = %rd Failure modes This instruction has no run-time failure modes beyond its constraints.
104
SRA: Shift Right Arithmetic Format SRA %rd, %r1, %r2 31
24 23
0x2E
8 7
16 15
r1
r2
0
rd
Description The sra instruction shifts the value in r1 right by the number of bits indicated in r2, placing the results in register rd. This instruction only operates on signed integers. Pseudocode %rd = %r1 >> %r2 Load-time constraints The registers r1, r2 and rd must be valid registers and rd must not be r0. Failure modes This instruction has no run-time failure modes beyond its constraints.
105
PUSHTR: push a reference onto the stack Format PUSHTR type, %r2, %rs 31
24 23
0x30
8 7
16 15
type
r2
0
rs
Description The pushtr instruction pushes a reference, contained in the rs register onto the stack. The length is stored for a string along with the value. For a numeric value the size of that value is stored. Pseudocode value = %rs if type is string: size = strlen(value) else: size = %r2 stack[++index].size = size stack[index].value = value Failure modes This instruction has no run-time failure modes beyond its constraints.
106
PUSHTV: push a value onto the stack Format PUSHTV %rs 31
24 23
0x31
8 7
16 15
r0
r0
0
rs
Description The pushtv instruction takes the value contained in rs register and pushes it onto the stack. Unlike the PUSHTR instruction, the size of the value is not stored along with the value. Pseudocode stack[++index].value = %rs stack[index].size = 0; Failure modes This instruction has no run-time failure modes beyond its constraints.
107
POPTS: pop a value from the stack Format POPTS 8 7
31
0x32
0
0
Description The popts pops the stack, moving the stack’s index to next position down from the top, without returning any value. Pseudocode stack[index--] Load-time constraints The popts instruction has no load-time constraints. Failure modes This instruction has no run-time failure modes beyond its constraints.
108
FLUSHTS: flush the stack Format FLUSHTS 8 7
31
0x33
0
0
Description The flushts instruction flushes the stack, by resetting the stack pointer to 0. Pseudocode %sp = 0; Load-time constraints The flushts instruction has no load-time constraints. Failure modes This instruction has no run-time failure modes beyond its constraints.
109
ALLOCS: allocate a string Format ALLOCS %rd, %r1 31
24 23
0x3A
8 7
16 15
r1
r2
0
rd
Description The allocs instruction allocates a string in the DIF scratch space, based on the size in r1 and returns the pointer to that string in register rd. A failed allocation returns a 0. Pseudocode ptr = scratch_space; scratch_space += size; %rd = ptr Load-time constraints The registers r1 and rd must be valid registers, r2 must be r0 and rd must not be r0. Failure modes This instruction has no run-time failure modes beyond its constraints.
110
COPYS: copy a string Format COPYS %rd, %r1, %r2 31
24 23
0x3B
8 7
16 15
r1
r2
0
rd
Description The copys instruction copies bytes from the string pointed to by r1 and returns them in rd bounded by a size placed into r2. Pseudocode %rd = copy(r1, r2) Load-time constraints The registers r1, r2 and rd must be valid registers and rd must not be r0. Failure modes This instruction has no run-time failure modes beyond its constraints.
111
STB: store a byte into memory Format STB %rd, %r1 31
24 23
0x3C
8 7
16 15
r1
r2
0
rd
Description The stb instruction takes a byte from r1 and stores it into the memory location pointed to by rd. Pseudocode mem[%rd] = %r1 Load-time constraints The registers r1 and rd must be valid registers, r2 must be r0 and rd must not be r0. Failure modes XXXDS: This depends on dtrace canstore(). We have to enumerate these.
112
STH: store a 16 bit value into memory Format STH %rd, %r1 31
24 23
0x3D
8 7
16 15
r1
r2
0
rd
Description The sth instruction takes a 16 bit value from r1 and stores it into the memory location pointed to by rd. Pseudocode mem[%rd] = %r1 Load-time constraints The registers r1 and rd must be valid registers, r2 must be r0 and rd must not be r0. Failure modes XXXDS: This depends on dtrace canstore(). We have to enumerate these.
113
STW: store a 32 bit value into memory Format STW %rd, %r1 31
24 23
0x3E
8 7
16 15
r1
r2
0
rd
Description The stw instruction takes a 32 bit value from r1 and stores it into the memory location pointed to by rd. Pseudocode mem[%rd] = %r1 Load-time constraints The registers r1 and rd must be valid registers, r2 must be r0 and rd must not be r0. Failure modes XXXDS: This depends on dtrace canstore(). We have to enumerate these.
114
STX: store a 64 bit value into memory Format STX %rd, %r1 31
24 23
0x3F
8 7
16 15
r1
r2
0
rd
Description The stx instruction takes a 64 bit value from r1 and stores it into the memory location pointed to by rd. Pseudocode mem[%rd] = %r1 Load-time constraints The registers r1 and rd must be valid registers, r2 must be r0 and rd must not be r0. Failure modes XXXDS: This depends on dtrace canstore(). We have to enumerate these.
115
ULDSB: load signed 8 bit quantity from user space Format ULDSB %rd, %r1, %r2 31
24 23
0x40
8 7
16 15
r1
r2
0
rd
Description The uldsb instruction loads a signed 8 bit quantity from memory in a user space process into the rd register, indexed by r1. This instruction is a signed instruction and will perform sign extension on the resulting register when applicable. Pseudocode %rd = umem[r1] Load-time constraints The registers r1 and rd must be valid registers, r2 must be r0 and rd must not be r0. Failure modes This instruction can cause a page fault if the memory it is trying to access is not paged in.
116
ULDSH: load a signed 16 bit quantity from user space Format ULDSH %rd, %r1, %r2 31
24 23
0x41
8 7
16 15
r1
r2
0
rd
Description The uldsh instruction loads a signed, 16 bit, quantity from memory in a user space process into the rd register, indexed by r1. This instruction is a signed instruction and will perform sign extension on the resulting register when applicable. Pseudocode %rd = umem[r1] Load-time constraints The registers r1 and rd must be valid registers, r2 must be r0 and rd must not be r0. Failure modes This instruction can cause a page fault if the memory it is trying to access is not paged in.
117
ULDSW: load a signed 32 bit quantity from user space Format ULDSW %rd, %r1, %r2 31
24 23
0x42
8 7
16 15
r1
r2
0
rd
Description The uldsw instruction loads a signed 32 bit quantity from memory in a user space process into the rd register, indexed by r1. This instruction is a signed instruction and will perform sign extension on the resulting register when applicable. Pseudocode %rd = umem[r1] Load-time constraints The registers r1 and rd must be valid registers, r2 must be r0 and rd must not be r0. Failure modes This instruction can cause a page fault if the memory it is trying to access is not paged in.
118
ULDUB: load unsigned 8 bit quantity from user space Format ULDUB %rd, %r1, %r2 31
24 23
0x43
8 7
16 15
r1
r2
0
rd
Description The uldub instruction loads a unsigned 8 bit quantity from memory in a user space process into the rd register indexed by r1. This is an unsigned instruction and will not perform sign extension in any case. Pseudocode %rd = umem[r1] Load-time constraints The registers r1 and rd must be valid registers, r2 must be r0 and rd must not be r0. Failure modes This instruction can cause a page fault if the memory it is trying to access is not paged in.
119
ULDUH: load an unsigned 16 bit quantity from user space Format ULDUH %rd, %r1, %r2 31
24 23
0x44
8 7
16 15
r1
r2
0
rd
Description The ulduh instruction loads an unsigned, 16 bit, quantity from memory in a user space process into the rd register, indexed by r1. This is an unsigned instruction and will not perform sign extension in any case. Pseudocode %rd = umem[r1] Load-time constraints The registers r1 and rd must be valid registers, r2 must be r0 and rd must not be r0. Failure modes This instruction can cause a page fault if the memory it is trying to access is not paged in.
120
ULDUW: load an unsigned 32 bit quantity from user space Format ULDUW %rd, %r1, %r2 31
24 23
0x45
8 7
16 15
r1
r2
0
rd
Description The ulduw instruction loads an unsigned 32 bit quantity from memory in a user space process into the rd register, indexed by r1. This is an unsigned instruction and will not perform sign extension in any case. Pseudocode %rd = umem[r1] Load-time constraints The registers r1 and rd must be valid registers, r2 must be r0 and rd must not be r0. Failure modes This instruction can cause a page fault if the memory it is trying to access is not paged in.
121
ULDX: load a 64 bit value from user program memory Format ULDX %rd, %r1, %r2 31
24 23
0x46
8 7
16 15
r1
r2
0
rd
Description The uldx instruction loads a 64 bit value from a user space program’s memory into the rd register, indexed by r1. Much like conventional RISC architectures, it does not perform sign extension, as this is considered the widest type. Pseudocode %rd = umem[r1] Load-time constraints The registers r1 and rd must be valid registers, r2 must be r0 and rd must not be r0. Failure modes This instruction can cause a page fault if the memory it is trying to access is not paged in.
122
RLDSB: restricted load of a signed 8 bit quantity Format RLDSB %rd, %r1, %r2 31
24 23
0x47
8 7
16 15
r1
r2
0
rd
Description The rldsb instruction performs a privilege check on the memory it is about to read from before loading a signed, 8 bit, quantity into rd, indexed by r1. Pseudocode %rd = mem[%r1] Load-time constraints The registers r1 and rd must be valid registers, r2 must be r0 and rd must not be r0. Failure modes XXXDS: This depends on dtrace canload(). We have to enumerate these.
123
RLDSH: restricted load of a signed 16 bit quantity Format RLDSH %rd, %r1, %r2 31
24 23
0x48
8 7
16 15
r1
r2
0
rd
Description The rldsh instruction performs a privilege check on the memory it is about to read from before loading a signed, 16 bit, quantity into rd, indexed by r1. Pseudocode %rd = mem[%r1] Load-time constraints The registers r1 and rd must be valid registers, r2 must be r0 and rd must not be r0. Failure modes XXXDS: This depends on dtrace canload(). We have to enumerate these.
124
RLDSW: restricted load of a signed 32 bit quantity Format RLDSW %rd, %r1, %r2 31
24 23
0x49
8 7
16 15
r1
r2
0
rd
Description The rldsw instruction performs a privilege check on the memory it is about to read from before loading a signed, 32 bit, quantity into rd, indexed by r1. Pseudocode %rd = mem[%r1] Load-time constraints The registers r1 and rd must be valid registers, r2 must be r0 and rd must not be r0. Failure modes XXXDS: This depends on dtrace canload(). We have to enumerate these.
125
RLDUB: restricted load of an unsigned 8 bit quantity Format RLDUB %rd, %r1, %r2 31
24 23
0x4A
8 7
16 15
r1
r2
0
rd
Description The rldub instruction performs a privilege check on the memory it is about to read from before loading an unsigned, 8 bit, quantity into rd, indexed by r1. Pseudocode %rd = mem[%r1] Load-time constraints The registers r1 and rd must be valid registers, r2 must be r0 and rd must not be r0. Failure modes XXXDS: This depends on dtrace canload(). We have to enumerate these.
126
RLDUH: restricted load of an unsigned 16 bit quantity Format RLDUH %rd, %r1, %r2 31
24 23
0x4B
8 7
16 15
r1
r2
0
rd
Description The rlduh instruction performs a privilege check on the memory it is about to read from before loading an unsigned, 16 bit, quantity into rd, indexed by r1. Pseudocode %rd = mem[%r1] Load-time constraints The registers r1 and rd must be valid registers, r2 must be r0 and rd must not be r0. Failure modes XXXDS: This depends on dtrace canload(). We have to enumerate these.
127
RLDUW: restricted load of an unsigned 32 bit quantity Format RLDUW %rd, %r1, %r2 31
24 23
0x4C
8 7
16 15
r1
r2
0
rd
Description The rlduw instruction performs a privilege check on the memory it is about to read from before loading an unsigned, 32 bit, quantity into rd, indexed by r1. Pseudocode %rd = mem[%r1] Load-time constraints The registers r1 and rd must be valid registers, r2 must be r0 and rd must not be r0. Failure modes XXXDS: This depends on dtrace canload(). We have to enumerate these.
128
RLDX: restricted load of a 64 bit quantity Format RLDX %rd, %r1, %r2 31
24 23
0x4D
8 7
16 15
r1
r2
0
rd
Description The rldx instruction performs a privilege check on the memory it is about to read from before loading a 64 bit quantity into rd, indexed by r1. Pseudocode %rd = mem[%r1] Load-time constraints The registers r1 and rd must be valid registers, r2 must be r0 and rd must not be r0. Failure modes XXXDS: This depends on dtrace canload(). We have to enumerate these.
129
SETX: retrieve an integer from the integer table Format SETX %rd, intindex 31
16 15
0x25
rd
8 7
0
index
Description The setx instruction looks up an integer value stored in the DIF integer table and places it into rd. This instruction performs no bounds checking. Pseudocode %rd = inttab[index] Failure modes This instruction has no run-time failure modes beyond its constraints.
130
SETS: retrieve string from the string table Format SETS %rd, strindex 31
16 15
0x26
rd
8 7
0
index
Description The sets instruction looks up a string stored in the DIF string table and places a pointer to the value into rd. This instruction performs no bounds checking. Pseudocode %rd = strtab + index Failure modes This instruction has no run-time failure modes beyond its constraints.
131
CALL: subroutine call Format CALL %rd, %r1, %r2 31
8 7
24 23
0x2F
subroutine
0
rd
Description The call instruction executes a known DTrace subroutine, such as copyinstr(), copyout() etc. and returns any value into rd. Valid subroutines are documented in 7.1.6. Pseudocode %rd = subr() Failure modes This instruction has no run-time failure modes beyond its constraints.
132
LDGAA: load a value from a hash map Format LDGAA key, %rd 31
8 7
24 23
0x34
key
0
rd
Description The ldgaa instruction loads a value into the rd register based on a key. The key is used to lookup the value in a hash map data structure. Pseudocode %rd = map[key] Failure modes This instruction has no run-time failure modes beyond its constraints.
133
LDTAA: load a value from a thread private hash map Format LDTAA var, %rd 31
8 7
24 23
0x35
key
0
rd
Description The ldtaa instruction loads a value into the rd register based on a key. The key is used to lookup the value in a thread private, hash map, data structure. Pseudocode %rd = map[key] Failure modes This instruction has no run-time failure modes beyond its constraints.
134
STGAA: store a value into a hash by key Format STGAA key, %rd 31
8 7
24 23
0x46
key
0
rd
Description The stgaa instruction stores a value, contained in the rd register into a hash map based on a key. Pseudocode map[key] = %rd Failure modes This instruction has no run-time failure modes beyond its constraints.
135
STTAA: store a value into a thread private, hash by key Format STTAA key, %rd 31
8 7
24 23
0x47
key
0
rd
Description The sttaa instruction stores a value, contained in the rd register into a thread private, hash map based on a key. Pseudocode map[key] = %rd Failure modes This instruction has no run-time failure modes beyond its constraints.
136
LDLS: load local variable Format LDLS variable, %rd 31
24 23
0x48
16 15
8 7
variable
Description The ldls instruction loads a local variable into the rd register. Pseudocode %rd = var Failure modes This instruction has no run-time failure modes beyond its constraints.
137
0
rd
STLS: store a value in a local variable Format STLS variable, %rd 31
8 7
24 23
0x49
variable
0
rd
Description The stls instruction takes a value from the rd register and stores it in a variable. Pseudocode var = %rd Failure modes This instruction has no run-time failure modes beyond its constraints.
138
XLATE: Format XLATE %rd, %r1, %r2 31
24 23
0x4E
8 7
16 15
r1
r2
0
rd
Description The xlate instruction extracts translated data indicated at the current translation index and returns the data in rd. NOTE: This instruction is not used by the kernel as all translations are handled in user space. Failure modes This instruction has no run-time failure modes beyond its constraints.
139
XLARG: translation argument Format XLARG %rd, %r1, %r2 31
24 23
0x4F
8 7
16 15
r1
r2
0
rd
Description The xlarg instruction translates a single argument from a structure and returns the tranlsated value in rd. NOTE: This instruction is not used by the kernel as all translations are handled in user space. Failure modes This instruction has no run-time failure modes beyond its constraints.
140
Chapter 9 Built-in Global Variables The D language provides a set of built-in global variables that are available to D scripts from within probe context. The built-in global variables are meant to help script writers and expose information that is commonly uses within C and C++ programs, such as errno for the error number set by the most recent system call, and the pid for the Process Identifier of the currently running process. All global variables in D are read only, including in destructive mode.
9.1
Built-in Variables reference
The following is a list of all of the global variables available to D programs.
141
arg0-9: arguments to the current probe Description The variables arg0 through arg9 contain the arguments to the currently executing probe point. Failure modes Incorrectly dereferencing the probe arguments will result in a run time error in a D program. The program will not exit, but an error will be output on the user’s terminal
142
args[]: array of arguments to the current probe Description The args[] array contains typed versions of all the arguments to the currently executing probe. When a probe has a pointer to a stucture as an argument it must be accessed via the args[] array. Failure modes Incorrectly dereferencing the probe arguments will result in a run time error in a D program. The program will not exit, but an error will be output on the user’s terminal
143
caller: kernel address of the instruction that called this probe Description The caller variable contains the kernel address of the instruction that caused the currently executing probe to fire. Failure modes No known failure modes, caller always contains a valid address, even when probes fire in user space.
144
cpu: The CPU core on which the probe is executing Description The cpu variable contains an integer value indicating the CPU core, on which the probe is executing. CPU cores are numbered from 0 through the maximum present in the system. Failure modes The cpu variable always contains a valid value.
145
cpucycles: number of cycles elapsed on current CPU core Description NOTE: The cpucycles variable is only available on Darwin kernels.
146
cpuinstrs: number of instructions elapsed on current CPU core Description NOTE: The cpuinstrs variable is only available on Darwin kernels.
147
curthread: pointer to the thread structure for the current probe Description The curthread variable points to the kernel’s structure that describes the thread which triggered the currently running probe. Failure modes The curthread variable is always valid.
148
dispatchaddr: Description The dispatchaddr variable is only available on Darwin kernels at the time of this writing.
149
epid: Description The epid variable contains the integer value of the effective probe ID. Each probe enabled during tracing is assigned an effecitve probe ID starting from 1 and increasing monotonically.
150
errno: error number Description The errno variable contains the numeric value of the error number returned by the most recent system call in the program that is executing when the probe fires. The program may be the kernel or a user space program.
151
execname: name of the currently executing process Description The execname variable contains a string that is the name of the currently executing process.
152
gid: group ID of the current process Description The gid variable contains the group ID of the process being traced by the currently executing probe.
153
id: id of the current probe Description The id variable contains the numeric id of the currently executing probe. Failure modes The id variable is always valid.
154
ipl: interrupt level Description NOTE: Thh ipl variable is only available on Darwin kernels. The ipl variable contains the current interrupt level.
155
machtimestamp: current mach absolute time value Description NOTE:The machtimestamp variable is only available on Darwin kernels at the time of this writing.
156
pid: process ID Description The pid variable contains the process ID of the process which is being traced by the currently executing probe. A process ID of zero (0) indicates that the currently running process is the operating system kernel.
157
ppid: parent process ID Description The ppid variable contains the process ID of the parent process to the one which is being traced by the currently executing probe. A parent process ID of zero (0) indicates that the parent of the currently running process is the operating system kernel.
158
probe: the name of the probe currently firing Description The probe variable contains the string name of the probe currently firing.
159
stackdepth: depth of the kernel stack Description The stackdepth variable contains the integer depth of the kernel stack for the thread which is being traced by the currently executing probe.
160
tid: thread ID Description The tid contains the ID of the kernel thread being traced by the currently executing probe.
161
ucaller: user space address Description The ucaller variable contains the user space address of the function that caused the currently executing probe point to fire. If the probe was called from the kernel then this value is 0.
162
uid: user ID Description The uid variable contains the numeric ID of the user which is the owner of the process being traced by the currently executing probe.
163
uregs: user process registers Description The uregs[] array contains the current threads user space register data.
164
ustackdepth: depth of the user stack Description The ustackdepth variable contains the integer depth of the user proces stack for the thread which is being traced by the currently executing probe.
165
vcycles: Description The vcycles variable is only available on Darwin kernels at the time of this writing.
166
vinstr: Description The vinstr variable is only available on Darwin kernels at the time of this writing.
167
vtimestamp: timestamp in nanosecconds Description The vtimestamp variable contains the number of nanoseconds that the current thread has spent running on any core.
168
walltimestamp: human readable timestamp Description The walltimestamp contains a string describing the current time as it would be seen by a human operator.
169
170
Chapter 10 Built-in Subroutines The D language provides a set of built-in global sub-routines that are available to D scripts from within probe context. The built-in global sub-routines provide commonly used functions present in the C and C++ language, such as printf and inet_ntoa but which can be called from probe context without risking system safety.
10.1
Subroutine calling mechanism
Every D subroutine is implemented as a part of the D run time environment and must be implemented according to the safety constraints that DTrace expects. When a subroutine appears in a D script it is the responsibility of the D code generator to turn the subroutine and its arguments into DIF to be passed into the DTrace for execution. Each subroutine has a string name, an identifier type, a set of flags, a numeric ID, a small set of functions, and an argument list. The argument list defined is processed into a relevant set of argument types at the time of opening of the DTrace device. The DIF_OP_CALL instruction, described in Chapter 8, is used by the D code generator to generate a subroutine call. Each call instruction just has an identifier, which is the name of the subroutine. The arguments are placed into D’s tuple stack for use in the subroutine. Once in the execution context of DTrace all subroutines are executed as a part of DIF execution.
10.2
Subroutine list
The tables (10.1, 10.2 in this section summarize all of the subroutines available in the D language. The subroutines listed in in order by their index.
171
Name
Number
Description
rand mutex_owned mutex_owner mutex_type_adaptive mutex_type_spin rw_read_held rw_write_held rw_iswriter copyin copyinstr copyoutmbuf speculation progenyof
0 1 2 3 4 5 6 7 8 9 9 10 11
strlen copyout copyoutstr alloca bcopy
12 13 14 15 16
copyinto msgdsize msgsize getmajor getminor ddi_pathname strjoin lltostr basename
17 18 19 20 21 22 23 24 25
Get random Query whether current thread is mutex owner Retrieve mutex owner Query if mutex is adaptive Query if mutex is a spinlock Query whether rwlock is held for read Query whether current thread holds rwlock for write Query whether rwlock is held for write Copy in data from userspace Copy in string from userspace Copy data from an mbuf chain Reserves space for a speculation buffer Query whether this process the child of a particular PID Return the length of a string Copy data from user process Copy data from user process as a string allocate temporary space copy bytes from source to destination bounded by a size copy data from a source to a destination return the size data in a STREAMS message block return the size data in a STREAMS message block return major device number return minor device number look up device driver by name join two strings and return the result convert a long long (64 bit) value to a string return the file name portion of a pathname
Table 10.1: DTrace Subroutines (Part 1)
172
Name
Number
Description
dirname cleanpath strchr strrchr strstr strtok substr index rindex htons
26 27 28 29 30 31 32 33 34 35
htonl
36
htonll
37
ntohs
38
ntohl
39
ntohll
40
inet_ntop inet_ntoa inet_ntoa6 toupper tolower memref sx_shared_held sx_exclusive_held sx_isexclusive
41 42 43 44 45 46 48 49 50
memstr getf json strtoll
51 52 53 54
random uuidstr
55 56
return the directory component of a pathname return the cleaned up pathname locate a character in a string reverse search a string locate a string within a string string tokenizing subroutine return a sub string of a string return the byte position of a character in a string locate the last matching character in a a string convert a short (16 bit) value from host to network byte order convert a long (32 bit) value from host to network byte order convert a long long (64 bit) value from host to network byte order convert a short (16 bit) value from network to host byte order convert long (32 bit) value from network to host byte order convert a long long (64 bit) value from network to host byte order convert an arbitrary Internet address to a string convert a 32 bit IPv4 address to a string convert a 128 bit IPv6 address to a string convert a string to upper case convert a string to lower case return scratch memory Is this shared mutex currently held by a reader Is this sx mutex held exclusively Is the current thread the only one to hold a shared mutex convert NULL separated strings to one string Return a file structure based on a file descriptor extract a single value from a JSON string convert a string representing a number to a long long (64 bit) value return a better pseudo-random number than rand() convert a UUID to a string
Table 10.2: DTrace Subroutines (Part 2)
173
10.3
Subroutine reference
The remainder of this chapter describes each of the subroutines available in the D language in detail. The subroutines are arranged in alphabetical order.
174
alloca: allocate temporary space Calling convention rd void arg0 Pointer to allocated data or NULL. Description The alloca subroutine allocates scratch space in the DTrace state machine structure. Although this subroutine does not allocate space on the process stack, it does act similarly to the alloca macro, in that the space disappears without an explicit call to a free routine, once the DTrace machine state structure is deallocated. Failure modes This subroutine has no run-time failure modes beyond its constraints.
175
basename: return the file name portion of a pathname Calling convention rd A pointer to a scratch space string containing the filename. arg0 Pathname from which to extract the basename Description The basename subroutine takes a single string argument, containing a path, and returns a pointer to the file name portion of the supplied string. The space for the resulting string is contained in the DTrace machine state structure, mstate which is automatically de-allocated. Failure modes This subroutine has no run-time failure modes beyond its constraints.
176
bcopy: copy bytes from source to destination bounded by a size Subroutine prototype void bcopy(const void *source, void *destination, size_t length); Calling convention rd void arg0 Pointer to the source memory arg1 Pointer to the destination scratch memory arg2 Amount of bytes to copy Description The bcopy subroutine copies bytes from a source pointer to a destination pointer, within the DTrace machine state scratch region, up to the size supplied in the third argument. Pseudocode source = stack[0].value destination = stack[1].value length = stack[2].value if destination not in scratch: return if not can_load(source): %rd = 0 return for i = 0 ... length: destination[i] = source[i] Failure modes This subroutine has no run-time failure modes beyond its constraints.
177
cleanpath: return the cleaned up pathname Calling convention rd A pointer to the scratch space string containing the cleaned up pathname. arg0 Path to clean Description The cleanpath subroutine takes a single string argument, containing a path, and returns a pointer to a string containing the cleaned up pathname. Failure modes This subroutine has no run-time failure modes beyond its constraints.
178
copyin: Copy data from user space to kernel space Calling convention rd void arg0 Address to copy from arg1 Length of data to copy Description The copyin returns a pointer to a buffer which contains kernel data copied from the area pointed to by its first argument, up to the limit denoted by its second argument. Failure modes This subroutine has no run-time failure modes beyond its constraints.
179
copyinto: copy data from a source to a destination Calling convention rd void arg0 Address to copy from arg1 Length of data arg2 Destination address Description The copyinto subroutine copies data from a source pointer into a destination pointer bounded by a size given in the second argument. Failure modes This subroutine has no run-time failure modes beyond its constraints.
180
copyinstr: Copy kernel data as a string Calling convention rd Pointer to the returned string. arg0 Address to copy from arg1 Optional max length Description The copyinstr subroutine returns a pointer to string of kernel data which is located at the first argument and bounded by the second argument. Failure modes This subroutine has no run-time failure modes beyond its constraints.
181
copyout: copy data from a buffer into process address space Calling convention rd void arg0 Pointer to buffer arg1 Pointer to memory arg2 Length Description The copyout subroutine copies data from a buffer supplied by the caller into a process’s address space. Failure modes This subroutine has no run-time failure modes beyond its constraints.
182
copyoutstr: copy data from kernel to user space, as a string Calling convention rd void arg0 Pointer to buffer arg1 Address in memory arg2 Length Description The copyoutstr subroutine copies data from kernel space to user space as a string value, bounded by the routine’s third argument. Failure modes This subroutine has no run-time failure modes beyond its constraints.
183
copyoutmbuf: copy data from an mbuf chain Calling convention rd pointer to copied data arg0 pointer to mbuf arg1 amount of data to copy Description The copyoutmbuf subroutine copies data from an mbuf chain out a destination pointer bounded by a size given in the second argument. If the second argument exceeds the size of the data in the mbuf chain then it is reduced to the correct length. Constraints The copyoutmbuf subroutine is only supported on FreeBSD. Failure modes This subroutine has no run-time failure modes beyond its constraints.
184
ddi pathname: look up device driver by name Calling convention arg0 Pointer to a device node. arg1 Device minor number. rd Path within the /devices tree. Description The ddi_pathname subroutine returns a string describing the device driver that implements a device in the system. Constraints The ddi_pathname subroutine is only available on Illumos and systems derivice from OpenSolaris. Failure modes This subroutine has no run-time failure modes beyond its constraints.
185
dirname: return the directory component of a pathname Calling convention rd A string pointing to the directory component of a pathname. arg0 Path from which to extact the directory name Description The dirname subroutine returns a string containing the directory component of a pathname, without the terminating filename. Failure modes This subroutine has no run-time failure modes beyond its constraints.
186
getmajor: return major device number Calling convention rd Major device number Description The getmajor subroutine returns the major device number from a device structure supplied as the first argument. Constraints The getmajor subroutine is only available on Illumos and systems derivice from OpenSolaris. Failure modes This subroutine has no run-time failure modes beyond its constraints.
187
getminor: Get the minor device number from a device structure Calling convention rd Minor device number Description The getminor subroutine returns the minor number from a device structure. Constraints The getminor subroutine is only available on Illumos and systems derivice from OpenSolaris. Failure modes This subroutine has no run-time failure modes beyond its constraints.
188
getf: Return a file structure based on a file descriptor Calling convention rd Pointer to a valid file structure. arg0 File descriptor. Description The getf subroutine takes a file descriptor as its argument and returns a file pointer based on the supplied file descriptor. Failure modes This subroutine has no run-time failure modes beyond its constraints.
189
htonl: convert a long (32 bit) value from host to network byte order Calling convention rd Long value in network byte order arg0 Long value in host byte order Description The htonl subroutine takes a long value as its only argument and returns the same long value in network byte order, suitable for use in network protocols. Failure modes This subroutine has no run-time failure modes beyond its constraints.
190
hotnll: convert a long long (64 bit) value from host to network byte order Calling convention rd A 64 bit value in network byte order arg0 A 64 bit value in host byte order Description The htonll routine takes a 64 bit value as its only argument and returns that value in network byte order. Failure modes This subroutine has no run-time failure modes beyond its constraints.
191
htons: convert a short (16 bit) value from host to network byte order Calling convention rd A 16 bit value in network byte order rd A 16 bit value in host byte order Description The htons subroutine takes a 16 bit value as its only argument and returns that value in network byte order. Failure modes This subroutine has no run-time failure modes beyond its constraints.
192
index: return the byte position of a character in a string Calling convention rd Position of character or -1 arg0 String to search Description The index subroutine searches from the beginning of a string pointed to by its first argument, for a character supplied as the second argument. The search proceeds until the character is found, or an optional limit, supplied as the third argument is reached. If the character is not found then -1 is returned to the caller. Failure modes This subroutine has no run-time failure modes beyond its constraints.
193
inet ntop: convert an arbitrary Internet address to a string Calling convention rd Internet address as a string arg0 Address Family arg1 Pointer to address structure Description The inet_ntop subroutine takes either a 128 bit, IPv6, address or a 32 bit, IPv4 address, and converts it to a string suitable for humans. The type of address supplied is indeicated by the second argument, which must either be AF_INET or AF_INET6. Failure modes This subroutine has no run-time failure modes beyond its constraints.
194
inet ntoa: convert a 32 bit IPv4 address to a string Calling convention rd IPv4 address as a string arg0 IPv4 address as structure Description The inet_ntoa subroutine takes a 32 bit, IPv4, address and converts it to a string suitable for humans. Failure modes This subroutine has no run-time failure modes beyond its constraints.
195
inet ntoa6: convert a 128 bit IPv6 address to a string Calling convention rd IPv6 address as a string arg0 IPv6 address as a structure Description The inet_ntoa6 subroutine takes a 128 bit, IPv6, address and converts it to a string suitable for humans. Failure modes This subroutine has no run-time failure modes beyond its constraints.
196
json: extract a single value from a JSON string Calling convention rd A string containing the value or NULL arg0 JSON formatted string rd Key to search for Description The json subroutine extracts a value from a JSON string based on one or more keys supplied via a list in which NULL is used as a key separator, e.g. "name" NULL "age" NULL where the keys are name and age and the number of elements in the list (nelems) is equal to two (2). Failure modes This subroutine has no run-time failure modes beyond its constraints.
197
lltostr: convert a long long (64 bit) value to a string Calling convention rd string representation of passed value arg0 64 bit value to be converted Description The lltostr subroutine takes a 64 bit value as its only argument and returns that value as a human readable string. Failure modes This subroutine has no run-time failure modes beyond its constraints.
198
memref: return scratch memory Subroutine prototype uintptr_t * memref(uintptr_t ptr, size_t length); Calling convention arg0 Pointer to memory arg1 Length of scratch memory to use rd Pointer to a fixed size of scratch memory Description The memref subroutine allocates memory from scratch space and returns that memory to the caller. Pseudocode size = sizeof(uintptr_t) * 2 memref = scratch_space memref[0] = stack[0].value memref[1] = stack[1].value scratch_space += size %rd = memref Failure modes This subroutine has no run-time failure modes beyond its constraints.
199
memstr: convert NULL separated strings to one string Calling convention arg0 pointer to memory arg1 separation character arg2 length of memory to convert rd converted string Description The memstr subroutine converts a set of NULL separated strings into a single string. The string is bounded by the caller. Constraints The maximum length of string to be converted is limited to 4096 bytes by default. The memstr subroutine is only available on the FreeBSD operating system. Failure modes This subroutine has no run-time failure modes beyond its constraints.
200
msgdsize: return the size data in a STREAMS message block Calling convention rd The size of the data contained in the message block. arg0 Pointer to the message block structure Description The msgdsize subroutine returns the size of the data contained in a message block stucture. Message blocks are specific to the STREAMS system. Constraints The msdgsize subroutine is only available on the Illumos operating system. Failure modes This subroutine has no run-time failure modes beyond its constraints.
201
msgsize: return the size data in a STREAMS message block Calling convention rd The size of the data contained in the message block. arg0 Pointer to the message block structure Description The msgsize subroutine returns the size of the data contained in a message block stucture. Message blocks are specific to the STREAMS system. Constraints The msgsize subroutine is only available on the Illumos operating system. Failure modes This subroutine has no run-time failure modes beyond its constraints.
202
mutex owned: Is this mutex owned by a thread Calling convention rd Boolean value indicating mutex ownership. arg0 Pointer to the mutex structure Description The mutex_owned subroutine takes a mutex as its argument and returns a boolean value indicating whether the mutex is currently owned by a thread. Failure modes This subroutine has no run-time failure modes beyond its constraints.
203
mutex owner: Report which thread owns a mutex Calling convention retval The kernel thread which owns the mutex arg0 Pointer to the mutex structure Description The mutex_owner subroutine returns the kernel thread structure which owns the mutex passed at the only argument. Failure modes This subroutine has no run-time failure modes beyond its constraints.
204
mutex type adaptive: Is the mutex adaptive Calling convention retval Boolean indication of whether or not the mutex is adaptive. arg0 Pointer to the mutex structure Description The mutex_type_adaptive subroutine takes a mutex as its only arugment and returns a boolean value indicating whether or not the mutex is adaptive. Failure modes This subroutine has no run-time failure modes beyond its constraints.
205
mutex type spin: Spin mutex detection Calling convention rd Boolean value indicating whether or not the mutex passed as this subroutine’s only argument is a spin mutex. arg0 Pointer to the mutex structure Description The mutex_type_spin subroutine takes a mutex as its only arugment and returns a boolean value indicating wether or not the mutex is a spin mutex. Failure modes This subroutine has no run-time failure modes beyond its constraints.
206
ntohl: convert long (32 bit) value from network to host byte order Calling convention rd value in host byte order arg0 value in network byte order Description The ntohl routine takes a 32 bit value as its only argument and returns that value in host byte order. Failure modes This subroutine has no run-time failure modes beyond its constraints.
207
ntohll: convert a long long (64 bit) value from network to host byte order Calling convention rd long long (64 bit) value in host byte order arg0 long long (64 bit) value in network byte order Description The ntohll subroutine takes a long long (64 bit) value as its only argument and returns that value in host byte order. Failure modes This subroutine has no run-time failure modes beyond its constraints.
208
ntohs: convert a short (16 bit) value from network to host byte order Calling convention rd short (16 bit) value in host byte order arg0 short (16 bit) value in network byte order Description The ntohs subroutine takes a short (16 bit) value as its only argument and returns the same value in host byte order. Failure modes This subroutine has no run-time failure modes beyond its constraints.
209
progenyof:is this process the child of a particular PID Calling convention rd Boolean value arg0 PID Description The progenyof subroutine returns a boolean value that indicates if the current process is a child of the PID passed in the only argument. Failure modes This subroutine has no run-time failure modes beyond its constraints.
210
rand(): Get Random Calling convention rd Target for 64 bits of random(ish) data Description This subroutine returns 64 bits of random(ish) data, placing the result in rd. On supporting systems, stronger randomness can be obtained uing the random subroutine. Failure modes This subroutine has no run-time failure modes beyond its constraints.
211
random: return a better pseudo-random number than rand() Calling convention rd A pseudo-random number Description The random subroutine returns a better pseudo-random number than the originala rand subroutine provided by DTrace. Failure modes This subroutine has no run-time failure modes beyond its constraints.
212
rindex: locate the last matching character in a a string Calling convention rd The position of the character or -1 if the character is not found. arg0 The string to search. Description The rindex subroutine searches from the end of a string pointed to by its first argument, for the first instance character supplied as its second argument. The search proceeds until the character is found, or an optional limit, supplied as the third argument is reached. If the character is not found then -1 is returned to the caller. Failure modes This subroutine has no run-time failure modes beyond its constraints.
213
rw read held: Is this read/write mutex currently held by a reader Calling convention rd Boolean value indicating if this read/write mutex is currently held. arg0 Mutex structure Description The rw_read_held subroutine takes a read/write mutex as its only argument and returns a boolean value indicating if the mutex is currently held by a reader. Failure modes This subroutine has no run-time failure modes beyond its constraints.
214
rw write held: Is this read/write mutex held by a writer Calling convention rd Boolean value indicating whether or not a read/write mutex is held by a writer. arg0 Mutex structure Description The rw_write_held subroutine takes a read/write mutex as its only argument and returns a boolean value indicating whether or not the mutex is held by a writer. Failure modes This subroutine has no run-time failure modes beyond its constraints.
215
rw iswriter: Does the current thread hold a r/w mutex as a writer Calling convention rd Boolean value indicating if the current thread holds a read/write mutex as a writer. arg0 Mutex structure Description The rw_iswriter function takes a read/write mutex as its only arugment and returns a boolean value indicating if the current rhead holds the mutex as a writer. Failure modes This subroutine has no run-time failure modes beyond its constraints.
216
speculation: Activate an inactive speculation Calling convention rd Either an active speculation or 0. Description The speculation subroutine transitions an inactive speculation to the active state, and returns it to the caller, or returns 0 if there are no inactive speculations available. Failure modes This subroutine has no run-time failure modes beyond its constraints.
217
strlen: DTrace version of the strlen function Calling convention rd Length of the string passed as the only argument arg0 Pointer to the string Description The strlen subroutine is DTrace’s version of the well known C library function. It returns the length, in bytes, of the string pointed to by the pointer passed in as its first argument. The string must be NULL terminated. Pseudocode string = stack[0].value %rd = strlen(string) Failure modes This subroutine has no run-time failure modes beyond its constraints.
218
strjoin: join two strings and return the result Calling convention rd Pointer to the combined string arg0 Pointer to the first string arg1 Pointer to the second string Description The strjoin subroutine concatenates the two strings passed to it as arguments and returns the combined string to the caller. Pseudocode first = stack[0].value second = stack[1].value combined = scratch_space if (not can_load(first)) or (not can_load(second)): %rd = 0 return if no room in scratch: %rd = 0 return for i = 0 ... len(first): combined[i] = first[i] for j = 0 ... len(second): combined[i + j] = second[j] scratch_space += len(combined) %rd = combined Failure modes This subroutine has no run-time failure modes beyond its constraints.
219
strchr: locate a character in a string Calling convention rd pointer to the character or NULL if not found arg0 string to search Description The strchr subroutine searches a string, supplied as the first argument, for the first instance of the character passed as the second and returns a pointer to the location of the character in the string. If the charaacter is not present in the string then NULL is returned. Pseudocode addr = stack[0].value target = stack[1].value %rd = strchr(addr, target) Failure modes This subroutine has no run-time failure modes beyond its constraints.
220
strrchr: reverse search a string Calling convention rd pointer to the character or NULL if not found arg0 string to search Description The strrchr subroutine searches a string, supplied as the first argument, for the last instance of the character passed as the second and returns a pointer to the location of the character in the string. If the charaacter is not present in the string then NULL is returned. Pseudocode addr = stack[0].value target = stack[1].value %rd = strrchr(addr, target) Failure modes This subroutine has no run-time failure modes beyond its constraints.
221
strstr: locate a string within a string Subroutine prototype char * strstr(const char *big, const char *little); Calling convention arg0 Pointer to the string to be searched through arg1 Pointer to the string to search for rd Pointer to the string located or NULL if not found Description The strstr subroutine search a string, passed as its first argument, for a sub-string, passed as the second argument. If the sub-string is found a pointer to it is returned to the caller, otherwise NULL is returned. Pseudocode big = stack[0].value little = stack[1].value %rd = strstr(big, little) Failure modes This subroutine has no run-time failure modes beyond its constraints.
222
strtoll: convert a string representing a number to a long long (64 bit) value Calling convention rd a long long (64 bit) value arg0 string to convert Description The strtoll takes a number encoding in a string and converts it to a long long (64 bit) value. Failure modes This subroutine has no run-time failure modes beyond its constraints.
223
strtok: string tokenizing subroutine Calling convention rd pointer to the next token or NULL arg0 string to tokenize Description The strtok subroutine returns a sequential set of tokens from a string passed as its first argument, based on a separator passed as its second. Once the string has been exhausted NULL is returned. In order to find subsequent tokens NULL is passed as the first argument. See this operating system’s strtok manual page (strtok(3)) for an example. Pseudocode string = stack[0].value separator = stack[1].value %rd = strtok(string, separator) Failure modes This subroutine has no run-time failure modes beyond its constraints.
224
substr: return a sub string of a string Calling convention rd a string representing the substring arg0 string from which to derive a sub-string arg2 index of substring arg2 length of substring Description The substr routine returns a sub-string of a string, passed as the first argument, starting from a byte index passed as the second argument. An optional third argument can be used to bound the resulting string. If the optional bounding argument is not supplied then the sub-string includes all bytes up to and including the terminating NUL character. Pseudocode string = stack[0].value index = stack[1].value length = stack[2].value %rd = substr(string, index, length) Failure modes This subroutine has no run-time failure modes beyond its constraints.
225
sx shared held: Is this shared mutex currently held by a reader Calling convention rd Boolean value indicating if this read/write mutex is currently held. arg0 shared lock structure Description The sx_shared_held subroutine takes an sx shared mutex as its only argument and returns a boolean value indicating if the mutex is currently held by a reader. Constraints The sx_shared_held subroutine is only available on Illumos and systems derivice from OpenSolaris. Failure modes This subroutine has no run-time failure modes beyond its constraints.
226
sx exclusive held: Is this sx mutex held exclusively Calling convention rd Boolean value indicating whether or not a the mutex is held exclusively.. arg0 shared lock structure Description The sx_exclusive_held subroutine takes an sx shared mutex as its only argument and returns a boolean value indicating whether or not the mutex is held exclusively. Constraints The sx_exclusive_held subroutine is only available on Illumos and systems derivice from OpenSolaris. Failure modes This subroutine has no run-time failure modes beyond its constraints.
227
sx isexclusive: Is the current thread the only one to hold a shared mutex Calling convention rd Boolean value indicating if the current thread is the only one holding a shared mutex. arg0 shared lock structure Description The sx_isexclusie subroutine takes a shared mutex as its only arugment and returns a boolean value indicating if the current thread is the only one holding it. Constraints The sx_isexclusive subroutine is only available on Illumos and systems derivice from OpenSolaris. Failure modes This subroutine has no run-time failure modes beyond its constraints.
228
tolower: convert a string to all lower case characters Subroutine prototype char * tolower(const char *string); Calling convention rd An all lower case string arg0 Pointer to the string Description The tolower subroutine returns a string converts the characters of the string supplied as its only argument into lower case and returns the resulting string. Pseudocode string = stack[0].value destination = scratch_space for i = 0 ... len(string): c = string[i] if c is uppercase: c = lowercase(c) destination[i] = c scratch_space += len(string) %rd = destination Failure modes This subroutine has no run-time failure modes beyond its constraints.
229
toupper: convert a string to upper case Subroutine prototype char * toupper(const char *string); Calling convention rd A string with only upper case letters arg0 Pointer to the string Description The toupper subroutine converts the characters of the string supplied as its only argument into upper case and returns the resulting string. Pseudocode string = stack[0].value destination = scratch_space for i = 0 ... len(string): c = string[i] if c is lowercase: c = uppercase(c) destination[i] = c scratch_space += len(string) %rd = destination Failure modes This subroutine has no run-time failure modes beyond its constraints.
230
uuidstr: convert a UUID to a string Calling convention rd string representation of a UUID arg0 UUID to be converted Description The uuidstr subroutine converts a numeric UUID into a string. Failure modes This subroutine has no run-time failure modes beyond its constraints.
231
232
Appendix A Code Organization A.1
Open Solaris
DTrace was originally developed on OpenSolaris. As this was the original place that the code resided there was no reason to split things along OS or license boundaries, concerns which cropped up in subsequent ports of the system. The main DTrace command resides in cmd, the supporting libraries are in lib/libdtrace and the kernel code is in the uts/common, uts/intel, uts/sparc, and related directories. One key thing to note is that there are two different dtrace.h include files, one for the kernel and one for the user space code.
A.2
Illumos
The original source of DTrace came from OpenSolaris which has morphed into Illumos. The Illumos tree continues to use the same directory and file layout as was used in OpenSolaris
A.3
FreeBSD
Within FreeBSD the DTrace code has been split between that which came from Sun’s OpenSolaris (now Illumos) and is therefore under the CDDL and the code which has been written natively on FreeBSD, and is therefore under a BSD license. There are two locations for the cddl code, one in the root of the tree, /usr/src and one in the kernel directory /usr/src/sys. Native FreeBSD scripts are located in the /usr/share/dtrace directory. Because of the user space and kernel split for the cddl code the FreeBSD tree has three, separate, dtrace.h files: sys/cddl/contrib/opensolaris/uts/common/sys/dtrace.h The one you care about. cddl/contrib/opensolaris/lib/libdtrace/common/dtrace.h Library APIs cddl/compat/opensolaris/include/dtrace.h Compatibility include Figure A.1: The various versions of dtrace.h 233
A.4
macOS
Open source code from Apple is supplied in discrete packages. The DTrace code on macOS is split between the xnu kernel and the rest of the code which is contained in a dtrace code drop. The kernel includes a very small number of files that are absolutely necessary to build the kernel itself, including the driver code. All of the kernel code is collected into the xnu/bsd/dev/dtrace/ directory with the macOS translators, the D files that know about the internals of kernel data structures, are contained in the scripts sub-directory. In the OpenDTrace repositories there macOS kernel code resides in https://github. com/opendtrace/xnu while the rest of the code resides in https://github.com/ opendtrace/macos-dtrace. These repositories are updated as soon as Apple drops their tarballs onto https://opensource.apple.com/tarballs/.
234
Bibliography [1] A. V. Aho, B. W. Kernighan, and P. J. Weinberger. The AWK Programming Language. Addison-Wesley Longman Publishing Co., Inc., Boston, MA, USA, 1987. [2] B. Cantrill, M. W. Shapiro, and A. H. Leventhal. Dynamic Instrumentation of Production Systems. In Proceedings of the General Track: 2004 USENIX Annual Technical Conference, June 27 - July 2, 2004, Boston Marriott Copley Place, Boston, MA, USA, pages 15–28, 2004. [3] B. Gregg and J. Mauro. DTrace: Dynamic Tracing in Oracle Solaris, Mac OS X and FreeBSD. Prentice Hall Press, Upper Saddle River, NJ, USA, 1st edition, 2011. [4] B. W. Kernighan. The C Programming Language. Prentice Hall Professional Technical Reference, 2nd edition, 1988. [5] M. K. McKusick, G. V. Neville-Neil, and R. N. Watson. The Design and Implementation of the FreeBSD Operating System, 2nd Edition. Pearson Education, Boston, MA, USA, September 2014. [6] S. Microsystems. Solaris Dynamic Tracing Guide. Network, (September), 2008.
235