ISPRS Annals of the Photogrammetry, Remote Sensing and Spatial Information Sciences, Volume III-3, 2016 XXIII ISPRS Congress, 12–19 July 2016, Prague, Czech Republic
OPENWEBGLOBE 2: VISUALIZATION OF COMPLEX 3D-GEODATA IN THE (MOBILE) WEBBROWSER M. Christen Institute of Geomatics Engineering, FHNW University of Applied Sciences and Arts Northwestern Switzerland
[email protected] Commission III, WG III/5
KEY WORDS: Rendering Geospatial Data, Processing Geospatial Data, Image Based Provisioning, Standards, Cloud Computing
ABSTRACT: Providing worldwide high resolution data for virtual globes consists of compute and storage intense tasks for processing data. Furthermore, rendering complex 3D-Geodata, such as 3D-City models with an extremely high polygon count and a vast amount of textures at interactive framerates is still a very challenging task, especially on mobile devices. This paper presents an approach for processing, caching and serving massive geospatial data in a cloud-based environment for large scale, out-of-core, highly scalable 3D scene rendering on a web based virtual globe. Cloud computing is used for processing large amounts of geospatial data and also for providing 2D and 3D map data to a large amount of (mobile) web clients. In this paper the approach for processing, rendering and caching very large datasets in the currently developed virtual globe “OpenWebGlobe 2” is shown, which displays 3D-Geodata on nearly every device.
1. INTRODUCTION AND RELATED WORK The OpenWebGlobe project (www.openwebglobe.org) was initiated at the Institute of Geomatics Engineering of the FHNW University of Applied Sciences and Arts Northwestern Switzerland (IVGI). It started in April 2011 as an Open Source Project following nearly a decade of 3D geobrowser development at the Institute. Key element of the project is the OpenWebGlobe SDK, which is open source and released under MIT license. All source code is freely available at github (http://github.com/OpenWebGlobe) and can be viewed, adapted or extended also for academic or commercial use. OpenWebGlobe consists of the following parts: first, the WebGL based OpenWebGlobe Viewer part, a JavaScript Library which allows the integration of the OpenWebGlobe into custom webapplications. Second, the OpenWebGlobe Processing Tools, a bundle of tools for bulk data processing, e.g. tiling or resampling of large geospatial data sets. These preprocessing steps are required by the viewer part to enable fragment-based, streamed download and visualization of data. The development of OpenWebGlobe 2 – the second version of the virtual globe just started recently. Preprocessing tools for LiDAR data, generation of a digital elevation model (DEM), and derived products running on the cloud have been created using different instance types on the Amazon Elastic Compute Cloud (EC2) as shown by (Sugumaran 2012). Besides the popular map services such as OpenStreetMap, Google Maps, Bing Maps, Yahoo Maps, there are several other projects providing a more customizable way to provide map data from the cloud. One such service is CloudMade which provides web tools to create location based services for web browsers and mobile hardware. Another solution is TileMill, which can be used to create interactive maps with user defined styles. Both solutions use cloud computing for processing and providing maps. Recently some interesting approaches for rendering massive geospatial datasets on mobile devices have been introduced.
Hildebrandt et al. (2011), for example, proposed an architecture for server-side rendering of massive 3D panoramas using cube maps. In their solution the 3D model is preprocessed and provided as a panorama image from the server. Another approach is the provisioning of massive, virtual 3D city models on web browsers, smartphones or tablets assembled from artificial oblique image tiles. It concluded that when using image provisioning techniques, the complexity of the 3D city model data is decoupled from data transfer complexity (Klimke et al., 2014). 2. TILE TYPES FOR VIRTUAL GLOBES 2.1 2D Tiles for Virtual Globes Popular 2D Map services use a quadtree based tiling system to allow displaying maps in different zoom levels. Typically, the Mercator projection is used to map image and elevation data to a square area as shown in Figure 1. The Mercator projection is mainly used to minimize distortions in processed images and elevation data. The meridians of the Mercator projection are vertical parallel equally spaced lines, cut at right angles by horizontal straight parallels which are increasingly spaced toward each pole so that conformality is preserved (Snyder 1987). The maximum latitude is chosen so that the resulting map fits into a square. For the spherical Mercator projection this maximum latitude is approximately 85.05 degrees. Usually the input data must be transformed from a source projection to the Mercator Projection (EPSG:3857). The quadtree tiling approach has the big advantage of fast retrieval of arbitrary extents in different resolutions and drawback is the large amount of tiles, as 19 levels of the quadtree result in more than 360 billion tiles, which can’t be efficiently stored in a traditional filesystem. There are several possibilities to reduce the total amount of tiles, for example by removing higher resolution tiles in oceans or other regions with little interest. However, even when reducing the number of tiles, there are still a lot of tiles.
This contribution has been peer-reviewed. The double-blind peer-review was conducted on the basis of the full paper. doi:10.5194/isprsannals-III-3-401-2016 401
ISPRS Annals of the Photogrammetry, Remote Sensing and Spatial Information Sciences, Volume III-3, 2016 XXIII ISPRS Congress, 12–19 July 2016, Prague, Czech Republic
When rendering global image data like the blue marble dataset (Stöckli 2005) is mapped onto an ellipsoid - it results in a flat globe as shown in Figure 2. This is comparable to 2D mapping services. This tile type is used both for 2D maps and for interactive real-time 3D-Visualisations.
doesn't require on-the-fly updates which would be a rather expensive task for the GPU. With this approach tiles can be created from elevation datasets, such as ASTER, SRTM or any other global or local dataset, which is transformed to the Mercator Projection, triangulated and stored as 3D tile. This tile type is used for interactive real-time 3D-Visualisations. 2.3 Extending 3D Tiles to support 3D-Objects 3D Tiles can be easily extended to store arbitrary 3D-Objects. However, the number of textures per 3D-Tile should be limited for reasons of efficiency. Tiles can be created out of a database containing 3D geometry, such as 3D-city models.
Figure 1. Typical tile layout of a global dataset (Microsoft 2008)
Figure 2. Mapping image data on a globe without elevation
The Open Geospatial Consortium (OGC) and the Web3D Consortium have both been actively addressing the need for interoperability in the field of geospatial 3D visualisation, in particular handling complex datasets, mastering access speed, and allow a diversity of devices. The Web3D Consortium has focused on open standards for real-time 3D visualization, including streaming. The OGC has focused on developing a service interface to provide interoperable access to 3D geospatial data servers. In 2012, a group of OGC members, building on work done in both organizations, completed the 3D Portrayal Interoperability Experiment to develop and evaluate best practices for 3D portrayal services (Open Geospatial Consortium, 2015). The current state of the portrayal service has been used for OpenWebGlobe2. This tile type is used for interactive real-time 3D-Visualisations.
2.2 3D Tiles for Elevation To render elevation data a new tile format – a 3D tile must be created. The easiest approach for this is the use the same quadtree tile layout like the image data and create a 3D-block containing the 3D geometry of the area. (Christen & Nebiker 2011). This supports level of detail and therefore the rendering of massive data as it is spatially divided.
2.4 Tiles for tilted 3D-views
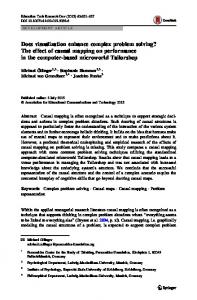
Figure 5. Example of an interactive 3D-visualisation using image based provisioning. Figure 3. Attaching different level of detail tiles results in cracks
Figure 4. Adding a “skirt” around the tile efficiently hides cracks. When rendering separate 3D blocks cracks between tiles occur between different level of details as shown in Figure 3. There are several ways prevent such cracks. A sophisticated way to hide such artifacts has been described by Ulrich (2002). The problem can be solved by creating additional geometry (called skirt) around the tile to prevent visible holes as shown in Figure 4. This approach is rather efficient, as geometry remains static and
To support clients with lower graphics capabilities, such as mobile devices, an image-based provisioning approach is used. The basic idea is that different views of a city model are rendered in the cloud and streamed to the client in the form of image tiles (Christen 2015). This map type is a new features available in OpenWebGlobe2: it is possible to switch between the tilted 3Dview and the real-time 3D visualization. This tilted view supports different zoom levels and view orientations of the city model. The resulting images follow the principle of G-buffers (Saito 1990). The first image tile type is a diffuse map, containing unlit colors of the scenery, the second tile type is a normal map containing normals encoded in RGB. With these two tile types, it is possible to support dynamic lighting of the scene. A third tile type contains ids of the 3D objects in the scene encoded as RGBA color values, which can be used for the identification of objects. The fourth image tile type is the Z-buffer tile containing the 32bit per pixel depth values. With this tile type, it is possible to get the 3D position of every pixel on screen. All tiles are streamed as images in the png format since almost any kind of data can be
This contribution has been peer-reviewed. The double-blind peer-review was conducted on the basis of the full paper. doi:10.5194/isprsannals-III-3-401-2016 402
ISPRS Annals of the Photogrammetry, Remote Sensing and Spatial Information Sciences, Volume III-3, 2016 XXIII ISPRS Congress, 12–19 July 2016, Prague, Czech Republic
encoded in and decoded from RGB and RGBA images (Christen, 2005). This tile type is used for interactive 3D-Visualisations with predefined tilted views, an example of such a visualisation is shown in Figure 5.
3. PROCESSING AND SERVING TILES 3.1 Basic Architecture The workflow for requesting tiles in the cloud is shown in Figure 6. At first, the 3D viewer requests a tile from the webserver in the cloud. This request is sent to a load balancer. Because web browsers have a limit of 4 requests on a same server, the load balancer listens on multiple DNS entries such as tile1.openwebglobe.org, tile2.openwebglobe.org and tile3.openwebglobe.org, which allows 12 requests per client at the same time. The load balancing is forwarded to several instances which can be turned on and turned off any time. This allows responding to high demand if necessary. On each instance it is checked if the requested tile is already pre-processed and stored in the cache.
As the subsequent rendering performance is critical, a spatial data structure is created for acceleration. The bounding volume hierarchy (BVH) is of the most popular spatial data structures (Barringer 2014). The BVH is used for 3D objects, including all buildings and terrain. To support very large 3D cities and to keep the memory footprint low, the BVH is stored as multiple files in the file system. The textures are converted to a format with multiresolution support to reduce time for pixel lookup. The tiles to be rendered are stored as render-jobs using MongoDB. This simplifies the job distribution in the cloud using as many nodes as needed for processing tiles since each node processes a new job retrieved from the database. Once all required full-resolution tiles are processed the remaining zoom levels are calculated. This approach further speeds up the rendering. 4. RESULTS: RENDERING SCENES To test the processing and visualization algorithms, three different datasets have been used to ensure the processes work for global 3D datasets, for large 3D-cities, and for small datasets. The datasets are the city of Rotterdam and the historic roman city of Augusta Raurica. The global dataset is constructed 3D data from the OpenStreetMap database as shown by Oertli (2014), Christen (2015), and Rettenmund (2015). 4.1 City of Rotterdam The city model of Rotterdam is available to the public as CityGML dataset. The dataset consists of:
90 CityGML files with a total size of 2.72 GB 26'474 textures with a size of 1024x1024, an uncompressed total data volume of around 77 GB
Figure 6. Workflow for requesting tiles from the cloud For the cache Amazon S3 storage is used. If the tile is in the cache it is sent back to the client. In the case the tile isn’t available yet, it is requested from a High Performance Compute Cluster (HPCC) where it is calculated and then uploaded and cached in S3 and sent back to the client. Over time the S3 cache grows to a previously set maximum level of detail. For the ASTER elevation dataset only 14 levels of details are cached in S3 and higher level of details are always retrieved from the local high performance compute cluster (HPCC). 3.2 Processing Tiles The image tiles are created on the fly out of the orthophotos and cached for the next usage. The same applies for elevation – 3D tiles containing elevation are created out of the previously specified raster data. The more general 3D tiles – mainly 3D city objects – are created out of a PostGIS database combined with an implementation of a 3D Portrayal Service (3DPS). For the tilted view (image based provisioning) the tiles are being prerendered on the cloud instances. The rendering is done using ray-tracing.
Figure 7. The orthophoto of Rotterdam (RDAM_lufo2014.ecw) CityGML is an XML-based format for the storage and exchange of virtual 3D city models. It is therefore not a format optimized for viewing and can't simply be converted to an optimized viewing format. In addition, the dataset consists of texture atlases which are not optimized at all. Optimal results would be achieved if a 3D designer would manually redesign all buildings using 3D modelling software, which was not to goal of this project. Instead, a more general way for converting the models in an automated process was implemented. In this process we use all original textures and 3D data. In a first step the data is converted from CityGML to Wavefront OBJ format using FME (Safe Software). In a second step the materials and geometry are optimized using a Python script. The script does:
remove untextured faces, as we only want textured buildings remove triangles with double vertices optimize materials: use only one material per texture flip axis and face-orientation so we have a right handed coordinate system for further processing
This contribution has been peer-reviewed. The double-blind peer-review was conducted on the basis of the full paper. doi:10.5194/isprsannals-III-3-401-2016 403
ISPRS Annals of the Photogrammetry, Remote Sensing and Spatial Information Sciences, Volume III-3, 2016 XXIII ISPRS Congress, 12–19 July 2016, Prague, Czech Republic
The textures themselves are not changed as we did not want to reduce the given image quality.
is possible to pan and zoom and select POI for additional information.
Once the 3D files were cleaned up they were added to the PostGIS database for further processing. In addition to the buildings, the orthophoto of Rotterdam was used (Figure 7). The file was downloaded from the Rotterdam open data portal in ECW Format. It has a size of 620'000x 248'696 Pixels.
The same reconstruction has been used for the real-time 3D visualisation in OpenWebGlobe (Figure 9). With all degrees of freedom it can be interactively navigated in the scene, however loading of textures is slower as much more bandwidth is used for downloading Textures. This wouldn't have been acceptable for the mobile version.
This dataset has been used exclusively for experiments using the tilted 3D-view in the webbrowse. Using an object-id map it is possible to select and highlight buildings (as shown in Figure 5). The 3D map of Rotterdam has been processed using 8 zoom levels. A total of 87381 tiles have been preprocessed and stored in the cloud. 4.2 Historic Roman City "Augusta Raurica" The second use case is a digital reconstruction of the historical Roman City of Augusta Raurica, located some 10 kilometres east of today's city of Basel in Switzerland. Augusta Raurica was one of the largest Roman cities north of the Alps with estimated 15'000 inhabitants in the 1st and 2nd century AD. The digital reconstruction of the historical city and its continual evolution is part of a long lasting research cooperation between the archaeological team of Augusta Raurica and the Institute of Geomatics Engineering of the University of Applied Sciences and Arts Northwestern Switzerland (FHNW).
Figure 9. Real-Time Rendering of the Augusta Raurica Dataset in the virtual globe – textures are streamed per building. 4.3 3D Buildings from OpenStreetMap
The high-resolution 3D model of Augusta Raurica covers an area of approx. 2 km x 2.5 km and includes over 4000 geospatial objects (such as buildings, roads, vegetation features and the terrain) at three levels of detail. This leads to a geometry dataset of approx. 172 MB and textures in the order of 350 MB (compressed). This 3D-reconstruction has also been used for creating one of the largest bronze models of a historic city. (Schaub, 2014).
Figure 10: OpenStreetMap 3D data in the virtual globe combined with higher detailed buildings of interest. To also test scenes on a global scope, OpenStreetMap data has been used to construct 3D Objects (Christen 2014). For the realtime 3D visualization the result doesn't look appealing, therefore some buildings of interest have been replaced with a better representation (Oertli 2014). This concept is shown in Figure 10. When using the approach using tilted 3D-view (Figure 11) it is possible to create use better lighting models, or even global illumination (Rettenmund 2015). 5. OUTLOOK AND CONCLUSION Figure 8. Image based provisioning in the Augusta Raurica App running as web-based App. The tilted 3D view has been used in an upcoming app for the visitors of the Augusta Raurica museum. The app (Figure 8) consists of a visitor guide including maps and reconstructed views using augmented reality. For the map part the new OpenWebGlobe 2 processing tools were used to create an interactive tilted 3D-view of the historic town. In this 3D-view it
In this paper the cloud-based approach for 3D real-time rendering and image provisioning supporting large and complex 3D city models for OpenWebGlobe2 has been introduced. The city model of Rotterdam has been created from a very large CityGML model with textures and Augusta Raurica has been generated in CityEngine using a procedural modeling approach. The Augusta Raurica case showed that screen space rendering techniques can be used on the fly to create dynamic lighting, even if WebGL is not used. The scenes can be rendered on common mobile and
This contribution has been peer-reviewed. The double-blind peer-review was conducted on the basis of the full paper. doi:10.5194/isprsannals-III-3-401-2016 404
ISPRS Annals of the Photogrammetry, Remote Sensing and Spatial Information Sciences, Volume III-3, 2016 XXIII ISPRS Congress, 12–19 July 2016, Prague, Czech Republic
desktop web browsers while the real-time visualization runs in webbrowsers of desktop machines and laptops.
global.com/article/web-based-large-scalegeovisualisation/70402
The mobile app "Augusta Raurica" is being developed using these techniques. For one, the real-time rendering of single 3DObjects is available on the mobile phone, for the whole historic city of Augusta Raurica image based provisioning is used to display the entire 3D model of the city.
Christen, M., Nebiker, S., 2015. Visualisation of Complex 3D City Models on Mobile Webbrowsers using Cloud-based Image Provisioning, ISPRS Annals of the Photogrammetry, Remote Sensing and Spatial Information Sciences, Volume II-3/W5, doi:10.5194/isprsannals-II-3-W5-517-2015
For the example with OpenStreetMap it has been shown, that when using precomputed global illumination models in a tilted view, it is possible to archive nicer renderings comparted to the traditional lighting models on current generation virtual globes. The current state of the view extension of the OGC 3D Portrayal specification has proven to be suitable for the visualisation of different types of city models.
Christen M., Hürbi K., Nebiker S., 2014. OpenWebGlobe: 3DVisualisierung und Caching von globalen Stadtmodellen aus OpenStreetMap mittels Cloud-basiertem Framework, DGPF Tagungsband 2014, Hamburg
In future, more lighting models for the 3d-realtime and for the tiled view will be implemented, such as screen-space ambient occlusion (Kajalin, 2009). In that case the depth map would be used to retrieve the object positions.
Flask, 2015. Flask Documentation / User's Guide, available online http://flask.poco.org/docs/0.10/, accessed November 23, 2015
Another planned feature will be the support of multiple layers. Layers will be combined by using the depth maps of each layer in order to determine which pixel is in front and which in the back. This will also allow to combine scenes with point clouds, as proposed by Nebiker et al., 2010. Once the OGC 3D Portrayal specification is finalized the processing will be adapted to ensure full compatibility.
Evans, A. et al., 2014. 3D graphics on the web: A survey. Computers & Graphics, 41(0), pp.43–61.
Hildebrandt D., Klimke J., Hagedorn B., and Döllner J., 2011. Service-oriented interactive 3D visualization of massive 3D city models on thin clients. In Proceedings of the 2nd International Conference on Computing for Geospatial Research & Applications (COM.Geo '11). ACM, New York, NY, USA Kajalin V., 2009. Screen-Space Ambient Occlusion. In Wolfgang Engel, editor, ShaderX7 - Advanced Rendering Techniques, pages 413–424. Charles River Media Klimke J., Hagedorn B., and Döllner J., 2014. Scalable MultiPlatform Distribution of Spatial 3D Contents. Int. J. 3D Inf. Model. 3, 3 (July 2014), 35-49. Loesch, B., Christen, M., & Nebiker, S., 2012. OpenWebGlobe an open source SDK for creating large-scale virtual globes on a WebGL basis. International Archives of the Photogrammetry Remote Sensing and Spatial Information Sciences XXII ISPRS Congress. Microsoft, 2008. ‘Bing maps tile system’. Available online at: http://msdn.microsoft.com/en-us/library/bb259689.aspx
Figure 11: OpenStreetMap 3D: tiled view using global illumination. REFERENCES Christen M., 2005. Implementing Ray Tracing on the GPU. In Wolfgang Engel, editor, ShaderX4 - Advanced Rendering Techniques, pages 413–424. Charles River Media Christen, M., Nebiker, S., 2011. Large Scale Constrained Delaunay Triangulation for Virtual Globe Rendering. In T. H. Kolbe, G. König, & C. Nagel (Eds.), Advances in 3D GeoInformation Sciences (pp. 57-72). Springer Berlin Heidelberg. Retrieved from http://dx.doi.org/10.1007/978-3-642-12670-3_4 Christen, M., Nebiker, S. & Loesch, B., 2012, ‘Web-Based Large-Scale 3D- Geovisualisation Using WebGL: The OpenWebGlobe Project’, International Journal of 3-D Information Modeling (IJ3DIM) 1(3),http://www.igi-
Oertli, L., 2014, OpenWebGlobe: Visualisierung und Caching von 3D-Stadtmodellen, Master Thesis, Institute of Geomatics Engineerung, University of Applied Sciences and Arts Northwestern Switzerland Open Geospatial Consortium (OGC), 2015. OGC seeks public comment on candidate 3D Portrayal Service Standard, OGC Press Release, last accessed: December 2nd, 2015 http://www.opengeospatial.org/pressroom/pressreleases/2165 Rettenmund D., 2015, 3D-Portrayal von OpenStreetMap Daten, Bachelor Thesis, Institute of Geomatics Engineerung, University of Applied Sciences and Arts Northwestern Switzerland Saito T. and Takahashi T., 1990. Comprehensible rendering of 3-D shapes. In Proceedings of the 17th annual conference on Computer graphics and interactive techniques (SIGGRAPH '90). ACM, New York, NY, USA, 197-206. Schaub, M., 2014. Das Bronzemodell von Augusta Raurica: vom Stadtplan zum Stadtmodell. Augusta Raurica Magazin, 2014(1), 7-9.
This contribution has been peer-reviewed. The double-blind peer-review was conducted on the basis of the full paper. doi:10.5194/isprsannals-III-3-401-2016 405
ISPRS Annals of the Photogrammetry, Remote Sensing and Spatial Information Sciences, Volume III-3, 2016 XXIII ISPRS Congress, 12–19 July 2016, Prague, Czech Republic
Snyder, J. P., 1987, Map Projections: A Working Manual, U.S. Geological Survey Profesional Paper 1395, U.S. Geological Survey Stöckli, R., Vermote, E., Saleous, N., Simmon, R. and Herring, D. (2005). The Blue Marble Next Generation - A true color earth dataset including seasonal dynamics from MODIS. Published by the NASA Earth Observatory. Corresponding author:
[email protected], http://pubs.er.usgs.gov/usgspubs/pp/pp1395. Sugumaran, R., Burnett, J., and Blinkmann, A. 2012. Big 3D spatial data processing using cloud computing environment. In Proceedings of the 1st ACM SIGSPATIAL International Workshop on Analytics for Big Geospatial Data (BigSpatial '12). ACM, New York, NY, USA, 20-22. Ulrich T., 2002 Rendering massive terrains using chunked level of detail. ACM SIGGraph Course Super-size it! Scaling up to Massive Virtual Worlds.
This contribution has been peer-reviewed. The double-blind peer-review was conducted on the basis of the full paper. doi:10.5194/isprsannals-III-3-401-2016 406