Operational Risk and Reference Data: Exploring Costs, Capital Requirements and Risk Mitigation Allan D.Grody (corresponding author) President, Financial InterGroup Advisors 169 East 69th Street New York, New York 10021 Adjunct Professor Emeritus Leonard N. Stern Graduate School of Business, New York University Email
[email protected] Tele. 917 414 3608 Fotios C. Harmantzis, PhD Assistant Professor School of Technology Management Stevens Institute of Technology Castle Point on the Hudson Hoboken, NJ 07030 Email:
[email protected] Tele. 917 306 0179 Gregory J. Kaple Senior Partner Integrated Management Services Inc. Graduate Alumni of Stevens Institute of Technology 123 Willow Avenue Suite10 Hoboken, NJ 07030 Email:
[email protected] Tele. 917-225-8458 In this updating of our paper we note major shifts in the sourcing, maintenance, distribution and management of reference data in the intervening period from our first posting of this paper in November, 2005 to the present. Changes in the regulatory environment both in the US and Europe caused us to add new categories to our definition of reference data. Similarly the regulatory uncertainty regarding the methodology for Basel II’s implementation in the US, and the lack of progress in defining a workable solution for measuring Operational Risk capital, strengthened our conviction that more has to be understood about the implications of faulty data on operational risk. More external collaborative efforts, projects supporting internal consolidations of data management, and increased outsourced undertakings caused us to add a new section just on this subject. New insights into categories of revenue earned by industry reference data vendors allowed us to update the numbers shown in Exhibit I to reflect the declining value proposition of real-time market data and its emerging status as undifferentiated referential data. Here, owing to the nature of the origination of much of this data - increasingly public, for-profit exchanges and trading venues, real-time market data has been bifurcated into that which is directed by regulators to be publicly available, commoditized data and that which is proprietary. The updated paper reflects the incorporation of this commoditized real-time market data into both our definitions of reference data and the revised acquisition cost estimates. The authors would like to acknowledge the following individuals for there help in this updated version of the paper: Michael Atkin, Executive Director of the EDM Council who probed the depths of the detail of the earlier paper to point out oversights, errors and improvements, and who spurred his Councils work with us on techniques for understanding and measuring data risk: and Max Bowie, whose excellent work as Editor of Inside Market Data and publisher of industry data and information costs contributed to a more detailed estimate of the Information and Data cost category.
February, 2007
Operational Risk and Reference Data: Exploring Costs, Capital Requirements and Risk Mitigation Executive Summary . New regulations are imbedding operational risk concepts and the provisioning of operational risk capital in the risk management considerations of globally active financial enterprises. Inherent in new capital calculations is the effect of losses due to faulty reference data, data which is costly to acquire and maintain, duplicative across the industry and of no strategic value, and which comprises 70% of the data content of financial transactions. Faulty reference data has been a persistent impediment to systemic risk mitigation across the global capital and investment markets. Reference data electronically represents financial products and their changing specifications, counterparties, financial intermediaries, corporations, issuers, financial markets, currencies, valuation and market prices, and associated referential information such as credit ratings and fundamental data. This paper attempts to illuminate the effect of faulty data on operating costs, operational risk and economic capital. It also points toward applying solutions that have proven to reduce costs and risk in other industries and in other segments of the financial industry. Standards for product and supply chain participants, long a staple in the retail industry, are long overdue in the financial services industry. Financial industry-wide cost sharing and risk mitigating approaches have long been organized around shared infrastructure entities but, to date, have only been applied to the value portion of transactions (principally quantities, transaction prices and amounts). This paper argues for these same techniques to be applied to the matching and “clearing” of the reference data components of these transactions. The authors conclude that data and its management is costly, averaging $740 million each for the largest financial enterprises, and that faulty data is at the core of significant components of operational losses. Finally, the authors believe that industry-wide collaborative initiatives can reduce data costs significantly, lower capital requirements and mitigate risk. Key words
Financial Institutions, Operational Risk, Data Management, Reference Data, Basel, Risk Management
2
Operational Risk and Data Management: Exploring Costs, Capital Requirements and Risk Mitigation
1.0 Introduction Operational Risk is soon to be formally imbedded alongside market and credit risk in the risk management considerations of globally active financial enterprises. As this reality approaches there is an awakening interest among the general management of financial enterprises that reference data, data which comprises some 70% of the data structure of all capital market transactions, is unnecessarily costly and duplicative, and both a significant component of operational risk and a significant cause of operational losses. Financial transactions can be thought of as a set of computer encoded data elements that collectively represent 1) standard reference data, identifying it as a specific product bought by a specific counterparty, 2) variable transaction data such as traded date, quantity and traded price, and 3) associated referential information such as market data, credit ratings and fundamental data. The reference data components of a financial transaction identifies it as a specific financial product (security number, symbol, market, etc.), its unique type, terms and conditions (asset class, maturity date, conversion rate, etc.), its manufacturer or supply chain participant (counterparty, dealer, institution, exchange, etc.), its delivery point (delivery, settlement instructions and location), its delivery or inventory price (closing or settlement price) and its currency. Analogous to specifications for manufactured products, reference data also defines the products’ changing specifications (periodic or event driven corporate actions), occasional changes to sub-components (calendar data, credit rating, historical price, beta’s, correlations, volatilities) and seasonal incentives or promotions (dividends, capital distributions and interest payments). Already a part of their considerations, financial managers have been working through the consequences of reinforced diligence among regulators of know-your-customer (KYC) rules, new Anti-Money Laundering laws, the Sarbanes-Oxley (SOX) legislation, the Markets in Financial Instruments Directive (MiFid), the Undertakings for Collective Investments in Transferable Securities (UCITS) III directive, and the Basel II Capital Accords, amongst others. The impact on reference data in complying with these mandates is forcing an old issue of incomplete, non standard electronic representations of customers, corporations, financial intermediaries, issuers, financial products, markets, currencies and prices, to the fore-front of management priorities. Further, the 2008 beginning phase-in of the Bank for International Settlement’s (BIS’s) new regulatory regime (known as Basel II or the Basel Accord)1 will require new operational risk capital calculations. These calculations, based upon operational loss experiences and key risk indicators of operational effectiveness, will yield a capital set aside amount for each institution. This regime is yet to be fully appreciated and, thus, drives the purpose of this paper - to highlight the role of faulty reference data in operational risk, to understand the impact of reference data on the operating costs and capital of financial enterprises, and to shed further light on the impact of enterprise-wide and industry-wide reference data on the global financial industry. Of particular interest is the impact on the 30 largest, internationally active financial enterprises headquartered in the US. Currently approximately 15 of these large banks and broker/dealers will be required to adopt the Advanced Measurement Approach (AMA) 3
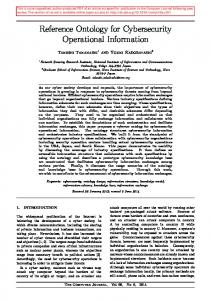
for risk management under the Basel II regime. Initially, another group of equal size and number, along with U.S. based foreign owned financial institutions regulated under their parents’ regulatory regimes, are expected to voluntarily adopt the Basel regime owing to the incentive for reducing overall capital requirements. Each individually spend the most on reference data, duplicating each others costs for no strategic advantage. Collectively they bear the largest risk of faulty reference data through their representation as traders, investment managers, prime brokers, paying agents, trustees, fiduciaries, and custodians in the majority of the trades conducted in the global capital/investment markets. This paper attempts to document the effect of faulty reference data on costs and on operational risk and operational capital while acknowledging that it still remains an area needing further research due to the lack of granularity of cost and loss data compiled to date. As such we believe this paper is the first time the literature of operational risk and reference data has been drawn together and useful insights presented. While calling for the need for collecting still more granular data, it sets out a logical hypothesis that faulty reference data is at the core of significant components of operational losses. Figure 1 - Reasons for Transaction Failure
Settlement Instructions Trade-Specific Data
20% 17%
Client/ Counterparty Data
24%
21%
13% 12% 12% 13%
Instrument Data No Response
8%
Account-Specific Data Corporate Action-Specific Data
25%
17%
2%
14%
8%
Most Common
Second Most Common
Source: Sources: Reuters, Capco, Tower Group Survey—September 2001
It also points toward applying solutions that have proven to reduce risk in the matching and clearing of valued transaction data, which we believe would obtain for reference data as well. Such long standing industry-wide cost sharing and risk mitigating approaches are organized around shared infrastructure entities that, to date, have only been applied to the value portion of transactions (principally quantities, transaction prices and amounts), but whose techniques we envision being applied to the matching and “clearing” of the reference data components of these transactions as well. Evidence exists that higher valuations for good risk management practices are awarded to publicly traded financial enterprise (Duliba, 1997) and penalized, disproportionately, when losses are incurred (Cummins, Lewis, Wei, 2005). Thus, success in mitigating reference data risk and the commensurate reduction of operational risk capital could lead others to elect the Basel approach over their current regulatory regimes. Collectively, participation in proposed industry-wide solutions could provide both risk mitigation opportunities and cost and capital reduction benefits to all. 4
1.1 Background to Contemporary Issues Today’s process of organizing a financial transaction from order presentation to trade execution and settlement is multi phased. Interactions between different proprietary systems each defining its own set of reference data is common. Combined with many points of human and automated system interactions, faulty reference data can require extensive error detection and repair procedures. Reference data is attached incrementally at various stages in the life cycle of a financial transaction, either by the selection or input of such information by a human being, by looking up information on a computer file, if it is being entered for the first time, or through computerized access to previously prepared directories and/or financial transactions (as when one had previously bought a stock and then prepares to sell it). Reference data can be accessed via each business’s processing application, which incorporates the required reference data along with the specific business rules for the transaction to be represented as a stock trade, bond trade, futures trade, swap, credit derivative, etc. Sometimes the application accesses a central store of reference data within the organization, sometimes an external store. In either case reference data is usually further integrated within the business application itself. Reference data should be consistent across each financial transaction’s life cycle and throughout its supply chain. However, duplication of reference data is pervasive in large financial enterprises and throughout the industry, leading to significantly higher risk and operational costs. When reference data that should be identical are not, it causes miscalculated values, misidentified products, and involvement with erroneous supply chain partners (trade counterparties, custodians, paying agents, et al). These individual transaction failures cause monetary loss, higher labor costs, and the potential for both transactional and systemic failure. The problem, simply stated is that each financial institution or supply chain participant has independently sourced, stored and applied reference data to their own copy(s) of their master inventory and counterparty data bases. When this is applied to the variable components of a financial transaction (i.e. quantity and transaction price), and an attempt made to match, identically, the details sent by the counterparties and supply chain participants in order to accept and pay for the transaction, significant failures in matching occurs. Recently the global financial industry has concerned itself with realizing the promise of further efficiencies from being an exclusively information-based business. Unlike manufactured product, the completion of a transaction through acceptance and payment is not done through manual inspection, but rather is attempted increasingly by completely automated means. Prior to automated matching, a financial transaction was printed out, visually checked against original source documents (manually annotated forms), and telephonically or through inspection of faxes (in a previous era, telexes) matched with counterparties’ similarly sourced information. Today, through automated matching, when details of a transaction do not match each party is put at risk that the transaction will not settle. Costly exception processing routines follow, some automated, many manual. SWIFT (Society for Worldwide Interbank Financial Telecommunications) in 2002 projected the annual cost to the financial industry globally to repair these transactions at $12 billion. The SIA (Securities Industry Association) in 2001 had projected total daily settlement value at risk in 2004 at $750 billion while DTCC in their 2004 annual report reported actual settlement value at risk of $4.5 trillion. What follows from these observations is that industry participants have both the motivation and the ability to process the entire life cycle of a financial transaction 5
completely by automated means. The growing interest in accomplishing this has spawned the mantra of straight-through-processing (STP), a catch phrase for reducing the labor content of transaction processes, thus affecting both cost efficiencies and risk mitigation. This risk mitigation incentive has dominated the issue, as it is intended that straight-through-processing will incorporate the seamless linking of front, middle, and back office systems and thus allow for the settlement cycle for securities (the time when a stock or bond trade is entered into until it is paid for) to be reduced from three days to a single day (this concept is referred to as T+1 – trade date plus one). During these three days a counterparty that has entered into a transaction can default on its payment or, more critically, declare themselves insolvent. In increasing measures, financial institution managers and their regulators have recognized the importance of managing operational risk, defined by the Basel Committee on Banking Supervision as “the risk of loss resulting from inadequate or failed internal processes, people and systems or from external events”2. Deregulation and globalization of financial services, together with the growing sophistication of information technology, are making the activities of financial enterprises (and thus their risk profiles) more diverse and complex. If not properly controlled, the growing use of information technology, especially as it pertains to the concepts of straight-through-processing in the capital/investment markets, has the potential to transform individual transaction risks to systemic failures as greater reliance is placed on globally integrated systems. This is a growing issue as other traded assets such as futures, OTC derivatives, options and foreign exchange are evolving toward more institutional, industrial strength processing needs as has evolved in the equities markets. These include processing features such as completely electronic trading venues, order routing and order management systems, volume weighted average pricing algorithms, trade allocations, deal affirmations, confirmation matching, and third party paying agencies and custodians. Further, the growing use of outsourcing arrangements and the participation in third-party run clearing, netting, matching and settlement systems can mitigate some risk but can also present significant other risks.3 The recognition that faulty reference data is the leading cause of transaction failures within these global clearance, matching and settlement systems provides a further incentive to understand the relationship between reference data and risk. In fact, the International Association of Financial Engineers (IAFE) conducted a seminar on the very subject of reference data and risk management and the topic is increasingly finding its way onto the agendas of trade conferences and academic symposiums.4 Both explicitly and implicitly, the Basel II Accords highlights reference data as a meaningful component of both operational risk and of risk mitigation. Basel II has declared that consistency in reference data is an important consideration across the enterprise. It is an important concept as it set's a direction wherein the major financial enterprises can no longer, for example, retrieve end of day prices from one service for valuing equity portfolios in their asset management business, while getting these "same" prices from another service to value an OTC equity derivatives product. It speaks to the heart of the problem of "silos" of reference data and also sets the tone for the current initiatives amongst the largest of financial institutions to centralize reference data. These efforts to centralize reference data is an obvious response in anticipation of regulators’ expectations that portfolios from different parts of a financial institution that ultimately contribute their valuations of the same instruments to the enterprise trading book, and the enterprise banking book, have the same valuations. It is also 6
important that the same valuations (and identity) of these same instruments be valued the same across different financial institutions if objective measures of risk are to be relied upon across financial institutions 1.2 Chronology of Historical Reference Data Events The modern era of reference data began in 1968 with the establishment of a working group of executives known as the Banking and Securities Industry Committee (BASIC).5 Born in the aftermath of the paper crisis that crushed the industry and caused the NYSE to close one day each week to process the accumulated paperwork, this committee championed standards for identifying securities for use in computer processing, known as the CUSIP number (Committee on Uniform Securities Identification Procedures), identified uniform numbers for supply chain participants such as transfer agents and brokerage firms, referred to as FINS (Financial Institution Numbering System), and standardized forms used in processing trades from its origination as an order, to its transfer, delivery and payment status. Along the way, in order to facilitate computerized processing, BASIC attempted to standardize the troublesome physical stock certificate by proposing its reincarnation in the form of an engraved punched card, the preferred computer medium of that era. The punched card concept soon gave way to more efficient methods that immobilized and de-materialized the stock certificate in depositories, thus eliminating the need to make physical delivery but necessitating accurate reference data to assure the electronic completion of a transaction, previously done through physical delivery and site inspection. The establishment of multiple data processing installations throughout the supply chain of banks, brokers, custodians, depositories, investment managers, et al led each to establish their own reference data master files. The multiple representations of this same data led to each firm being burdened with similar costs for acquiring and maintaining data that should be identical but wasn’t due to clerical input errors, multiple interpretations and/or misinterpretations of the same information, and coding errors. The problems of failed transactions due to misrepresented reference and transactional data grew even larger as an issue in the securities industry due to huge increases in volume and the growth in cross border transactions and cross product financial hybrids, even as incremental change and improvements where implemented. At this time a significant attempt was made by the SEC to incent broker/dealers toward improvements in operational practices through capital charges.6 Coincident with these attempts at risk management and processing improvements in the securities markets was the proliferation of other trading markets, notably markets in options, futures and currencies. In this emerging era of globalization the international Society for Worldwide Interbank Financial Transactions (SWIFT) launched its first payments network. In 1974 the bank payment system was presented with a default of currency obligations of the German bank Herstatt and, thus, introduced the concept of operational losses due to settlement risk into the global financial system’s growing risk management issues. Later, in the aftermath of the market break of 1987 it became evident that markets where interconnected and mitigating systemic risk in the global capital markets became an issue of great importance. The Group of Thirty Report on Clearance and Settlement of 1989 made clear the need to harmonize markets, eliminate delays in the processing cycles for securities, and standardize reference data across markets. Over a decade later this same body, in a 7
follow up study repeated this call for standardized reference data and its implications for systemic risk mitigation. In 1993 the Security Glossary Committee was formed within the Data Management Division of the Securities Industry Association. It proposed to establish an industry-wide master file of standardized reference data for securities products, to include identity numbers and each product’s specifications, terms and conditions, including end-of-day valuation prices. The impetus for this was the high cost that each firm was enduring in acquiring and maintaining the same set of data. Also important was the bankruptcy in 1990 of brokerage firm Drexel Burnham Lambert, which exposed firms to having valued the same securities issued by Drexel differently, each having sourced and used different close-of-day valuation prices. The high costs of implementation, industry complacency and other priorities, and the lobbying of data vendors all worked against acceptance of the project at that time.7 During this same period the Financial Information Services Division of the Information Industry Association (later to be renamed the Software and Information Industry Association), and representing distribution vendors, originators of data and users of market and reference data took on the challenges of defining closing prices and standardizing symbols8 used at the front end of the order origination process for trading. At that time it was recognized that symbols used to define products at the front end of the supply chain where indiscriminately being assigned without consideration of duplication by various exchanges, trading system operators, and dealing room product innovators. Additionally, due to the lack of definition of what constituted a closing (or valuation) price a project was undertaken to determine how each originating venue of closing prices (exchanges, trading systems operators, dealing rooms) constructed such prices9. These prices are used to value inventory and collateral and to determine credit requirements. These projects produced logical systems for the universal assignment of symbols and a standardized definition of closing prices across all originating price discovery venues. However, it was not universally adopted due to the vested interest of proprietary vendor intermediaries, exchanges willingness to adopt easier, although temporary solutions, and the lack of priority within end users to implement required systems changes. Also, a period of buoyant markets, higher trading volumes, accelerated merger & acquisition activity, both on behalf of clients as well as amongst financial institutions themselves, and significant regulatory issues intervened to put the issues of reference data on the back burner. It was the release of the SIA’s study in 2000 on the impediments to achieving settlement of securities on the day after trade date (referred to as T+1), the original goal set out in the Group of Thirty’s recommendations back in 1989, that resurfaced product specific reference data as a major issue again. At about the same time the September 11th, 2001 terrorist attacks in New York and the corporate scandals of the new millennium focused attention on counterparty and supply chain reference data. Existing know-your-customer (KYC) rules, new anti-money laundering initiatives, and the Sarbanes-Oxley legislation, all combined to create the necessity for financial enterprises to understand both the specific client and the hierarchy of legal entities one did business with. In the context of the highly automated systems that financial enterprises deployed this meant accurate counterparty and supply chain reference data and their linkage. Finally, the concern of the risk consequences of faulty reference data was again repeated in the SEC’s 2004 Concept Release on Securities Transaction Settlement and also imbedded as an issue in the 2008 8
pending implementation of Operational Risk Capital measures required under the Basel II regime. 1.3 Straight-through-Processing (STP) and Trade Date +1 (T+1) The Group of Thirty in their 2003 study states that reference data plays a critical role in securities clearance and settlement.10 They describe that poor quality, incomplete, incompatible, or inconsistent data can significantly reduce the efficiency and increase the risk of securities processing. They go on to say that the vital importance of reference data has not always been fully appreciated, and that perhaps the surprising complexity of the issues involved, both from a technical and an organizational standpoint, has hindered the ability of the financial services industry to implement fully effective reforms. They conclude by stating that while some progress was made during the last decade, the continued absence of comprehensive and widely adopted reference data standards that meet the needs of all users creates major costs and risks for industry participants. In 2006 the Group of Thirty’s Final Monitoring report was released (Group of Thirty, 2006). The industry’s progress was summarized as “The implementation of reference data standards has proven difficult. With no global owner of reference data and friction between the needs of the domestic and cross-border market users, progress has been slow. Future progress will require greater efforts by market infrastructure operators and international institutions with global reach.” The Securities Industry Association has identified ten items as essential to realizing the potential for improving the speed, efficiency and safety of the trade settlement process. Included among the ten are the development of industry matching utilities and linkages for all asset classes, the standardization of reference data and moving to standardized industry protocols for broker-dealers, asset managers, and custodians. The SEC in its request for comment on its concept release on securities transaction settlement specifically requested information and comment regarding “What, if anything, should the Commission do to facilitate the standardization of reference data and use of standardized industry protocols by broker-dealers, asset managers, and custodians?”11 The Depository Trust & Clearing Corporation (DTCC), the sole U.S. clearing agent and central securities depository for securities issues and fixed income instruments, states in their response to the SEC that the industry cannot yet move to T+1 settlement until, along with retail customer preparedness, it has achieved matching or affirmation on trade date and standardization of reference data.12 Fix Protocol Ltd created the Financial Information Exchange (FIX) protocol to standardize the communication of pre-trade and trade information. Since 1995 it has allowed counterparties and supply chain participants in capital market transactions to communicate electronically such information as indications of trading interest, placement of orders, receipt of executions, and the allocation and confirmation of trades for delivery and payment. In response to the SEC’s request for comment on what the SEC should do to facilitate the standardization of reference data, the FPL responded that it was “encouraging that the SEC recognizes reference data and standardized protocols as a significant issue” and commented further that reference data standardization is not as nearly developed as the FIX message standards that contains it.13
9
Omgeo, the trade matching utility, a joint venture of Thomson Financial and DTCC, in their comments to the SEC recognized that “the overall processing of any firm is as much a function of the efficiency of its trading counterparty as it is its own processing efficiency, the weakness of the few will tend to drag down the overall processing effectiveness of the many.”14 William DuMond, a faculty member of Metropolitan College of New York, in a response to the SEC’s request for comment restated an earlier era idea in suggesting the creation of an industry-wide security master file for archiving a “flawless ‘golden copy’” of descriptive material for securities.15 16 A complimentary idea, also of that era, was the centralization and dissemination of end-of-day closing prices.17 The industry turned down both ideas as it was proposed at a time when technology was conceptually up to the task but still expensive and data vendors were reluctant to go along, seeing their intermediation role and business models threatened. The retail industry is an industry that, over the same period of time as the securities industry, has accomplished its straight-through-processing goals while the securities industry has not. It was noted at an NYU conference comparing the retail industry to the securities industry (Grody, 1993) that the retail industry, which was burdened with the requirement to move physical goods, was well ahead of the securities industry in implementing standards of reference data and utilizing them in advanced systems, thus affecting the equivalent of straight-through-processing. Already at that time retailers had adopted electronic data interchange (EDI) standards for purchase orders and payments, the universal product code, and the bar code and utilized them in such straight-throughprocessing systems as direct store delivery, automated inventory replenishment, just-intime delivery, point of sale and quick response. Later innovations contemplate universal adoption of radio frequency identification codes embedded in products both at the retail level and at the supply chain level. Over a decade later this same theme was again echoed in a presentation by Merrill Lynch at an FISD conference on standards for market data (Brown, Vatsa, 2004). The argument again was laid out that the securities industry was lagging the retail industry in its ability to create standards for reference data so that it can move on to its own straight-throughprocessing world. This world, in retail at least, is now enjoyed by such diverse retailers as Wal-Mart, Levi Strauss and Associated Supermarkets. All are now benefiting from the significant effect on efficiency, productivity, pricing power and profitability. In stark contrast capital and investment market participants still have straight-through processing as a distant vision even though they have just the information flow to consider. While some progress has been made, financial enterprises are still debating the basics of reference data standards, while seeking the solution to the issue of faulty reference data, both precursors to achieving straight-through-processing. Like Wal-Mart in its industry, a handful of large financial enterprises interact with the vast majority of smaller securities firms, banks, insurance companies, investment managers and hedge funds in the capital and investment markets. They, in turn, use these larger firms’ services as traders, investment managers, prime brokers, paying agents, servicing agents, trustees, fiduciaries, escrow agents, clearing agents and custodians. In collaboration, as was done in the retail industry, they can set the industry on the right path toward permanent solutions to the reference data issue.
10
In a final comment within this retail analogy theme, Dr. Michael Hammer, of Reengineering the Corporation fame stated in a conference on Enterprise Data Management for the securities industry that “Wal-Mart has two assets, data and process, just like you”. He further chastised the securities industry for falling so far behind, not only the retail industry but the manufacturing industry, in its lack of ability to communicate across individual firm boundaries.18 1.4 Enterprise Data Management and Collaboration Today many voices for centralizing and standardizing reference data, and reducing costs and risks, can be heard, at a time when the technology is available at reasonable cost and when the cost savings and risk mitigation are demonstrably significant. Such voices can be heard within financial enterprises themselves, where major projects are underway to centralize various reference databases. Leading consultants, technology vendors, and outsourcing companies are promoting the centralization of reference data across the many business silos that independently source, maintain, distribute and process this data in a single financial enterprise (Accenture, 2006; Allen, 2006; Kentouris, 2005). To promote this activity the EDM Council was established in 2005 by technology and outsourcing vendors IBM, Sungard and Golden Source, and joined in 2006 by ADP, Bearing Point, Cicada, Deutsche Borse affiliate Avox, and Standard & Poors. Tinervin and Vales (2004) contend that trends towards consortia outsourcing and consortia buying will be driven by the continual evolution of Business Process Outsourcing (BPO) which is intended to help a company reduce its non-core, back-office transaction processing costs while improving customer service. The authors believe that new buying consortia in the financial services industry will account for an ever increasing share of this growing market. BPO is further seen maturing into Business Transformation Outsourcing (BTO) with the potential to transform the basic way in which a company does business, or even to change its business model, so as to increase performance, profitability and shareholder value (Tinervin, Vales, 2004). In a similar, transforming vision the Reference Data User Group (RDUG) describes an approach where a syndicate can be created for multiple use of one financial institutions solution on a commercial basis for the rest of the syndicate.19 Similarly, in reporting on Tower Group’s Matthew Nelson’s moderation of a panel at SWIFT’S 2006 Sibos conference “A New Age for Reference Data – Collaboration”, the delegates vote showed there was a “notion of collaborative space” as “collaboration will help to reduce risk, lower costs and, most importantly, ensure the quality of the data”.20 The detractors of industry-wide collaboration site failures such as the London Stock Exchange’s Taurus project and the Global Straight-Through-Processing Association’s (GSTPA’s) just-in-time matching service. Proponents site the successes of SWIFT, Fix Protocol Ltd., the CLS Bank and the Depository Trust & Clearing Corporation (DTCC). Collaborative efforts have been the hallmark for creating new trading venues in the US and, recently, this notion has spread to similar activities in Europe. A clear message regarding collaboration was voiced in IBM’s 2006 CEO Study (IBM, 2006). One theme of the study was that external collaboration is indispensable—CEOs stressed the overwhelming importance of collaborative innovation, particularly beyond company walls. However, CEOs also admitted that their organizations are not collaborating nearly enough. IBM’s admonition to CEO’s is to “Defy collaboration limits—Collaborate on a massive, geography-defying scale to open a world of possibilities”. 11
2.0 Operational Risk Operational risk exists throughout each financial enterprise, amongst its supply chain constituents and throughout the life cycle of a financial transaction. It can be observed as disruptions in both back-office recordkeeping and in transaction workflows, as incorrect asset pricing, and as encumbered securities movement and payment processing. While encompassing such process breakdowns, the consequences of operational risk also include ineffective technology, faulty decision-making and business interruptions.21 2.1 Operational Losses The majority of operational losses are due to transaction processing errors. Such losses result from human error, absence of proper procedures, failure to follow existing procedures, or inadequacies within the procedure when first established. Process losses are normally considered unintentional and correctable with proper business planning and controls. The next largest source of operational losses is due to employee violations of internal policies for intentional purposes (fraud). Remaining operational losses result from external forces, and systems or technology disruptions. (Harmantzis, 2003) Listed below is the complete set of the eight risk event categories promoted by the Basel Committee. These event categories are the basis for quantifying business liabilities and losses (see Table 1). Table 1 – Event Types & Loss Categories Event Types 1. Internal fraud 2. External fraud 3. Employment practices 4. Workplace safety 5. Clients/products/business practices 6. Damage to physical assets 7. Business interruption and systems failures 8. Execution/delivery/process management (Basel Committee, 2002)
Loss Categories 1. 2. 3. 4. 5. 6.
Legal liability Regulatory action Loss or damage to assets Restitution Loss of recourse Write downs (Haubenstock, 2002)
In a sample survey of 30 international banks conducted by the Basel Committee on Banking it was found that the highest loss event category was “Execution, Delivery and Process Management” a category that implicitly contains the consequence of faulty product related reference data (see Table 2 for the definition and examples of what constitutes this loss event). Table 2 – Event Type: Execution, Delivery & Process Management Event Type: Execution, Delivery & Process Management Definition: Losses from failed transaction processing or process management, from relations with trade counterparties and vendors Activity Examples: Transaction Capture, Execution & Monitoring & Reporting Customer Intake and Documentation Maintenance Miscommunication Failed mandatory reporting obligation Client permissions / disclaimers missing Data entry, maintenance or loading error Inaccurate external report Legal documents missing / incomplete Model / system misoperation (loss incurred) Missed deadline or responsibility Accounting error / entity attribution error Customer / Client Account Management Other task misperformance Delivery failure Unapproved access given to accounts Collateral management failure Incorrect client records (loss incurred) Reference Data Maintenance Negligent loss or damage of client assets Trade Counterparties Vendors & Suppliers Non-client counterparty misperformance Outsourcing Misc. non-client counterparty disputes Vendor disputes (Basel Committee, 2002)
12
This category accounted for approximately 42% of total operational loss events, with a total loss value of €908,000 (34.8% of the total). Another event type “Clients, Products & Business Practices” represented 27.5% of overall losses, a category (see Table 3) that also contains reference data.22 Unfortunately in the instructions to those who where asked to participate in the sampling this loss event category was described as the end tail of a flow chart that, if one made it to that end point and had not yet categorized losses in any other category, the remaining losses would be categorized as Execution, Delivery & Process Management. In hindsight this is obviously not a satisfying way to categorize what turns out to be the largest loss event. Table 3 – Event Type: Clients, Products & Business Practices
Event Type: Clients, Products & Business Practices Definition - Losses arising from an unintentional or negligent failure to meet a professional obligation to specific clients (including fiduciary and suitability requirements), or from the nature or design of a product. Activity Examples: Suitability, Disclosure & Fiduciary
Breach of Privacy
Misuse of confidential information
Fiduciary breaches / guideline violations Suitability / disclosure issues (KYC, etc.) Retail consumer disclosure violations
Account churning
Lender Liability
Aggressive sales
(Basel Committee, 2002)
In a follow-up survey of 27 US banking institutions conducted in 2004 by the U.S. Federal Reserve and thrift regulatory agencies and reported on in May, 2005, an additional event type and business line category “Other” was added, post facto, which resulted in the largest category of losses. 23 This loss for the event type “Clients, Products & Business Practices”, $5,820.5 million, represented 67% of this new “Other” business line category and 80.8% of overall losses. Like Execution, Delivery & Process Management (in this study it comprised 9.9% of overall loss value) if those filling out the data sheet made it to this end point and had not yet categorized losses in any other category, it would be categorized in this event type. This data collection exercise was, unfortunately, also flawed as, for example, 1) while all respondents submitted data for the Retail Banking business line, only half submitted data for Corporate Finance, 2) respondents reported losses at a mix of different threshold levels, from $0 and above to $10,000 and above, and 3) in aggregating the data, the ‘Other” business line, representing the largest total loss amount ($6,122.5 million and 70.8%) had to be created because of an inability to map these losses to any of the eight previously identified business lines. The authors of the data aggregation exercise stated that this suggested the classification of losses affecting more than one business line remains an industry challenge. We suggest that it may also point to the fact that some components of the transactions that underlie these losses are inherently systemic in nature. Given the pervasive nature of reference data in 70% of financial transactions, it also suggests that in future loss data collection exercises a more granular look at the accumulation of loss data related to faulty reference data is warranted, perhaps to be accounted for in a similar manner as one aggregates retail credit loss or check fraud data.24 Looking within the general structure of the BIS’s broad categorizations (see Table 4) it would appear that the Payment & Settlement business line, now categorized under Banking and, thus, suggesting monetary settlements exclusively, should be reviewed with 13
a view to it being included as a loss event type as well, under the Asset Management, Trading & Sales and/or Corporate Finance business lines, to assure that the loss data collection exercise captures securities settlements in addition to money settlements. Table 4 – Mapping of Business Lines Mapping of Business Lines INVESTMENT BANKING
Corporate Finance
Trading & Sales
Corporate Finance Municipal/Government finance Merchant Banking Advisory Services
Sales Market Making Proprietary positions Treasury
(Mergers and Acquisitions, Underwriting, Privatizations, (Fixed Income, equity, foreign exchanges, Securitization, Research, Debt (Government, High Yield) commodities, credit, funding, own position securities Equity, Syndication, IPO, Secondary Private Placement) lending and repos, brokerage, debt, prime brokerage
BANKING Retail Banking
Commercial Banking
Retail Banking
Commercial Banking
(Retail lending and deposits, banking services, trust and estates)
(Project finance, real estate, export finance, trade finance, factoring, leasing, lends, guarantees, bills of exchange)
Private Banking (Private lending and deposits, banking services, trust and estates, investment advice)
Card Services (Merchant/Commercial/Corporate cards, private labels and retail)
Payment & Settlement *
Agency Services
External Clients
Custody
(Payments and collections, funds transfer, clearing and settlement)
(Escrow, Depository Receipts, Securities lending (Customers), Corporate actions)
Corporate Agency (Issuer and paying agents)
Corporate Trust OTHERS Asset Management
Retail Brokerage
Discretionary Fund Management
Retail Brokerage
(Pooled, segregated, retail, institutional, closed, open, private equity)
(Execution and full service)
Non-Discretionary Fund Management (Pooled, segregated, retail, institutional, closed, open) *Payment and settlement losses related to a bank’s own activities would be incorporated in the loss experience of the affected business lines.
(Basel Committee, 2002)
2.2 Regulation Capital adequacy is a fundamental tool in the regulation of financial enterprises. The primary purpose of capital in a financial institution is to absorb financial risk, not to fund assets of the business. Financial risk is the difference between what one expects to happen (EL - expected losses) and what could happen (UL - unexpected losses). Provisions may be made within budgets to cover for the expected losses, but it is the capital reserves that exist to absorb the unexpected losses. (Matten, 2000). 14
The New Basel Capital Accord, known as Basel II, is a regulatory initiative within the global financial industry to strengthen the capital framework for large, internationally active banking organizations and other financial institutions. Along with revising the minimum capital standards already covering credit and market risk, Basel II sets a new minimum capital standard for operational risk. Still undetermined, however, is whether minimum operational risk capital will be inclusive of expected losses, which are now provided for in loss reserves for such items as commercial loan defaults, credit card receivable write-offs, etc. or just assigned based upon unexpected losses. Some believe expected losses should be excluded from these capital calculations. The head of operational risk at Citigroup believes losses that are essentially routine losses should be excluded from operational risk capital just as is done with economic capital. Such losses are routinely mitigated by insurance, built in to pricing structures, and guaranteed by clearing houses, etc.25 However, the Securities Industry has long been guided by the SEC’s net capital rule, Rule 15c3-1, adopted in 1975, which incorporates operational capital requirements for such routine expected losses as those resulting from transactional failures, un-reconciled items, un-responded to voluntary corporate actions, etc. These, too, have been routinely priced into the business model and protected by insurance but still such losses continue to be factored into the SEC’s minimum regulatory capital requirements. While requiring capital to protect against operational risk losses, the new framework is meant to encourage banks to improve their risk management techniques so as to reduce operational risk exposure and mitigate losses resulting from operational failures. The new capital accord provides the incentive of lower capital requirements to those banks that demonstrate strengthened risk management practices and reduced risk exposures. (Haubenstock, Andrews, 2001).The idea of mitigating risk associated with faulty reference data, and how one assesses operational capital reduction in this regard has not, until now, entered the debate. In the U.S. the Federal Reserve is requiring large US-based, multinational banks to adopt the Basel II requirements including those related to operational risk. The Fed previously announced that the top 10-12 US banks, including JP Morgan Chase, Citibank, and Wachovia, would have to comply with the Basel Advanced Measurement Approach for capital allocation. (Allen 2004). It is assumed that an additional like number would adapt the Basel II regime. As part of its effort the Fed, in late 2005, initiated another study, the Quantitative Impact Study 5 (QIS5), and thereafter published guidance (Notice of Proposed Rulemaking) for banks to use to conform to the new requirements. This guidance has met with resistance from the largest of banks in response to certain calibrations and methods that would, they believe, put US domiciled financial institutions at a disadvantage to foreign firms. Under rules proposed in 2003 by the SEC's Consolidated Supervised Entities (CSE) regulations, five large US Securities houses, Merrill Lynch, Goldman Sachs, Bear Stearns, Morgan Stanley, and Lehman Bros. will be required to abide by the Basel II regulations (Allen 2004). Other "brokerage firms" are owned by banks and will thus be supervised by the Fed’s requirement to adhere to the Basel II framework. 26 The SEC’s rules establish regulatory guidelines for a Supervised Investment Bank Holding Company (SIBHC), which includes requirements to establish a group-wide internal risk management control system, record keeping, and periodic reporting. This reporting will specifically include reporting consolidated computations of allowable capital and risk 15
allowances consistent with the standards published by the Basel Committee on Banking Supervision.27 2.3 Capital Requirements The industry wide capital requirement for operational risk is expected to average 12% of total bank regulatory capital. (Kuritzkes, 2002) Researchers estimate that operational risk should account for 20% of total risk capital for normal banking operations and even as much as 50% in highly fee driven businesses. As banks enter more highly operational, transaction-based businesses such as brokerage, insurance, and other such product areas the importance of operational risk capital is likely to increase. (Matten, 2000) $56 billion of regulatory capital will be required for operational risk for US banks alone under Basell II (Kuritzkes, 2002). Individual bank’s total operational risk capital is set equal to a percentage of risk-weighted assets. Of this amount at least 50% must be Tier 1 capital. Tier 1 capital consists of equity capital and disclosed reserves. The remaining 50% should be in the form of upper and lower Tier 2 capital. Tier 2 capital, or supplemental capital, consists of certain types of long-term debt and certain reserves. For example Citigroup's total regulatory capital (Tier 1 & 2) was $100.9 billion at year-end 2004 of which $8.1 billion was allocated to operational risk.28 If the objective of the Basel Accord, as stated, is to create a new capital charge for OpRisk in the range of 12% of regulatory capital, then $12.1 billion in capital would be required, or $4.0 billion in additional capital. At a 5% cost of capital an additional $200 million cost would be incurred. JP Morgan Chase would have required an additional $7.1 billion in capital in 2004 and have incurred additional costs of $355 million. 29 The Federal Reserve Bank of Boston noted that in 2003 Deutsche Bank allocated €2.5 billion and J.P Morgan Chase US$5.8 billion for operational risk capital and that, on average, the large banks allocated 15% of their capital to support operational risk.30 In 2003 Citigroup allocated $6.1 billion to operational risk capital of which it can be extrapolated that approximately $1.1 billion was for the capital market/investment businesses. 31 At another recent Federal Reserve conference on Operational Risk, the SEC reported that since the early 1970’s broker/dealers have been subjected to capital charges for such operational risks as aged failed to delivers, short securities differences, suspense account items (essentially securities transactions that cannot be completed for various reasons), and reconciliation differences (unfavorable bank account, correspondent account, clearing corporation and securities depository reconciliation differences).32 Other categories of capital charges include aged corporate actions receivable and aged transfers not confirmed. The value of these deductions from net capital is significant. For example, the Banc of America Securities reported aged fails-to-deliver in the first quarter of 2005 of $177 million.33 Further, participants of clearing organization must allocate capital to support the guarantees and risk management practices of these industry-wide risk mitigating entities. For example DTCC and its clearing and settlement subsidiaries, NSCC, FICC and GSCC collectively held $10.6 billion of such participants’ funds at year end 2004.34 The most sophisticated methodologies are designated as Advanced Measurement Approaches (AMA) and include three broad capital calculation methodologies. The Internal Measurement Approach uses a standard industry factor (gamma) at business line 16
and risk level, multiplied by the institutions’ expected loss related to operational risk for a capital allocation amount. The Loss Distribution approach uses an actuarial methodology in which distributions are constructed based on historical internal and external loss data to arrive at a capital allocation figure. The third approach, the Scorecard approach, uses a firm wide capital charge and allows for reallocation of this amount over time based on risk indicators or other qualitative criteria. (Haubenstock, 2002) These measurement approaches are to provide a capital requirement equal to the sum of a bank’s expected and unexpected losses. The Basel standards committee has alluded to exceptions for capital relief of expected losses assuming financial enterprises can capture expected losses in the bank’s internal business practices and demonstrate this ability to the satisfaction of regulatory supervisors. (Green, Grody, 2004) Under the AMA approach, regulators will give financial enterprises the ability to take a reduction of 10-25% of the total operational risk capital charge. This equates to the recognized risk mitigation effects of insurance. The Basel Standards Committee’s third consultative paper has also made it possible for banks to embrace a partial adoption of AMA as well as making the use of insurance an acceptable risk mitigation option for operational risk capital reduction. (Green, Grody, 2004) Capital allocation methodologies must use consistent internal definitions. Without consistency the possibilities of double counting risk mitigation effects and qualitative assessments will skew capital requirements away from actual risk management needs. The standards committee has put a strong emphasis on the collection of internal loss data as being critical to estimating loss experience and tying it into the current business activities, technology processes and risk management procedures. (Green, Grody, 2004) Adequate management information systems will be crucial to the effective process of capital allocation. (Matten, 2000) 2.4 Modeling Operational Risk The basic approach to modeling operational risk has evolved from the accepted models used in modeling market and credit risk. Under this approach, really a collection of many different stochastic techniques, referred to as the loss distribution approach (LDA), banks estimate, for each business line/risk type cell, or group thereof, the likely distribution of operational risk losses over some future horizon (Basel requires a one year period). The Value-at-Risk (VaR) and resulting capital charge from these calculations is based on a high percentile of the loss distribution (Basel requires a 99.9% confidence level). See Figure 2. This overall loss distribution is typically generated based on assumptions about the likely frequency and severity of operational risk loss events as it is with internal measurement approaches as well. In particular, LDA’s usually involve estimating the shape of the distributions of both the number of loss events and the severity of individual events. These estimates may involve imposing specific distributional assumptions (i.e. a Poisson distribution for the number of loss events and a lognormal distribution for the severity of individual events) or deriving the distributions empirically through techniques such as boot-strapping and Monte Carlo simulation.
17
Figure 2 - Typical Loss Distribution for Operational Risk
99.9%
An overall capital charge may be based on the simple sum of the operational risk VaR for each business line/risk type combination which implicitly assumes perfect correlation of losses across these cells or by using other aggregation methods that recognize the riskreducing impact of less-than-full correlation. This method differs from internal measurement approaches in one important respect: it aims to assess unexpected losses directly rather than via an assumption about the relationship between expected loss and unexpected loss. That is, internal measurement approaches estimate a single parameter of the overall loss distribution, expected losses, and assumes that the relationship between expected and unexpected loses (essentially, the shape of the loss distribution) is fixed regardless of the level of expected losses and how the various components of expected loss frequency, severity, and scale are combined. In contrast, the loss distribution approach allows for this distribution to vary with both the level of expected losses and with variation in its components. Thus, there is no need for the determination of a multiplication (gamma) factor under this approach. Presently, for operational risk there are several LDA methods being developed and no industry standard has yet emerged.35 See Figure 3. Generally, an LDA model is a quantitative methodology for assigning dollar values to expected and unexpected losses. Although quantitative methods in operational risk management have become more common in the last two decades [Crouhy, Mark, Galai, (2000), Jorion, (2000)], the quantification of operational risk is not a trivial exercise. A composite of methodologies currently being tested by financial institutions would suggest that an accepted approach would be actuarially based. Actuarial models have long been used by risk management groups in leading institutions to quantify, for example, insurance risk (Hamantzis, 2002, 2003).36 Applying statistical distributions, as actuarial models do, would result in assigning probabilities to loss events. By performing Monte Carlo simulations (Law, Kelton, 1999) a full loss distribution model results. More specifically, applying a Poisson distribution (Grimmett, Stirzaker, 2001) would result in the simulation of the number of events (credit card frauds, transaction errors, etc.) per year, i.e., the frequency. The Poisson distribution is commonly used for event (or jump) risk in the insurance industry. The main advantage is that it requires only one parameter (the λ > 0 parameter), so it is easy to calibrate. Current methodologies being tested would suggest a sample from a LogNormal distribution (Grimmett, Stirzaker, 2001) would be appropriate to simulate the dollar loss per event.37 18
These assumptions, we believe, are reasonable and provide a practical model-based solution (Harmantzis, 2002). Further, various models assume that the correlation among risk types is zero, that is to say that all risk types are completely independent of each other and, therefore, bad outcomes in individual risk types are not likely to happen at the same time. The independence assumption is intuitive for some risk classes while less intuitive for others. In general, there might be some positive correlation among some of the risk types, especially when viewing losses across business lines due to some underlying transaction failure, i.e. erroneous counterparty number, erroneous product code, incorrect credit rating, etc. but more investigation of this positive correlation is warranted as significant cross business line loss events have been observed.38 Figure 3 – Modeling Operational Risk There are many experimental activities being conducted to determine the appropriate models for determining operational risk (Embrechts, Kluppelberg, and Mikosch, 1997, Cruz, 2002). Allen and Bali (2005) suggest a new residual operational risk (OR) measure to determine 1% OR Value-at-Risk (VaR). The authors used equity returns for financial institutions to estimate both catastrophic and operational risk measures over the period 1973-2003. They found that OR is quite significant, comprising approximately 18% of the total equity returns of financial institutions. The paper presents the first evidence of procyclicality in OR measures. Silke (2004) incorporates insurance contracts into an OR model based on an idiosyncratic and common shocks model by Lindskog and McNeil (2003). The author proposes a model to recognize the mitigating effects of OR insurance within an AMA approach based on common shocks. Chernobai, Menn, Svetlozar (2004) suggest a compound Poisson process with Lognormal losses for OR modeling. The paper examines an important issue: the impact of possibly censored and/or truncated data on the estimation of loss distribution. The paper demonstrates the use of the Expectation-Maximization algorithm for parameter estimation, as suggested by the Basel Committee. Authors illustrated that ignoring the missing (or truncated) data and fitting unconditional distribution to the available data set leads to biased estimates. Clemente, Romano (2004) use Monte Carlo (random variable) simulations in order to determine the loss distribution and measure OR via Value-at-Risk (VaR) and Expected Shortfall (ES). Their methodology is based on a frequency/severity model. However, the severity for each business line/risk type is modeled through a Lognormal distribution in the centre and in the left tail, while they use Extreme Value Theory (POT technique) for the right tail. Moreover, authors consider dependences using copula functions (Student’s t-copula), showing that this approach might reduce the capital requirements.To calibrate their model, the authors use a US database of 23 years of catastrophe insurance loss data of three different insurance lines (that could be considered as a limitation to their model). Embrechts, Kaufman, Samorodnitsky (2004) aims at encouraging a better exchange of ideas between actuaries and risk managers. Authors present how insurance analytics could be applied to OR modeling and measurement (mathematics from non-life insurance for example); however, they doubt that a full OR capital charge can be based solely on statistical modeling (some risks, e.g., people risk are difficult to quantify). Since large losses are a main concern, authors advocate that Extreme Value Theory (EVT) can play a major role in analyzing such data. Chavez-Demoulin and Embrechts (2004) propose an adapted EVT method taking into account non-stationary (time dependent structure) and covariates (changing business and/or economic environment). De Fontnouvelle, De Jesus-Rueff, Jordan and Rosengren (2003) use publicly available, real data to quantify OpRisk (data provided by two vendors: OpRisk Analytics and OpVantage). According to their results, capital charge for OR will often exceed that of market risk. Their estimates are consistent with the $2- $7 billion dollars in capital that some large international banks are allocating for OR. There are several issues related to “external” loss data, e.g., sample selection bias, reporting bias, unknown/different truncation points, etc. The author’s use an econometric model in which the truncation points for each loss, i.e., the dollar value below which the loss is not reported, is modeled as an unobserved random variable. They model the underlying loss distribution using Extreme Value Theory (EVT). They find that the distribution of observed losses varies significantly by business line and that supplementing internal data with external data on extremely large rare events could improve banks’ OR models. Ebnoether, Vanini, McNeil and Antolinez-Fehr (2001, 2003) present case studies on OR measuring: The authors show that for a production unit of a bank with well-defined workflows OR can be unambiguously defined and modeled. The study comprises 103 production processes. The authors use both historical data and self-assessment information. Towards a quantitative approach, the authors use EVT for modeling (a beta-GPD-mixture model, lognormal model), simulations, and well-known metrics, e.g., VaR and Credit VaR. Results are quite robust under stress testing. Embrechts, Furrer and Kaufmann (2003) argue that traditional modeling approaches, including EVT, reach their limits as the structure of OR loss data is barely in line with the modeling assumptions. To quantify regulatory capital, they suggest using a VaR measure. They have shown how actuarial techniques in principle could be used for estimating high quintiles of unknown loss distributions. Medova and Kyriacou (2002) apply EVT (POT method) to calculate economic capital requirement against unexpected OR losses. As the conventional maximum likelihood (ML) estimation method performs unstably when it is applied to small or even moderate sample sizes, the suggested implementation is based on Bayesian hierarchical Markov Chain Monte Carlo (MCMC) simulations. The authors advocate Bayesian procedures at the level of business units, which allows more efficient capital allocation.
19
The output of a typical LDA model consists of 1) The Expected Loss (EL), which is the average loss as calculated from the (cumulative) loss distribution, and 2) The Value at Risk (VaR), which summarizes the worst loss over a target horizon (one year) within a given confidence interval, e.g., 99.95 percent (Crouhy, Mark, Gala1, 2000). The statistical accuracy of the VaR number depends on the number of simulations. The more simulations, the more accurate the result will be.39 2.5 Operating Measures & Risk In recent years, scrutiny has been applied to “indicators” of areas of high risk and loss. Key Risk Indicators (KRIs), e.g., percentage of transactions that have not been settled, percentage of transactions requiring some manual intervention, etc. (Taylor, Davies, 2003) has emerged as a leading concept to predict potential losses within a certain confidence level. While industry members acknowledge the usefulness of KRIs, it is still difficult to identify which KRIs among the ones they track, work the best. While KRIs, like operational risks, is not new, common language, standards and framework is needed. (Taylor, Davies, 2003) In 2003, the Risk Management Association (RMA) sponsored and RiskBusiness International facilitated the launch of a project to define and specify Key Risk Indicators for major operational risks throughout financial institutions.40 The purpose is to improve the usefulness of KRIs in managing operational risks through standardization, benchmarking, loss analysis and the development of related best practices. (Taylor, Davies 2003). They have compiled a list of 1809 key risk indicators to establish a common language, common standards and best practices around these indicators – to be thought of as common definitions of what comprises each “bucket” of a risk category within the Basel II operational risk indicators approach.41 Today there are over 50 organizations from across the globe actively participating in the KRI study. They are currently exploring the feasibility of conducting a similar study, targeting insurance and assurance firms.42 Financial institutions generally have not yet accumulated a robust set of historical internal loss data to use in the mappings at the Business Line & Event Type levels required by Basel. They tend to have accumulated operating statistics, like transaction matching rates, failure rates and amounts, etc. used in day-to-day management of their operations. The majority of US banks are planning to accommodate the implementation of the AMA by mapping their "statistics" (now to be standardized and known as KRI's) into cells that represent the intersection of Basel’s Lines of Business with Basel’s Loss Event Types. The expected outcome of this mapping exercise is the construction of a loss data base at a granular enough level so that it can be used to tie loss data back to departmental operating metrics (KRI's). This, in turn, can be used to guide operating management in mitigating risk by lowering their departments’/business’ lines losses. This is critical if operating management is to be held accountable for reducing losses due to operational failures and its mitigating effect on lowering capital requirements for operational risk. In assessing the impact of faulty reference data, a set of KRI's would be required indicating these loss occurrences at a granular enough level to measure this effect. Such granularity would entail, for example, collecting information on the number of failed-tomatch securities and amount of loss associated with each, sub categorized with an indication that one failed because the wrong security code was used, another failed 20
because the wrong counterparty account number was used, another failed because the delivering custodian’s code was wrong, etc How do we go from such statistics to Operational Value at Risk (OpVaR) and Operational Risk (OpRisk) capital? And how do we show that if the operating management lowers the KRI values, i.e. less fails, less losses, it is directly tied to lower OpRisk capital? In relating proven approaches in credit risk management to operational risk, it was noted that credit failures can be referenced to an obligor whose total exposure and risk rating are known. However, there are no standard practices to reference operational risk loses to the operational processes that created them, let alone associate an appropriate measure of exposure and a standardized probability of failure. In this regard, a number of approaches are being vetted in individual financial enterprises. In one approach KRI’s are used to estimate the probability of an event (PE), analogous to the probability of default (PD) used in credit risk management.43 In another approach, the basic assumption is the proposition that transactions drive the largest components of operational risk and the probability of operational losses increase as the volume and complexity of transactions increase. In fact, Northern Trust estimates that 90% of its loss events are associated with a single Loss Event Type, Execution, Delivery and Process Management owing to its primary focus on capital markets’ fee based transaction services.44 One such methodology calls for assigning risk measurement units and risk mitigation indicators to value the risk exposures and the effectiveness of loss prevention procedures (described conceptually in Basel as a Risk Control Self Assessment). The critical starting point is engaging operating management in what is ostensibly a subjective process, but one best conducted by experienced individuals using robust data points comprised of number of events (frequency) and losses (severity) at the KRI level ( Hughes, 2004). While such robust data is not available on external loss data bases as their minimum threshold is $1 million, more granular data is being kept by individual financial organizations. State Street Bank reports its data base contains data points at a level of loss starting at $500 but for most the norm appears to be starting at $10,000. 45 The resulting values, aggregated and mapped against Basel’s Lines of Business and Loss Event Types can provide the mechanism for tying the operating statistics and associated losses (KRI’s) to the Loss Distribution Analysis and the OpVaR (Basel’s severest losses beyond the 99.9% confidence level). In yet another approach to modeling operational risk, this more directly associated with reference data, Ramamurthy, Arora and Ghosh (2005) apply Bayesian belief networks to determining losses associated with missed corporate action announcements. Its fundamental technique is to use probability distributions based on subjectively determined prior casual risk factors or “beliefs”. Constructing the loss model requires identifying the key variables, determining their cause and effect relationships, and assigning probability distributions to each of the variables based on prior knowledge of operational parameters (which can be thought of as Key Risk Indicators). The authors believe such a technique, because it focuses on the casual relationships rather than the effect, is most useful when historical loss data is not readily available, as is the case with losses due to faulty reference data at this time.
21
2.6 Operational Risk Management More than 250 organizations from the global financial industry responded to a 2004 international survey of operational risk management conducted by SAS and Risk Magazine. The majority of these firms were medium to large financial institutions. While they agree it will take some years before best practices are established, financial institutions see operational risk management as a significant new discipline. Basel II and related domestic regulation are considered to be the key factors driving these programs and while the current regulatory framework does lack clarity, this is not appearing to hold most organizations back from proceeding with plans to improve operational risk management.46 The survey respondents identified information technology and systems failure as the biggest source of operational risk. Within that response, respondents further indicated that transaction processing failures and financial accounting/reporting are high on the list of identified operational risks that have considerable impact on the business.47 However this is not born out by the BIS loss data which shows the event types associated with product and client related transaction failures are the leading source of operational risk losses. Interestingly enough, respondents were comfortable in quantifying the economic rewards of operational risk management. They estimated that they could achieve a 10% reduction, on average, of economic capital in a time horizon of 12 months. In addition, they see significant benefits from the result of actual loss reduction. On average, survey respondents expected loss reduction to exceed 17% in a time horizon of 12 months. However, it is unrealistic to expect that reduction in losses will be achieved immediately. As programs get implemented and companies start reporting losses that previously went unreported, performance may deteriorate in the short run. In addition, respondents see the benefits of operational risk management going beyond financial and regulatory benefits to improved business and performance management.48 Perhaps the most striking finding in this survey is that over the last two years the industry continued to identify the same key obstacles to effective operational risk management. Difficulty in collecting sufficient volume of historical data is the prime obstacle, while difficulty in ensuring the quality of the data is also high on their list of obstacles.49 Finally, no real movement toward a common framework for operational risk measurement has yet emerged, lacking the loss data bases and the real understanding of how to accumulate loss data and tie it to measures of operational effectiveness. Without this basic understanding there can be no real rationale for demanding operational risk capital to be set aside as a mechanism to incent financial institutions to mitigate their operational risk. The consequence is that operational losses will continue to be categorized as either market or credit losses, especially those that are eventually found to have occurred due to faulty data.
3.0 Reference Data The problems of failed transactions due to misrepresented reference and transactional data has been an issue in the securities industry for nearly four decades. Gaining prominence first during the back-office crisis of the late 1960’s, the problem was magnified over the decades by huge increases in volume, the institutionalization of 22
markets, the growth in cross border transactions, the proliferation of new markets, notably options, futures, derivatives and currencies, and the proliferation of cross product trading strategies. Reference data has not always been appreciated as a fundamental industry-wide problem, perhaps due to the surprising complexity of the issues involved, both from a technical and an operational perspective. Also, organizational impediments, both within financial enterprises and across industry-wide infrastructure entities, have hindered the ability of the financial services industry to implement more robust straight-through-processing systems. Today many voices for centralizing and standardizing reference data, and reducing costs and risks, can be heard, at a time when the technology is available at reasonable cost and when the cost savings and risk mitigation are demonstrably significant. Such voices can be heard within financial enterprises themselves, where major projects are underway to centralize various reference databases, and amongst consultants, technology vendors, and outsourcing companies which are promoting consortiums of firms to centralize reference data sourcing, normalization, maintenance, distribution and processing. 3.1 Definition of Reference Data In the financial industry, reference data has many definitions. One such definition is “a set of descriptive information about financial instruments and the business partners that trade them.”50 Specifically, reference data is the underlying transaction data defining 1) securities and their issuers 2) accounting and reference prices, and corporate actions affecting these securities, 3) corporate customers and/or counterparties, and their trading and delivery instructions, and 4) referential information associated with the above three categories. The definition for the purpose of this paper more closely aligns with the Group of Thirty’s definition. Reference data uniquely identifies a financial product (security number, symbol, market, etc.), its unique type, terms and conditions (asset class, maturity date, conversion rate, etc.), its manufacturer or supply chain participant (counterparty, dealer, institution, exchange, etc.), its delivery point (delivery, settlement instructions and location), its delivery or inventory price (closing or settlement price) and its currency. Analogous to specifications for manufactured products, reference data also defines the products’ changing specifications (periodic or event driven corporate actions) and seasonal incentives or promotions (dividends, capital distributions and interest payments). Examples of reference data include such basic items as: • • • • •
Issue identifier (number schemes-CUSIP (U.S.), SEDOL (U.K.), ISIN (International), RIC Code (Reuters), symbol (exchange specific), exchange or market traded on (MIC), et al Type of security (common stock, preferred stock, corporate bond, municipal bond, option, future, commodity, swap, et al) Terms & Conditions (maturity/expiration dates, conversion dates and rates, sinking fund provisions, deliverable equivalents, reset dates, etc.) Credit rating, credit history and industry categorization (Moody’s ratings, S&P identifiers and ratings, Fitch ratings, Basel II operational risk reporting categories, SEC identifying data, Dun & Bradstreet identifying data, et al) Loss distribution and loss event data 23
• • • • • • •
Economic and fundamental data, research data Corporate customer identification for financial institutions and counterparties to include department, fund, trading entity, agent (Swift BIC codes and their proposed extension to International Business Entity Identifiers –IBEI’s) Accounting, valuation, referential and collateral prices and formulas (historical prices, closing prices, bid and offer prices (quotes), last sale prices, time series, volatilities, correlations, factors, etc.) Regulatory, taxing jurisdiction and government fee schedules and rates (SEC, FSA, MOFA, BVA, et al), regulatory fees, tax withholding rates, commission rates, etc. Corporate actions (stock splits, proxy notifications, mergers, tenders, et al) Dividend and interest declarations, capital distributions Calendar information (holiday’s, expiration of contract dates, etc.)
It should be pointed out that prices which are seen on a stock ticker, or used in the front office for trading purposes, and commonly referred to as market data is included as reference data, in this paper, when such data is produced from electronic trading venues. The previous distinction set out in our earlier paper, separating real time market data from reference data no longer obtains as most creators of such data have complete and infallible control over the creation of the price data as it is all derived electronically, thus moving it into the undifferentiated, common-to-all, commodity-like nature of reference data. In fact, both the US’s National Market System (NMS) and the European’s Markets In Financial Information Directive (MiFid) implementations are designed to separate previously value added real-time market data into a commoditized undifferentiated component, the consolidated quote and last sale information for which fees are based on cost plus a regulators allowed profit margin, and a new value added component, reserve quantities, depth of book, broker volumes, et al to which each exchange can add value based pricing. A more encompassing term, Data Management, is used to describe the management of reference and such market data, and an even broader term, Enterprise Data Management, further encompasses the management of proprietary referential data (client account numbers, internal model generated prices, internal client credit limits, etc.) and transaction and position data. Each exchange or price discovery mechanism, or its associated clearing and settlement facility, publishes many reference prices (closing price, settlement price, last sale price, last quoted price, bid and offer price, et al). They also use differing procedures at the end of the trading day to determine the reference price used as the settlement price for valuing portfolios and collateral, and for margin (loan) calculation purposes. Also, reference prices for some non-exchange traded instruments are aggregated and distributed by their dealer associations, others have no central mechanism for aggregation and are either left to individual firms “calling around” to get dealers’ prices, or left to entrepreneurs to build an aggregation and distribution service. Still other financial instruments, which either trade infrequently, or are not expected to trade at all, are priced through formula. Municipal bonds and over-the-counter derivatives are examples, requiring such reference data as credit ratings, historical prices, calendar data, etc., as inputs to these calculations. Finally, while account information (customer number, name, address, country of citizenship, assets/net worth, type of account, various papers/legal documents, et al) is truly reference data it is not the subject of this discussion as it is left to each separate financial organization to define their own numbering systems and codes. These are proprietary to each organization and, thus, do not respond well to industry-wide standards 24
initiatives or other collective activities, although faulty account data does appear as loss events and thus effects operational risk capital considerations. However, where these accounts are also financial institutions and/or financial intermediaries, institutions and/or corporate clients, and other forms of supply chain entities, the potential exists for such account information to be standardized as part of counterparty and supply chain information. 3.2 Data Management Systems Data management systems are at the center of all transactions (see Figure 4), providing critical data about the essential elements of each transaction. Figure 4 – Enterprise Reference Data Systems Front Office Sales, Trading, Order Mgmt., Research
P&L, Account & Risk Management
Middle Office Credit, Pricing, Risk Analysis, Regulatory Reporting, Collateral Management
Affirmations, Confirms, Resets
Back Office
Custody, Valuation Clearing & Asset Services, Settlement Corporate events
********* Reference Data Required ********* Instrument & Calendar Client & Counterparty Corporate Actions Currency Market Product Characteristic Credit Ratings Market Data
Instrument & Calendar Client & Counterparty Corporate Actions Accounting data Formula data Deal/price data Settlement prices
Instrument & Calendar Client & Counterparty Corporate Actions Settlement instructions Delivery Instructions Valuation prices Loss & Risk
Data management systems are defined as information processing systems that perform the following basic functions: • • • • •
Collect reference data from a myriad of commercial data providers (e.g. Reuters, Bloomberg, Standards & Poors, ANNA Service Bureau, et al) Consolidate provider data into a common model set to standards and a common semantic for all groups using the reference data application(s) Proactively cleanse data using rules for the detection of suspect data and the resolution of missing data values Coordinate manual intervention, as necessary, to handle exceptions that cannot be automatically processed Distribute data internally and externally to information consumers such as traders, portfolio managers, accountants, compliance specialists, and business intelligence analysts51
The current state of implementation of data management systems within financial enterprises is evolving. These systems exist both as newly implemented centralized activities supporting multiple business applications, as described above, and also as separate processing components incorporated within each legacy business application. 25
The present situation of separate business units incorporating duplicate reference data acquisition and processing is slowly giving way to more integrated systems across the enterprise, not only for reference data but for transaction processes aligned with these business units. This is due, in part, to the evolving all electronic order management and trade execution systems and the practice of integrated trading of products with instruments for hedging risk or conversion into other currencies. It is also due to the evolving real-time integration of executed trades within firm-wide financial, risk management and P&L reporting systems. Market researcher Aite Group estimates that the industry spent $1.1 billion on data management technology projects in 2004 (Aite, 2006) while Tower Group (Tower Group, 2006) estimated that the average firm spent $3.1 million in 2005. In addition, the Tower Group survey estimated that 9% of respondents spent over $10 million on these projects. 3.3 Data and Information Costs It should be noted that while a number of studies cited in this section refer to numbers of people and costs associated with reference data, there is no consistency as to the definition of reference data across all these studies and surveys. Some refer to reference data as exclusive to stocks and bonds and exclude such areas as foreign exchange, futures, options and over-the-counter derivatives. Some only focus on product data, others exclude counterparty data. Some exclude corporate events (aka corporate actions) from its definition of reference data, preferring to confine their definition to static data exclusively. Some describe corporate events in their definition of reference data but include only non-voluntary events. Some definitions include proxy solicitations and the process of periodic event notification of payments of dividends and interest, some don’t. Some include the event notification exclusively, others include the follow-on process whereby customers’ requested options are acted upon and/or payments are deposited into their accounts. Finally, non-identifiable costs, those which are part of operating budgets not identified exclusively as reference data activities, are generally not accounted for. Such costs are imbedded into the workflow and applications of multiple business lines and operating departments. In the larger firms, such unidentified imbedded costs are thought to be a significant additional cost component of reference data. While benefits from straight-through processing and operational efficiency have provided some motivation to improve data management, the discretionary nature of these issues has not incited a high enough level of motivation. The force of regulatory compliance, both the Sarbanes-Oxley requirements for identifying clients, business partners and their corporate affiliations, and the Basel II operational capital requirements are driving firms to take a strategic approach to reference data management. The development of securities messaging standards such as ISO 15022 and ISO 20022 are supporting a standardized approach to data of all kinds including reference data. Executives are beginning to realize that significant savings and efficiencies are to be gained by rationalizing data sources between disparate silos of business activities. Firms are looking to implement strategic approaches to leveraging data management across the front, middle and back office functions. Determining costs to the industry for data (revenues derived from the data “business”) can be difficult as it requires carving out revenues from some vendors’ overall activities, and many vendors are private entities. Inside Market Data (IMD), an industry newsletter 26
publisher and researcher, has done the most in sorting out this problem and providing a reasonable and reasoned logic to its categorizing the industry’s spend rate for what it describes as Data and Information, which it identified as $13.1 billion in 2004 (Inside Market Data Reference, 2006). Others have attempted to research the data spend rate of the financial industry, but its definitions vary and the items included are constantly changing. See Figure 5. Figure 5 - Summary of Reference Data Surveys’ on Costs, Spending and Revenue According to A-Team Consulting's analysis total revenues in the reference data market in 2001 was $545.59 million (£373.69). Of this total FT Interactive Data had 52 %, followed by Telekurs Financial with 11% percent, Reuters (including the EJV bond evaluations business) with 10%, Standard & Poor’s with close to 9%, and Bloomberg with 8%. Other data vendors included Exchange Data International (EDI) and Fininfo. A-Team Consulting believes that as a result, the business will grow to a minimum of $687.28million (£487.17 million) by 2005.52 According to Inside Market Data total revenues in the “Data and Information” market in 2004 was $13.624 million. This market segment definition is derived from excluding from total revenue earned by the data vendors, including exchanges, inter dealer brokers, credit rating companies and ECN’s (Electronic Communications Networks) that which is transactional services and software applications. We believe this results in a market segment that includes both commoditized real-time market data and other reference data, principally reference data as defined in our previous paper (closing and valuation prices, instrument and supply chain data, credit ratings, et al). Over half of this total (53%) is distributed over three vendors, Bloomberg (23%), Reuters (18%) and Standard & Poors (12%). Thomson and Moody’s then follows with 9% each, followed by Fitch, Interactive data, Dow Jones, Factset and Telekurs with 1-4%. Exchanges, et al make up the balance.53 Large firms maintain reference data at an average cost of more than $10 million. (McEachern 2001). On average, 58 full-time-equivalent (FTE) employees are required to maintain reference data, and in 10% of respondents, the figure was more than 200 full-time staff. In the largest of firms, estimates are that 150 applications have separate reference databases. Upwards of 35 separate groups maintain this data, as the sourcing and processing of reference data is most commonly done on an individual product basis.54 Over a quarter of companies surveyed have over 50 staff involved day-to-day in reference data.55 In 64% of global financial institutions 1-10 people are employed in data management, in 7% 100+ are employed.56 One report by Celent estimated the cost of supporting reference data technology, just in one aspect of the process, corporate actions, was projected to reach $830 million over the five year period 2003 – 2007. The report projected that asset managers will spend $225 million - $125 million on third-party solutions and $100 million on in-house development. Custodians are expected to spend $300 million - $60 million on third-party solutions and $240 million on in-house development. Lastly, the report shows that broker/ dealers will spend $304 million - $160 million of that on third-party providers and $144 million on in-house development.57 Aite Group estimated that in 2004 the industry spent $1.1 billion on data management technology projects and expects it to grow by a 15% compounded annual growth rate through 2009 to $2.4 billion.58 Further, some of the largest custodian banks employee over 500 people in corporate action processing alone. 59 That's $50 million in costs at a $100,000 per employee fully loaded cost (salary, benefits, facility space, work station equipment and services per employee).
According to Reuters the enterprise information products group grew by more than 50% in 2003. Further, within Reuter’s enterprise client segment its reference data and pricing group accounted for £24 million of revenues in 2003. Goldman Sachs acknowledged enterprise data as a potential growth business. “The big competitor here is IDC (Interactive Data Corp., parent of FT Interactive Data) with over $300 million of end-ofday pricing revenues, or seven times larger than Reuters.”60 Consulting and outsourcing firm Accenture estimates that large firms can spend as much as $100 million annually on reference data activities.61 At a recent conference the financial industry analyst for information industry researcher Outsell, Inc. estimated that it costs Tier 1 firms between $200 million - $400 million to support and mange reference data and the associated losses resulting from faulty reference data. Others have estimated that $12 billion is spent in this area globally.62 While in the past, the price data included in these industry estimates excluded real time price information we, along with IMD, 27
have concluded that its inclusion is warranted at this time, given the ever increasing nondifferentiated, commoditized nature of such data and its recording amongst vendors as data and information revenue without distinguishing real-time market data from previously defined end-of-day reference prices. 3.4 Reference Data Standards Given the global requirement to allow financial transactions created from disparate systems to meet with one-another in order to match up on critical data elements, the industry is attacking the reference data problem by creating global standards of data transport and content. A leader in standards, the Association of 60+ National Numbering Agencies (“ANNA”) in 2002 authorized Standard & Poor’s and Telekurs to develop and manage the “ANNA Service Bureau.” The Service Bureau is tasked with improving all aspects of the timely, accurate and standardized identification of financial instruments and operates as a central hub to receive and consolidate International Securities Identification Numbers (ISIN’s) from ANNA members and partners. ISIN securities identifiers combine a country code with the local national security identifiers (in the US, it is combined with the CUSIP number) for engaging in cross-border transactions. Another leader in providing solutions has been the Belgium-based industry-led SWIFT organization, which went live with a standard messaging format, ISO (International Standards Organization) 15022, in November 2002. The ISO 15022 system enables financial institutions to construct and send messages about securities and corporate actions in a standardized, automated form and has become the de facto messaging standard for communicating securities and corporate-actions events and entitlements. SWIFT, in conjunction with the ISO’s Working Group 11, is redefining the 15022 standard to incorporate the existing FIX Protocol, the FISD’s MDDL (Market Data Delivery Language) schema (and its recent work incorporating corporate action data into the MDDL schema), into an all encompassing XML (Extensible Markup Language) schema. This standard is known as the 20022 message standard. Even the insurance industry is weighing in, supporting new standards for their variable annuity products which have underlying capital market products associated with them.63 Essential to processing efficiency and inter-operability is an open, standards-based data architecture for each product category to enable translation of content between systems. (Levin, 2004). Here, there is much activity around transport schemas, the main ones are the equity and fixed income FIX and FIXML schemas for defining messages and their content between broker/dealers and investment managers, the ISITC schema for messages between investment managers, broker/dealers and custodians, the FpML schema for derivatives, and the 15022 and 20022 schemas from SWIFT. XML is an evolving, self describing content format for financial transactions. The reference data requirements for equities and fixed income securities and other instruments, such as derivatives, futures, commodities, and options, are also being addressed through incorporation into existing standards and through the establishment of standards within the XML protocol. The embrace of XML by so many trade associations, industry working groups, major financial institutions and global standards organizations suggest that a critical mass can be built, and that both its rate of adoption and its use can be accelerated if a globally centralized body, such as the Group of Thirty, or a group of the world’s leading financial institutions, refocuses its attention here at this critical time. 28
XML is also an Internet based messaging standard that provides for programs written in different languages running on different technology platforms to communicate with each other. Using this language it becomes practicable, for example, for mainframe applications to communicate with web based services. Combined in a unique way with content enabled network routers, the technology is now in place to route reference data between a central core utility and multiple disparate financial enterprises. Reference data thus presented in standard XML format can now be entered into application portfolios through the prevalent middle-ware messaging software (MQ series, Tibco, et al) now common place within all of the largest financial enterprises. Finally, XML is a way of representing data so that its content is discernable within the message or transport layer. Unlike earlier standards that primarily transported data, this standard imbeds the data’s intent, or content, and structure into the message through the use of tags. A typical XML message describing a traded date and its comparison to other descriptive languages is shown in Figure 6. Figure 6 - Schema Representations (September 20, 2001 Trade date) XML Data Transport Example (FIXML): Traditional Data Transport Examples: Unstructured SWIFT 15022 syntax Regular FIX
20010920 20010920 98A::TRAD//20010920 75=20010920
Standards for the content of a financial transaction will lead to sharing of reference data across the enterprise and potentially on an industry-wide basis. The establishment of such standards, ultimately to be referred to the International Standards Organization for adoption, has recently been centralized within two industry wide committee structures, The Reference Data Users Group and ISITC, an ad-hoc assemblage of financial firms, vendors, custodians and others, and the SIIA’s FISD division, a trade association that represents securities firms, exchanges and data vendors. These initiatives were taken after a call from the Group of 30 which, as previously noted, identified the lack of reference data standards as a major impediment to STP and ultimately to a global T+1 settlement process. Their immediate goal is to 1) rationalize the multiple security numbering systems (CUSIP, Sedol, ISIN, et al) through the establishment of the Unique Instrument Identifier (UII), see Figure 7, 2) to establish uniform counterparty and supply chain identifiers, known as the International Business Entity Identifiers (for all businesses that are either regulated or on which due diligence is necessary), and to establish standards for settlement instructions, known as the Standard Settlement Instruction (SSI), see Figure 8, and 3) to confirm a broadened, internationally compatible list of CFI (Classification of Financial Instruments) codes for security types, foreign currencies, etc., see Figure 9.
29
Figure 7 - Unifying Instrument Identification
Same Ticker Symbol/Different Securities NQL is the ticker symbol at the: Toronto Stock Exchange for American Stock Exchange for 2002-6
NQL Energy Services Inc. Class A TIERS Principal-Protected Trust Certificates, Series Nasdaq
Same Ticker Symbol/Different Description DCX is described by: New York Stock Exchange as Merrill Lynch as London stock Exchange as
DaimlerChrysler AG DaimlerChrysler AG ORD SHS DaimlerChrysler AG ORD NPV(REGD)
Same Company Security/ Multiple Listings HSBC Holdings PLC ORD USD .50 Domicile of Listing London London Euronext – Paris Deutche Borse – Frankfurt
Country of Registration Hong Kong UK UK UK
London’s Sedol No. 6158163 0540528 4097279 5722592
Reuters Code 0005.HK HSBA.L HBC.PA HKBL.F
What is driving these global standards initiatives is a heightened recognition of the risks of global interactions amongst financial institutions and a drive to move financial transactions closer to a real time payment vs delivery mechanism, in keeping with the increasingly real time nature of the underlying transactions themselves Its objective is to create a seamless electronic passageway of capital market transactions amongst global financial institutions, that being the straight-through-processing vision. The focus is on removing the settlement risk inherent in waiting, for example three days, in the case of US securities, and overnight in the case of foreign currency transactions, between when a financial instrument or contract is bought or sold and when it is paid for and/or ownership transferred. A final impetus for standardization comes from the ever increasing on-line automated nature of regulatory reporting. Regulators and industry reporting venues are proscribing use of XML format tagging for such reporting. The US’s SEC Edgar data base, a repository of corporate financial information, has mandated electronic filing of these reports in XBRL format. The DTCC has initiated its New Issue Information Data Service (NIIDS) requiring XML tagging. Content standards will like wise be required as those reports requiring, for example, security or client codes will be rejected if they do not match up to the reporting venues master data files.
30
Figure 8 - Counterparty, Organizational Hierarchy, Settlement Venue
Group Holdings Inc.
Group Special Purpose Entity SPE
Group Ltd
Settlement Entity
Group Holdings US
Group Investment Management Co.
Fund 1 Fund Fund12 Fund Fund23 Fund 3
Group Holdings Europe Group Securities Co.
Group Cayman
Legal Entity/Hierarchy
Group Holdings BVI
Group UK Plc
Group FR
Group DE Gmbh
Fund 1 Fund 2
Private Fund UK Partner Fund Commodity Trade I
Prime Broker
LME HKFE
US Equities Foreign Ex Govt. Sec
Options Equities Futures Govt Debt OTC Deriv
NA SP FR BR PO
US UK HK EU JP
Figure 9 - Examples of Classification Codes Equities E
Preferred Shares P: Voting Rights: Voting Rights
Common Shares Common Shares Series Common Shares Class Common Units Capital Shares Installment Receipts
S S L N T I
Convertible C Conv. Pfd W Preference E Conv. Preference V Depositary Pfd Y Trust Preferred J
31
Non-Voting Restricted Vote Enhanced Vote Sub-Voting
V N R E S
Preferred Type Redeemable
R
Exchangeable E Extendable T Redeemable Exch Extd A Redeemable Extd B Redeemable Exch C Exchangeable Extendible L Non Redm Exch Extd N
4.0 Operational Risk & Reference Data Tower Group estimated that 40% of the data elements found in a post execution trade record (for equities and fixed income securities) are obtained from static reference databases.64 Our own analysis for all types of financial transactions, both pre & post trade, and across all product types, both traded on organized exchanges as well as in over-the-counter dealer markets, suggest that it is nearer 70%. See Figure 10 below. Figure 10 - Composite Financial Transaction Information Content Transaction Reference Account Identification Acting in Capacity as Code Buy/Sell Indicator *Security Identifier/Contract/Series/ Currency Pair/Collective Investment *Market/Place of Domicile Identifier No. Shares/Notional Amt/Par Value *Currency code Price/Rate/Factor* Principal Amount Commission Amount *Regulatory Fees/Taxes* Trade Date/Settlement Date* *Expiry/Maturity/Reset Date *Broker/Dealer/Inter-dealer *Floor Agent/Give-up Agent/Trading Desk *Investment Manager/Trading Adviser/Pool/Fund *Custody/Clearing/Settling Agent/Prime Broker *Settlement/Collateral Account *Location of Settlement/Delivery Location *Reference data
Pervasive quality problems with reference data affect the successful outcomes of back office operations intended to streamline trade processing and increase trading efficiency. According to Tower Group, for those firms that have automated trade processing, reference data quality problems cause more than 45% of all trade exceptions.65 A related study sponsored by Reuters, Tower Group and Capco notes that, on average, 30% of trades fail to settle due to erroneous reference data (Lazarus, 2002). A later Tower group survey (Tower Group, 2006) estimated that in 2005 of the 5.1% of trades that fail due to faulty reference data, 37% fail due to inaccurate or incomplete reference data and 20% due to disparities in referential data bases. Challenges facing reference data systems include the lack of automation, data sitting across different silos across the trade life cycle and lack of standards. Each of these is a major cause of trade failures.66 Other discrepancies result from manual entry, redundant storage and inconsistent business rules across an organization. Different departments 32
across an organization often enter the same information separately into various repositories, creating an opportunity for error and discrepancy. In this same survey 79% of respondents agreed that inconsistent, inaccurate and incomplete reference data is the major cause of transaction failures. 33% of those respondents reported using very little automatic or no automatic updates to instrument or client-reference data. (McEachern, 2001) A Tabb/Omgeo survey population responded that fail rates are 2.3% for domestic equity trades, 3.5% for domestic fixed income trades, and 6.4% and 7.2% for foreign equity and fixed income trades, respectively. Electronic trading and industry efficiency initiatives have helped the industry lower these rates. Firms report that their fail positions have improved moderately over the past two years.67 Add to this the repair costs for fixing trade failures and adjustments for risk exposure and it becomes obvious how costly faulty reference data can be to a firm. See Figure 11. The Reference Data User Group (RDUG) reports that, based on SWIFT’s 2002 estimates, the cost to fix a trade at order entry time averages US$6 per exception, and that fixing trades in the later stages of trade settlement costs on average US$50 per incident. REDUG further stated that SWIFT estimated the cost to the global financial industry of the lack of STP was $12 billion in 2002.68 In addition to these costs, incorrect investment decisions based upon erroneous data are equally damaging to the firm’s overall reputation and client trustworthiness.69 The risk to firms’ front offices from sub-optimal trading decisions due to faulty corporate actions is estimated to be €1.6 billion – €8 billion per year globally. Available data on the European fund management industry indicates that firms in Europe incur total actual costs in the region of €65m – €140m per year from losses due to faulty reference data. This would imply an annual loss of €300m – €700m to the fund management industry worldwide.70 Reference data is becoming an important factor in financial institutions’ operational strategies.71 Reference data has been identified by the Securities Industry Association as one of the 10 building blocks important for the move toward compliance and operational effectiveness. As the importance of reference data, both in its maintenance and automation becomes more apparent, firms will need to find new ways to improve the handling of reference data. (McEachern, 2001) Figure 4 - Quantifying Transaction Risk At risk in the US securities markets over three days of settlement, as reported by DTC in 1999, is $375 billion, approximately $125 billion each day in settlement value. Reduction from the current T+3 to T+1 would reduce the settlement value at risk by $250 billion. A further reduction of $250 billion at risk was projected in 2004 based upon a 33% growth rate to a total of $750 billion of settlement value at risk in a T+3 environment.72 However, as the SIA points out the reduction of risk in moving from T+3 to T+1 is not linear and is best calculated on a Value-at-Risk approach yielding an approximate 42% reduction, not the linear 67% (2/3) reduction.73 In 2004, DTCC reported that it actually cleared and settled a daily average of $4.5 trillion in securities value. 74 About 5% of trades fail or are “dropped” at the end of the day, 20,000 from the NSCC’s Continuous Net Settlement (CNS) system and 15,000 from non-CNS deliveries for a total of about 35,000 for a typical day’s (2001) 700,000 trades. This doesn’t include “fails to deliver” that aren’t even introduced into the system, which would make the fail rate higher. Fails create significant risks for the industry. When a fail occurs, the delivering institution is short of funds (although a firm can lend the securities it has and replenish them in normal market circumstances). Both the deliverer and the receiver have security positions that are not what was expected. Although a fail does not create a credit, counterparty or principal risk, it does create a liquidity risk for the deliverer and institutional trades that fail create position risk for both deliverer and receiver. Most fails occur because positions are not available; that is, the deliverer does not have free inventory. Stock lending can, of course, overcome this, as long as the lent stock is available quickly enough. When, as is usually the case, the lender receives sufficient cash collateral from the borrower, the credit risks associated with stock lending are small compared with the benefit of eliminating settlement fails.
33
Figure 11 - Quantifying Transaction Risk (continued) Reclaims are also a risk, similar to failed transactions. Today, there are about 10,000 reclaims with a value of $7 billion to $10 billion on an average day, of which about $5 billion to $6 billion is for money market instrument deliveries and the balance is mostly for primary deliveries of securities loans and returns, and deliver orders. Nearly 90% of these originate through delivery versus payment transactions. However, while the dollar values of reclaims are not that large about $300 billion of securities are reclaimable. Of the total value of settlements at DTCC, about $750 billion on a typical day, about 40% could be reclaimed, and about 1% actually are. Reclaims eliminate the risk to a receiver of taking delivery of a security that it does not want. However, this is a risk the receiver could eliminate beforehand by authorizing the trade, actively or passively. And, in the course of a reclaim, risks are created for the deliverer and the system as a whole. For a deliverer, the risks created by the possibility of a reclaim are similar to the risks created by a fail — liquidity and position risks. There is no position risk for CNS participants when a trade fails because NSCC extends to them all of the legal rights and privileges they would have had with completion, even when their account at DTC is not credited. The total number of reclaims is about twice this, with the remaining 10,000 or so being due to payment orders – the movement of cash without any corresponding delivery of securities across DTCC’s books. These reclaims are unimportant for inventory management – there is no inventory movement associated with them – but they are very important potentially for risk management, because many of them are associated with making margin payments. Therefore, they add to the overall risks of settlement; on any given settlement day there is the risk that any of the trades due to settle that day may fail, as well as the risk that any of the reclaim-eligible trades made the previous day may be reclaimed. If a participant failed and a trade it delivered the preceding day was subsequently reclaimed, DTCC might have to buy the securities back from the receiver — because DTCC does guarantee the receiver’s right to reclaim — and then sell them into the market. DTCC would face market risk, which it would offset with any available collateral from the failed participant. Nevertheless, there is residual market risk for the system as a whole. And, once again, because the risk of reclaim refers to trades settled yesterday, this is additional to any risk DTCC might face from settlements due today. The SIA’s Institutional Transaction Processing Committee (ITPC) in 2001 forecast trade confirm volumes in the United States increasing by 25% a year for the next five years from 700,000 in 2001 to over one million deliveries a day at DTCC by 2005. Late-cycle intervention as the primary method of inventory management will become increasingly problematic going forward. If the ITPC volume projections are correct and the rate of exemptions remained the same, the number of late-cycle interventions would rise to about 200,000 a day in 2005. Under T+1, with less time to handle the problems represented by this volume of exemptions in a T+1 environment, it is likely that the costs of managing this substantial number of exception transactions would rise and the number of fails would increase sharply, over and above what would otherwise be expected, if nothing were done to improve inventory management. Reclaims, left unattended, would also likely increase. Again, if they increased in number and volume in line with the ITPC volume forecasts, they would rise from approximately 20,000 items and a total value of $9 billion in 2001 to about 65,000 in 2005 with a value of about $30 billion.75 Also, at risk of failure to settle is a daily average of 41,000 non-affirmed trades (12% of total) and 70,000 awaiting confirmation (20% of total), on a total of 350,000 institutional trades per day. Also, 99% of broker-to-broker trades are locked-in upon execution for equity trades. 76 A global financial enterprise estimated in 1999 that $52 billion of transaction value (daily trading value of $15 billion held for an average of 3.5 days) between trade and settlement date, resulted in a net Value-at-Risk of $6 billion at normal maximum volatility.77 Corporate Actions across the markets are the major source of financial losses attributable to operational failure. 78 DTCC in 2002 processed $1.9 trillion of corporate actions including reorganization, redemption, dividend and interest payments. Industry sources attribute 10% of the annual cost of processing corporate actions to “write-off” funds reserved for losses.79 The Federal Reserve Bank of New York recently began reporting on dealer fails covering transactions in U.S. Treasury securities, agency debt securities, mortgage backed securities, and corporate debt securities. The Federal Reserve reports that dealer delivery fails averaged $3.8 billion per day between mid-1990 and September 5, 2001, but was as much as $190 billion per day after the September 11 attacks and up to $232 billion per day in the summer of 2003. The data show that settlement fails are not unusual. For example, fails to deliver involving Treasury securities occurred in every week between July 4, 1990, and December 29, 2004, and averaged $10.7 billion per day over this period. Fails to receive averaged $12.0 billion per day over this same period. Fails to deliver and fails to receive are highly correlated over time, with a correlation coefficient of 0.997. The Federal Reserve reports that one of the persistent causes of fails amongst dealers is due to miscommunication or operational problems caused by recording incorrect details of the trade.80
5.0 Basel II & Reference Data The Basel Committee on Banking Supervision recognized that beyond the rare occurrences of disasters and improper trading, data processing and transaction work flow errors are the major risk factor for large financial institutions. Basel II’s operational risk regime requires banks to identify business environment and internal control risk factors that can impact the bank’s operational risk profile. The Basel II regime also promotes the 34
development of standard, centralized operational risk databases, assuming consistent definitions and categorizations. (Green, Grody, 2004). Basel II specifically relates transactional reference data maintenance as a key risk driver within the Execution, Delivery & Process Management operational risk Event Type. It can be further observed that throughout this loss event type (see Table 2) reference data can be, and often is a component, if not the sole reason for losses represented in this category.81 To help institutions expand existing risk oversight policies and processes, the Basel Committee has defined risk management principles for electronic banking, some of which directly relate to the issue of reference data in electronic banking activities. The Basel Committee requires assurances that information in-transit or in storage is correct and unaltered and that appropriate measures are in place to protect the data integrity of electronic banking transactions, records and information.82 Banks are further required to ensure the accuracy, completeness and reliability of electronic financial transactions, records and information transmitted over networks, resident on internal databases, and transmitted or stored by third-party service providers.83 Reference data systems will be a significant factor in meeting the operational risk and capital allocation regulatory standards imposed by Basel II.84 In 2004, Accenture, Mercer Oliver Wyman and SAP commissioned FT Research to conduct a research study into how banks are approaching the implementation of Basel II. The study focused on the leading global banks with half of the top 200 interviewed.85 The majority of the banks said they see significant benefits from Basel II, especially in improved capital allocation and better risk-based pricing. In terms of expectations of their operational risk developments, 41% of European banks expect major benefits from reduced operational losses. Banks in regions outside of Europe felt that benefits were more related to capital modeling, data quality, reporting, etc. than their ability to mitigate risks more efficiently.86 There is a significant work/cost effort in building the information technology infrastructure required for upfront data capture, storage, processing, analytics and reporting. Many respondents see this as the largest implementation challenge faced by their Basel II programs. Clearly, the most advanced approaches under Basel, e.g., AMA, will heavily depend on data.87 First, larger volumes of data will be needed; more than most banks currently capture, e.g., historical losses and risk exposures. Moreover, the data needs to be of significantly higher quality, with greater consistency, auditability, and transparency than before.88 These changes demand adoption of a common reference base, sharing and reconciliation of information not only within a bank’s finance and risk management functions, but also within the entire industry. 89 According to the survey, 70% of banks in the US, Canada, Australia and Asia are aiming to centralize data management, acknowledging the challenges of managing all this data. Many banks have realized that independent, departmental and uncoordinated data storage systems are not sustainable in the Basel II era.90 A fully centralized data management approach, via a utility for example, provides several benefits to the participants such as: cost reduction, buying group leverage, incentives to further collaborate on common issues, increased accessibility, etc.91However, a substantial number of banks surveyed remain uncertain over budgets, lack of confidence in risk-management frameworks and economic capital systems, and insufficient progress in implementation of risk measurement tools.92 35
Regulatory capital arbitrage will become possible by reducing levels of risk and receiving corresponding reductions in capital requirements. (Matten 2000). These banks will need to make use of Basel’s Advanced Measurement Approaches to build convincing cases regarding reference data’s unique impact, the effectiveness of improvements to mitigate that impact and eventually receive permission to lower capital reserves. By improving operational efficiency, reducing errors, streamlining processes and increasing transparency, banks will work within the Basel II framework to justify risk and capital reductions. A major contributor to such improvements is the willingness to focus on reference data issues that have long impacted the effectiveness of information technology to significantly reduce errors and risk, and thus reduce general expenses and the amount of capital to be set aside for operational risk. In fact, a recent study by AIM consultancy (AIM, 2006) found that 70% of respondents to its survey felt that Basel II was the strongest driver of data management automation, with Sarbanes–Oxley coming in a distant second at 15%
6.0 Mitigating Operational Risk The focus of Basel II is its attempt to provide capital reduction incentives for those financial enterprises that mitigate their risk. A firm which obtains the ability to provide critical business processes at high levels of performance and protect employees, assets, services and functions, while continuing operations under a wide range of potentially destabilizing situations should be rewarded with lower levels of capital versus others who have not done as well in this regard. (Herrod, 2004) Along this path to lower risk and thus lower capital, it is intended that financial service firms will incorporate early warning detectors such as key risk indicators, loss data collection efforts and performance analytics into their risk mitigation approaches. Also, it is expected that methods supporting operational excellence that include controlled organizational structures, straight-through processing systems, electronic confirmation matching, collateral management systems, and automated exception management processes will be developed.93 Further, financial firms should understand the value chain of data, establish standards and best practices and, when warranted, use outsourcing resources intelligently.94 In this later regard a recent survey by research firm A-team found that 95% of respondents would consider outsourcing aspects of reference data management.95 6.1 Process, Systems and Organizational Improvement With 70% of a financial transaction consisting of reference data, the processing lifecycle of financial transactions relies on the accuracy, consistency, and completeness of such common data. Each transaction involves a combination of reference data and specific value data, each of which varies transaction by transaction. It is rare that reference data, even data about the same instrument, comes from only a single source. Redundant information is the norm. Different applications often use disparate and conflicting views into the data which is collected, consolidated, cleansed, and distributed by the reference data system. The challenge of managing reference data is often broader in scope, more mission-critical in nature, and more susceptible to changing requirements than perhaps any other system deployed in a financial organization.96 Some industry commentators recommend creating an independent staff to maintain reference data across the enterprise. (McEachern, 2001) It is anticipated that forming an independent department to oversee the reference-data function could reduce the costs 36
significantly. Key to this concept is to centralize the administration of the information in an independent department and build the bridges between the centralized administrative role and the applications that require the data. In other words a command and control center for reference data to manage the flow to the applications. (McEachern, 2001) A centralized repository streamlines management of data and leverages its benefit to the distributed organization. However, others believe centralization can lose individuality & flexibility of information. A decentralized repository helps to deal with data quality, corruption, correctness, completeness, exception processes and flexibility by keeping it at the local business unit level where the knowledge of the information content resides.97 Alternatively, data analysts can be deployed at the central repository level in much the same manner as is common when stock research analysts are centralized. Firms are investigating hub and spoke methodologies for combining centralized and decentralized concepts. The key is defining the core purpose and function of the hub to work with the decentralized spokes. Centralized data management strategies are attempting to leverage such investments, not only to provide risk management for their own organization, but as a foundation to new business lines and revenue generators, providing outsourced services to other financial institutions.98 The technology platforms have also undergone rigorous analysis and debate as to the merits of centralization versus distributed storage. At a recent conference on reference data sponsored by the research consultancy Financial Insights, a number of architectures for obtaining, maintaining and distributing reference data were described. Its main point was the separation of the data architecture into two components, the Enterprise & the Application Data Management layers. Within these two layers three storage techniques were proposed (see Figure 12), 1) a centralized data warehouse, 2) a decentralized storage at the source of acquisition but with a centralized abstraction (or metadata) warehouse, and, 3) a decentralized storage at the source of usage, recognizing this is the historical approach with much synchronization issues still to be resolved.99 In a recent A-Team/Reuters study, all respondents with a reference data strategy in place said the strategy was, at a minimum, coordinated at regional levels; not one said that data was managed at the individual department level. 63% of firms have a centralized management structure for reference data throughout the global enterprise. Specifically, 65% of firms surveyed had implemented an internal centralized infrastructure across multiple disparate systems, while 23% had implemented external data integration software across most or some business areas. 9% said they currently had no centralized means of consolidating data from their multiple systems. Duplication of data sourcing was considered an essential in order to ensure data quality, with 77% of respondents giving the reason of ensuring full coverage for duplication, 75% for validation and 60% for backup (which may become increasingly important as the support for front-office functions increases). One manager at a custodian said, “We have a rule of three sources minimum based on our ‘majority rules’ concept: If two out of three prices match or are close, we feel secure with the validity of that price.” 100
37
Figure 12 - Data Architecture & Management Layers
Risk mgt
Data Warehouse
External Source
Financial Reports Internal Source
Compliance
Metadata Warehouse
Metadata Warehouse Enterprise Data Mgt. Layer
Application Data Mgt. Layer (Financial Insights, 2005)
Data management, or enterprise data systems, in general, is being promoted for a variety of purposes. Ease in establishing a new tradable instrument or counterparty, better exception handling, improved data cleansing, and more timely reconciliations, event reporting and workflow management are the primary purpose for many data management systems.101 The foundation to an advanced reference data system, a component of data management systems, is devising a means to aggregate and reconcile reference data to create a clean copy of the data (now commonly referred to as a “golden copy”) and the ability to deliver clean data to the internal business applications and the customer-facing functions that require it. (McEachern 2001) An enterprise reference data management system requires transaction data, valuation information, static data, loss data and operational data to be aggregated from multiple internal and external data sources (Levin, 2004). Part of the solution is defining best practices on cross-referencing sources and tables to ensure accuracy and completeness. Issues such as obtaining correct data, creation of intelligent exception processing programs, identification of errors and exceptions needing further analysis, and continual scrubbing as new sources of data are obtained are important to a successful reference data system. Of particular interest is the accurate associations between issuers; their subordinate corporate entities, affiliates and partnerships; and the corporate securities that each issues. Some firms attempt to minimize the need for cross referencing by in-taking all data from only one source and defining the security master or counterparty master just for data cross referencing.102 One such example of this cross referencing is a service offered in joint partnership between Standard & Poors, Telekurs and Dun & Bradstreet. Known as Security to Entity CrossWalk it cross references every security issue to every business entity assigned in these three firm’s data bases. This results in a global view of security-to-entity and corporate hierarchy relationships across every market region. See Figure 13. 38
Figure 13 – Cross Referencing Hierarchical Relationships
Source: Standard & Poors
6.2 Risk Mitigation & Insurance The Basel Committee has stated that banks may be allowed to reduce their capital allocations for operational risk by as much as 20% through the use of insurance. However, insurance coverage does not guarantee a dollar for dollar reduction in capital requirements. Regulators will determine the impact of insurance on capital requirements using a process of both qualitative and quantitative judgment. Regulators will first consider issues concerning the rating of the insurance provider and the terms of the insurance contract. After this, regulators will take into account the treatment of residual risks such as payment uncertainty, payment delays and counterparty risks, which are inherent in using insurance coverage. (Brandts, 2004) Regulators consider formal requirements such as the legal status of the insurer, rating evaluations and policy terms to first judge the effectiveness of insurance coverage against operational risk. Attention is focused on how well loss events are explicitly mapped to coverage within a policy and whether the documentation and disclosure will satisfactorily cover a loss event occurrence. Regulators will also be concerned with the residual risks that arise from imperfections in the insurance process, being insured against loss does not guarantee that that a full and complete payment will be issued upon a claim. Insurance compensation is subject to a multitude of limitations and exceptions. Payment uncertainty presents the risk of a mismatch in the actual risk exposure to the amount of coverage and the potential for incomplete compensation claims. The insurer may not always compensate the full amount of a loss due to prerequisites or arrangements in the contract. Short pays may also occur from the inability to verify the true loss amount and litigation can get in the way of realizing the complete payment of a filed claim. Evidence has shown that only 80% of claims receive payment. On average, those claims only receive 73% of the loss amount. Payment delay is another residual risk resulting in the potential for additional losses that may require financial enterprises to allocate a larger amount of capital over an uncertain period of time. In the case of very large losses, the verification period may last up to several years negating the protective capital impact of insurance. Finally, 39
counterparty risk exists due to the potential for an insurer to experience liquidity problems, potentially default and ultimately make no payment. (Brandts, 2004) For those firms using an advanced measurement approach simulating actual losses is a more appropriate approach to valuing the risk reduction effect of insurance. This method should consider both the formal considerations and the residual risk considerations. The process consists of mapping loss event types to insurance policies, running Monte Carlo simulations for gross loss history, applying the insurance policies on individual gross losses for each sample, incorporating the impact of residual risk and aggregating the resulting net losses and capital calculation. (Brandts, 2004) In addition to the mappings and the application of insurance policies to loss events, residual risk concerns play a prominent role in the risk reduction valuation. Insurance contracts differ not just on event types covered but on the terms of their coverage conditions, deductibles, maximum caps, aggregate losses over any time period and terms of individual compensation, thus creating gaps between risk exposure and the insurance coverage. (Brandts, 2004) 6.3 Risk Mitigation and Outsourcing Celent in a 2003 survey commissioned by Iverson, reports that nearly 1/3 of surveyed firms would consider outsourcing of reference data activities.103 However, in another study only 3% of respondents said they had outsourced their data management function to a third party. One of the inhibiting factors preventing outsourcing is the risk element. As one respondent said: “Who pays if they get it wrong?” Issues of insurance and service level agreements are essential here.104 A-Team, in a 2005 survey commissioned by Sungard, finds attitudes toward outsourcing significantly changing. 95% of survey respondents reported that they would consider outsourcing reference data activities. In this same survey nearly 90% of respondents described risk as the overwhelming barrier to outsourcing. This naturally brought up the question of liability and indemnity for faulty reference data, with this question posed by a respondent summing up the issue “Someone will be taking care of data provisioning…No one, presumably, would insure against the accuracy of the data…” “What would happen if a security is mis-priced and there’s an investment loss?” While the issue of indemnity was of interest most respondents doubted that this is an issue that could be solved. As one buy-side firm manager said, “This is an important issue, but we realize that any indemnity will be limited.” Said a large sell-side firm’s senior manager, “Guarantees on data quality is an issue…” The head of operations at a global custodian said, “Although it is key, indemnification is a problem for both of us – firm and outsourcer”. 105 To date, sourcing intermediaries, outsourcers and technology vendors have been reluctant to provide such indemnification as it would put at risk their sources of revenue. Conspicuous by its absence in the survey report was that no one reported actually outsourcing reference data nor addressing a common risk mitigating activity such as infrastructure entities jointly owned by industry members (i.e. DTCC, NSCC, CLS, et al), taking on such an indemnification responsibility. On the former point, this has changed significantly as TowerGroup notes in its study (TowerGroup, 2006) wherein it describes 2005 as being the year major financial enterprises, most notably, ING, Wachovia and Citadel, outsourced significant parts of their reference data business. Outsourcers are taking a four stage approach to providing managed data services beginning with an initial focus on data sourcing and maintenance, then work flow 40
management tools, then software for on-site data base maintenance and, finally, downstream distribution to business applications. Solutions, developed for in-house reference data, are being leveraged to provide outsourced services. There are available outsourced solutions for specific niche areas, but there has not been any comprehensive implementation of outsourced reference data management across the varied business silos of multi-product, multi-region, global financial enterprises. However, there are many early stage initiatives, mostly driven by outsourcing companies106 (see Figure 14). Figure 14 - Outsourcers of Reference Data ADP is planning to spinoff its securities processing business into a stand-alone public company. It had previously entered the Utility market by extending its traditional back office processing for securities firms to include clearing. Also it has extended its corporate action processing (acquired Xcitek’s software) to offer an outsourcing service. Its international subsidiary ADP Wilco offers similar services in Europe, and includes an Indian offshore outsourcing facility. ADP’s strategy is defensive in entering the clearing business as it had recently faced the loss of a major processing client to a clearing firm. Its corporate action business is a logical extension of its own internal needs for its back-office service bureau, and the leveraging of its proxy data sourcing and mail distribution facilities. Accenture has established a licensing agreement with Access Control to utilize its core reference database software to offer an outsourced Managed Reference Data Service (MRDS). They have established centers in Canada, London and Singapore to offer these services along with a Global Corporate Actions (GCA) service that they operate for DTCC. Also has established a Managed Market Data Service (MMDS) which licenses Reuter’s market data services and distribution platforms. Accenture is leveraging off of its traditional technology outsourcing services it provides to its financial enterprise clients to build a managed reference-data service that will scale across multiple financial institutions. It has recently announced Wachovia as a client of MRDS. Capco’s Reference Data Services (CRSD) offers a range of services including application service provider (ASP), business process outsourcing (BPO), and business service provider (BSP) capabilities, as well as managed services. CRDS operates an onshore consulting and offshore data cleansing operation in India. Capco recently acquired Iverson, a leading provider of Index product reference data and sold off ORTOS, an Operational Risk suite of software products it acquired from Dresdner bank. Its strategy is to leverage Iversons’ client base into a broader range of reference data services. In this regard it recently announced an outsourcing contract with ING and adapted ING’s core systems for leverage with other clients in further outsourcing arrangements. Depository Trust & Clearing Corporation (DTCC) is addressing certain aspects of the reference data problem. It has developed a real-time, Internet-based software system called the Global Corporate Actions Hub. The hub creates a centralized communications conduit for custodians, broker/dealers and investment managers to receive corporateaction messages and provide instructions on how to respond to the actions, using the ISO 15022 format. Its focus is on the bulk positions that these institutions have with DTCC, leaving the interaction with their customers on corporate action matters to the individual financial institutions. It has also announced a recent re-engineering project which will re-architect their security master file. as part of this effort they have instituted the NIIDS (New Issue Identification Data Service) that requires underwriters to input standardized data elements for new issues. Fidelity Enterprise Data Systems, a wholly owned subsidiary of Fidelity Management and Investment Company, offers a consolidated, scrubbed, normalized data feed of global corporate action data called Fidelity Action Service. IBM recently entered the reference data space by acquiring the operations and software license used by Dresdner Bank to maintain credit risk management reference data. This outsourcing contract was initiated exclusively by IBM Germany. Through this arrangement they acquired a single user license to Asset Control’s software as Dresdner had utilized this vendor’s reference database software and feed handlers. IBM US has been rumored that they too are interested in the risk management and reference data space. IBM already has software “toolkits” for STP and Operational risk applications and plans a wider role in reference data. To this end their Canadian Brokerage Processing Service center has acquired the software of enterprise software company Golden Source, ostensibly to retool their data center but with the vision of attracting further outsourcing clients to the service. Omgeo is a joint venture of the Depository Trust & Clearing Corporation (DTCC) and Thomson Financial. Omgeo processes over one million trades per day and serves over 6,000 investment managers, broker/dealers and custodians in more than 40 countries. It operates as a matching service between the post trade and pre-settlement to eliminate trade-processing steps by allowing parties to the trade to identify and correct unmatched trades earlier for trade corrections. Standard & Poors (S&P) provides global securities identification and cross referencing, pricing, credit ratings, and descriptive and corporate action information. They operate the CUSIP Service Bureau which identifies over 7.5 million active corporate, municipal and government securities issues. Also, along with the Association of National Numbering Agencies (ANNA) and Telekurs Financial they have created the ANNA Service Bureau which acts as a central hub to receive and consolidate ISINs (International Securities Identification Numbers), a certified securities identifier for crossborder transactions consolidated from the 65 ANNA members. The database contains over 2 million ISIN numbers representing over 180 countries. They also offer a service, Security to Entity CrossWalk which links securities from S&P's CUSIP universe to the ISIDPlus joint venture with Telekurs, as well as to the D&B D-U-N-S Number, a unique identifier assigned to every business entity in D&B's database, resulting in view of global issuers, their securities, and entity information from every market region.
41
Figure 14 - Outsourcers of Reference Data (continued) SunGard Reference Point Services has been both centralizing and extending its services to incorporate all forms of reference data. It recently acquired FAME, a long-term provider of time series data and Soliton, a reference data software company. Its strategy is to rationalize the provision of reference data across its multiple investment management, trading, capital markets, custody and risk management applications systems and services. It will provide reference data in service bureau, in-house and ASP models and as a managed service to create a reference data pool that multiple companies can tap. To date they have announced BancAmerica Securities as a client. Swift has announced its intention to create a reference data utility beyond what it manages today, the BIC (Bank Identifier Code) Directory Service which includes National Clearing Codes (NCC), which they are expanding coverage of to some 30 countries. It is currently in consultation with its 8000 members on such expansion. Its interest is to be the global reference source for the proposed International Business Entity Identity (IBEI) codes and data base. Custodians are utilizing their existing infrastructure and connectivity to buy-side clients, their traditional client base, to distribute reference data services. Custodians see the offering of reference data services as a key element in broadening traditional fund administration, portfolio accounting and security and payment receipt and delivery outsourcing offerings. It is thought that the common use of reference data by custodians and their clients would eliminate trade mismatches due to faulty reference data sourced separately. Clearing Houses, Securities Depositories and Exchanges. A final list of vendors includes individual country and regional clearinghouses, depositories and exchanges. As clearing agents and custodians of securities on behalf of their financial institution members, their business models include: Assigning product and member identifying numbers; collecting, normalizing and redistributing corporate action information to members; collecting corporate action data from issuing companies or their agents; originating closing and/or valuation prices and collecting pricing data from external sources in order to value and adjust their holdings; and conveying corporate action information to their members, receiving their responses, and conveying these responses to issuers who trade and/or settle in their markets. In this regard DTCC offers a collection and distribution service for corporate actions, Avox, a provider of counterparty data has recently been acquired by Deutsche Borse, and the NYSE Group owner of the NYSE and soon Euronext has already begun offering enriched market data at premium prices, and as inducements to trade in their markets now that they are a publicly held for-profit company.
7.0 Conclusions Reference data systems are now emerging as a financial application platform concept, distinct from the application logic that supports individual business processes across a financial enterprise. While evolutionary applications development over more than a half century caused reference data to be embedded in business applications, the logic of centralized reference data across many business silos has now become compelling. Whether due to high costs within a single enterprise or duplicative costs across the industry, the expenditure on duplicate reference data, and duplicate business process, is significant and the strategic importance of this duplication questionable at best. Coupled with the nearly complete electronic, integrated nature of our capital markets, financial managers are living day-to-day with the potential systemic risks from faulty reference data and will soon be required to pay up for that risk through provisioning additional capital for operational losses. Attempts within a single firm to extract reference data from the front, middle and back office applications, centralize and consolidate it have traditionally played a back seat to more pressing operational priorities, namely support for new revenue generation activities and the consolidation of operational systems due to merger and acquisition activities. The consequence of the later activity is that major financial institutions are using significant amounts of their data center’s processing power to translate reference data between multiple legacy systems. We believe this is a pervasive problem across all major financial institutions that have gone through a series of mergers and acquisitions, or have adapted to ever changing reference data standards over time, as most large, internationally active financial enterprises have. Being better at transactional reference data management has no strategic value mismatching of transaction details causes transaction failures, regardless of whether one counterparty is right and the other is wrong. This alone is a compelling rationale for 42
establishing industry-wide standards for reference data. While being better at corporate event reference data sourcing and processing ads value by minimizing risk, presently, each organization obtains information from duplicative and redundant sources and performs duplicative processes in interacting with inventory files, issuer’s agents and customers. Therefore, performing the sourcing and processing through one facility would be as comprehensive as using the same sources and processes multiple times at separate facilities, but with the overall cost and risks being significantly reduced. In fact, one component of this process, proxy distribution and shareholder voting, is already centralized and outsourced on an industry-wide basis.107 Reference data is the most highly synergistic component of financial transaction processing. It is similar to already accomplished outsourcing of other synergistic activities (i.e. trade matching (Omgeo), market data distribution (SIAC’s CTA/CQS/OPRA), street side settlement (Federal Wire), and clearing and depository functions (DTCC/NSCC/FICC, et al). Centralizing and consolidating reference data activities, either within a financial enterprise or across multiple clients, remains a major activity to be accomplished within and amongst industry participants. All of the initiatives to centralize, consolidate and outsource reference data are recent. The recognition of reference data as a distinct application subset of the total technology and operations infrastructure of financial enterprises is just coming into focus. Most financial enterprises and the industry’s sourcing intermediaries, outsourcers and technology vendors are looking to support each entity, individually or for their collective client bases, with a centralized solution but still leaving the industry with silos of incomplete and somewhat incompatible reference data. No one has yet approached the solution from an industry-wide perspective although most industry organizations, including ISITC, RDUG, SIA, SIIA’s FISD, SWIFT, ISSA, IOC, the EDM Council and leading regulatory organizations, the SEC, Federal Reserve, BIS, IOSCO (International Organization of Securities Commissioners), et al have proclaimed the problem an industry-wide one. The lack of a clearly delineated business case is thwarting the recognition of the pervasive nature of the issues and the cost and risk associated with reference data. Siloed businesses, associated business interest related trade associations, siloed product specific operational and technology solutions, and business line specific budgets all tend to hamper senior managements’ ability to quantify the overall risk and costs to each financial enterprise. In fact, those who oversee reference and market data in large financial enterprises tend also to be siloed in their views as they sometimes interpret their charter within the narrow business lines or geography drawn around them due to their organizational reporting lines. The lack of granularity in the Basel II survey data does not yet permit quantifying precisely the role faulty reference data plays in the largest loss event categories, that of Execution, Delivery and Process Management, and Clients, Products and Business Practice. Further, the ambiguity in the business line definition of Payments & Settlements and the need to, post facto, re-categorize those losses across multiple business lines as “Other”, which turns out to be the largest business line loss category, likewise, does not lead to clarity on this issue. The lack of a common understanding of reference data has lead to multiple surveys providing multiple answers to what should have been interpreted and responded to similarly. The survey’s themselves, having differing numbers of respondents, from different individuals within responding organizations, with narrow or broader 43
interpretations of reference data, covering different segments of the financial services industry, has resulted, not surprisingly, in inconsistent and incomplete results as reported on throughout this paper. In fairness to all these researchers, they have had to research a moving target as reference data has only recently emerged in its own right as a defined area of the financial services industry exposed, if you will, as the remaining significant area of the global technology and operational infrastructure needing repair. Thus, the resulting available information on industry wide costs and risks associated with the reference data issue provides direction but not specificity. The largest of financial enterprises have endured the most as they are burdened with the highest costs and risks. However, the quantification of this burden is lost in the averages, as most surveys skew the results to the low end by including the smallest, but most populace of financial industry segments, investment mangers. We have attempted to view the business case of high costs and risks of reference data as one to be made by the largest financial enterprises who, collectively, are involved in 70% of the securities movements and settlements in the capital/investment markets. Most industry observers share the observation that the spend rate is large. One typical observation is that market and reference data information costs typically are among the top five highest expenses in a financial services firm – after interest costs, compensation, facilities and technology. Typical of the anecdotal comments are that a large international bank pays more than $300 million, that a major German bank spends more than $250 million on market data-related services and that one of the US’s largest brokerage firms pays more than $150 million for combined market data services for real-time, end-of-day and reference data.108 Below and in Exhibit I (at end of this paper) we have presented our sizing of the business case, based principally on the magnitude of the imbedded costs. Those costs average $740 million for each of the 15 largest US based financial institutions within a range of $238 - $1,242 million. Notwithstanding the magnitude, the fact that these costs are both duplicative and non-strategic, and that the current result creates unnecessary risk to the financial system is in itself a compelling reason to deal with the issue. ANNUAL REFERENCE DATA COSTS PER FIRM Direct Costs People and Facilities Data and Information Software and Systems Losses Fails - DTCC Fails – Federal Reserve Corporate Actions Capital (preliminary)* Internal Operational Risk Capital Costs External Operational Risk Capital Costs Total
($ in millions) $ 50 - $ 200 19 - 704 257 108 25 29 - 103 5-
45 .4 ___________ $ 238 - $ 1,242
.
* Included is a very preliminary calculation for operational risk capital associated with faulty reference data under the Basel guidelines for the 15 US based financial enterprises coming under its mandate. These guidelines will only be finalized in 2008 with significant issues still to be decided.
44
Further, loss data accumulated by the various Basel inspired Loss Event Collection Exercises is still not granular enough, and no real understanding of the pervasive nature of reference data across the key Risk Event Types has yet surfaced within the risk management community supervising their firm’s loss data collection exercise. However, operating management has made the most progress justifying the business case out of necessity as they merge and acquire others and thus, require more organized approaches to integrating disparate systems, technologies and business process (Kentouris, May, 2006). Progress can take them so far, probably to an ultimate central repository and centralized processes within their own organizations, whether outsourced or in-house. This result, however, leaves the duplication of costs for the same result imbedded in each organization. It also leaves them, and the industry, to deal with the reference data risk associated with mismatching of transactions amongst counterparties, the potential for valuing the same collateral and inventory at different prices in different organizations, the potential for risk calculations to be tainted by faulty reference data and the resulting requirement for capital to be reserved for these risks. Joint action across the industry can mitigate much of this exposure. Resolving the problem can be accomplished through an industry-wide effort not dissimilar to the clearing entities, netting systems and central depositories that emerged as industry-wide solutions to past industry-wide problems. Leading this effort could well be the largest of financial enterprises, given to first satisfying their own collective needs as they currently absorb the most cost and risk and, soon to be, the only ones required to set aside operational capital under Basel II. This is not dissimilar to the most recent efforts by a similar grouping of financial enterprises in the development of the newest industry-wide risk mitigating facility, The Continuous Linked Settlement System (CLS), which mitigates foreign currency trade settlement risk. Like CLS, supported first by the largest of financial enterprises, a central market data distribution facility and reference data “matching and clearing” utility could thereafter be expanded to support the reminder of the industry. There are many such infrastructure entities jointly owned by industry members (e.g. DTCC, NSCC, CLS, OCC) or owned by commercial interests (e.g. Euroclear, LCH.Clearnet, The Clearing Corp.), or some combination of the two (e.g. Omgeo, OMX, CTA, CQS, ITS). In summary, the purpose of this paper was to highlight the role of faulty reference data in operational risk, to understand the impact of reference data on the operating costs and capital of financial enterprises, and to shed further light on the impact of enterprise-wide and industry-wide reference data on achieving the goal of straight through processing in the global financial industry. While the business case still needs to be refined we hope we have contributed to placing the resolution of the remaining issues on the agenda of the senior management of financial enterprises and the thought leaders of the industry.
45
Exhibit I Page 1 of 5
Estimating the Cost of Reference Data Management ($ in million) Direct Costs: Reference data costs have three components – 1) people and facilities, 2) sourcing and procurement of information, and 3) licenses/vendor costs for software, systems and communications. People and Facilities
$ 50 - $ 200
Summarizing the surveys and anecdotal evidence, and through our industry discussions, we estimate that the largest of financial enterprises have between 500 - 1000 people involved in these activities, at an annual salary, benefits and facilities cost @ $100,000 - $200,000 costing on average $50-$200 million annually. The wide range of per employee costs is reflective of the locale of these employees, ranging from Metropolitan New York City to outsourcing in India. Data and Information
$ 19 - $ 704
Another $19 - $704, was spent on Data and Information of the $71.5 billion Tower Group estimates was spent in the global securities industry on information technology in 2004. Inside Market Data estimates that vendors and exchanges earned $13.6 billion on Data and Information sold to the industry. Utilizing the total Information & Communications expenditures of the 15 largest US Based Financial Companies Active in Capital/Investment Markets of $16.4 billion (see below), we estimate the average expenditure on Data & Information as ((16.4/71.5) X 13.6)/15 = $208 million, within a range of (3.7/71.5) X 13.6 = $704 million and (.1/71.5) X 13.6 = $19 million 15 Largest US Based Financial Companies Active in Capital/Investment Markets Ranked by Regulatory/Consolidated Capital Information & Communications Expenditures* 2004 ($ in billions) 1. Merrill Lynch $ 1.5 2. Morgan Stanley 1.3 3. Goldman Sachs .5 4. Citigroup 3.6 5. JP Morgan Chase 3.7 6. Bank of America 2.1 7. Lehman Brothers .8 8. Bear Stearns .4 9. Wachovia .6 10. Bank of New York .3 11. PNC Financial .4 12. State Street Bank .5 13. Mellon Financial .5 14. Northern Trust .1 15. Investors Bank & Trust .1 ____ $ 16 .4 * Source: 10K’s – category on Consolidated Income Statement defined as Information & Communications, Communications & Data Processing or Technology & Communications – where these definitions where ambiguous (Bank of New York, PNC Financial, Wachovia, Mellon and Northern Trust) we chose amongst the categories such as software, trading, distribution & services, business development, consulting fees, and equipment to arrive at an estimate of Information and Communications Expenditures. In 2006 Bank of NY announced the acquisition of Mellon Bank and in February, 2007 State Street announced the acquisition of Investors Financial Services Corporation, the parent of Investors Bank & Trust.
46
Exhibit I Page 2 of 5
Software and Systems
$ 2- $ 57
We estimate that the largest financial institutions spend between $ 2 - $ 57 million in this category. These estimates are extrapolated from Aite Groups total spend rate in this area in 2004 of $1.1 billion, with an average cost of ((16.4/71.5) X 1.1)/15 = $17 million, ranging between (3.7/71.5) X 1.1 = $57 and (.1/71.5) X 1.1 = $2 million
Losses: Industry losses due to faulty reference data can be estimated somewhat. For example DTCC estimates that 5% of secondary market trades fail to settle each day. With approximately $4.5 trillion of settlement value in 2004, failed transactions equal $ 225 billion daily X 30% failure rate (Tower Group) attributed to reference data = $67.5 billion X .05/365 interest cost per day X 250 days = total lost interest per day for the industry of $2.31 billion. In order to estimate the per-firm costs we first estimate that the ten largest US based custodian banks have a 70% share of the global custody market (see below).
Market Share of Worldwide Custody Assets* Global Ranking
1 2 3 4 5 8 10 13 16 21
Assets (in billion US dollars)
US Custodian
JPMorgan The Bank of New York State Street Citigroup Mellon Group Northern Trust Investors Bank & Trust Brown Brothers Harriman Wachovia PFPC (PNC Financial) Top 10 US Based: Aggregate:
% of total
10154 9859 9497 6640 3520 2700 1734 1275 996 462
15 15 14 10 5 4 3 2 1 1
46837 67569
70 100
Reference date
Mar 31, 2005 Mar 31, 2005 Dec 31, 2004 Mar 31, 2004 Jun 30, 2005 Jun 30, 2005 Sep 30, 2005 Sep 30, 2005 Dec 31, 2004 Mar 31, 2005
Source: www.globalcustody.net * Note: The following Global Custodians shown beside their rankings, while not overseen by US regulators as their parents are foreign domiciled, nonetheless have substantial involvement in the US capital/investment markets. 7 HSBC 9 UBS 12 RBC 14 Credit Suisse We then estimate that the five securities units of banks and the five largest US based securities firms collectively have a similar share (71.8%) of the global trading markets (see below).
47
Exhibit I Page 3 of 5
NYSE Share Volume Traded – Six Months Ended October 31, 2005 Rank 1 3 4 6 7 11 12 13 15 24
US Based Trading Firm* Goldman Sachs Merrill Lynch Morgan Stanley Lehman Brothers Bear Stearns Citigroup Bank of NY Securities Bank of America Securities JP Morgan Securities Prudential Securities Top 10 US Based:
% of total 8.18 7.84 6.37 4.98 4.86 3.97 3.02 2.45 1.61 .48 43.76**
Source: NYSE Broker Volume Report at www.nysedata.com * The following Trading Firms shown beside their rankings, while not overseen by US regulators as their parents are foreign domiciled, nonetheless have substantial involvement in the US capital/investment markets. 2 UBS - 5 Deutsche Bank - 8 Credit Suisse - 14 RBC - 19 CIBC ** Using Morgan Stanley as a proxy for their peer group and their 10.3% market share of world-wide trading as reported in their 2004 annual report vs the above reported 6.32% share of NYSE volume we estimate that these ten firms collectively account for approximately 70% (10.3/6.32 X 43.76 = 71.3) of all US and cross border trading activity. (Unlike the NYSE, market share data by broker is not available from the large international exchanges including the LSE, TSE, or German Borses, and thus an extrapolation method was used) Similarly the top ten US Government primary securities dealers trade an average low of 72% to a high of nearly 100% of all the value traded by the 22 primary US Government Securities Dealers.
GOVERNMENT SECURITIES DEALER STATISTICS FEDERAL RESERVE BANK OF NEW YORK Jan. 1, 2005 – Sept. 28, 2005 % MARKET SHARE TOP TEN * U.S. GOVERNMENT SECURITIES TREASURY BILLS 71.56 COUPON SECURITIES DUE IN 3 YEARS OR LESS 74.95 DUE IN 3 - 6 YEARS 73.67 DUE IN MORE THAN 6 - 11YEAR 74.01 DUE IN MORE THAN 11 YEARS 77.72 TREASURY INFLATION-INDEX SECURITIES (TIIS) 94.38 FEDERAL AGENCY SECURITIES (Excludes Mortgage backed securities) DISCOUNT NOTES 82.84 COUPON SECURITIES DUE IN LESS THAN 3 YEARS 79.24 DUE IN 3 – 6 YEARS 83.34 DUE IN MORE THAN 6 - 11 YEARS 78.52 DUE IN MORE THAN 11 YEARS 87.31 FEDERAL AGENCY (Mortgage Backed) 85.85 CORPORATE SECURITIES DUE IN LESS THAN 1 YEAR 99.53 DUE IN MORE THAN 1 YEAR 86.55 Source: www.ny.frb.org *Note: The largest US based US banks and securities firms that make up the 22 primary dealers include US based: Bank of America Bear Stearns Citibank Goldman Sachs JP Morgan Chase Lehman Brothers Merrill Lynch Morgan Stanley The largest non US based banks and securities firms with substantial US capital market participation include: ABN AMRO Barclay’s Capital CIBC Credit Suisse Deutsche Bank HSBC UBS
48
Exhibit I Page 4 of 5
Losses on Fails – DTCC
$ 108
We thus use the derived estimate of a 70% market share of the $2.31 billion per day losses due to fails X .70/15 = $108 million for one day of delayed delivery on average for each of the largest 15 financial enterprises. Losses on Fails –Federal Reserve
$ 25
Also, the Federal Reserve reports that dealer fail to deliver covering transactions in primary U.S. Treasury securities, agency debt securities, mortgage-backed securities, and corporate debt securities totaled $10.7 billion daily, equaling $25 million of interest lost for each day of delayed delivery (10.7 X .05/365 X 365 X .70/15). Corporate Action Losses
$17 - $ 39
Further, in an the AIM Global Data Management Survey in 2004, conducted by AIM Software and Vienna University it was estimated that $1.9- $9.6 billion annually is incurred in trading losses that show up as underperformance in funds, or higher basis costs for trades, due to reacting to faulty corporate action data. At an average of 10% of these loses associated with the 15 largest firms, owing to the fact that the vast majority of trading firms are small and numerous, this loss equals ($1.9 – $9.6 million) X.10 /15 = $12 – $64 million. Also direct losses due to faulty corporate action information are estimated at $360 – $840 million for the global fund management industry. As the custodian for 70% of these assets, we estimate that 70% of the losses would be associated with the 15 largest organizations and attribute.70/15 X (a range of $360 to $840 million) to faulty corporate action at a cost of $17 - $39 million per firm.
Capital costs: (preliminary calculation, awaiting Basel final rulings in 2008) Internal Operational Risk Capital Costs
$ 5 - $ 45
We benchmark additional operational risk capital, prior to implementing an Advanced Measurement Approach, against Basel’s target 12% of regulatory capital. Of the largest 15 US based financial institutions active in capital/investment markets (see below) the seven largest have on average $101.2 billion in regulatory capital. This closely approximates Citigroup’s reported 2004 regulatory capital of $100.9 and we therefore use Citigroup’s publicly available regulatory and risk capital numbers as a proxy for the largest of this group. We estimate that this groups operational risk capital to be on average $4.0 billion (12% X total Regulator Capital of $100.9 billion = $10.1 billion – reported Economic Capital of $8.1 billion). Approximately 18% of that capital was allocated to operational risk in 2003 and, extending this approximation to 2004’s operational risk capital (Citigroup did not publish these figures for 2004), an additional $720 million would be allocated for Citigroup’s capital/investment businesses. Combined with already allocated capital of $1.5 billion, the total capital allocated to the capital market/investments businesses of Citigroup and their peer group would be $2.22 billion each. We estimate that approximately 20% of this is related to capital associated with the consequence of faulty reference data (average combined losses for the BIS’s (QIS-2, 2002) and Federal Reserve’s (QIS-4, 2004) Operational Risk Loss Data Collection Exercises for the two Event Types that contain the consequences of faulty reference data average 76.5% of total losses reported [(62.3+90.7)/2] X 30% attributable to faulty reference data for transaction failures = 23%) Percent of Total Losses Reported Event Type QIS 2-2002 QIS 4-2004 Execution, Delivery and Process Management 34.8 9.9 Clients, Products and Business Practices 27.5 80.8 62.3% 90.7%
49
Exhibit I Page 5 of 5
Approximately up to another 20% can be mitigated through insurance, thus combined, approximately .9 billion (40% of the capital of $2.22 billion) on average is attributable to operational risk capital requirements associated with faulty reference data. At a 5% cost of capital, $45 million on average per the largest firms would be incurred to support this additional capital for the top ranked 7. For the smaller group consisting of the bottom ranked 8, using the scale associated with their average capital of $.3 billion and the same estimating technique described previously, each would incur $5 million in additional capital costs. 15 Largest US Based Financial Companies Active in Capital/Investment Markets Ranked by Regulatory/Consolidated Capital ($ in billions) Merrill Lynch $ 130.2 Morgan Stanley 110.8 Goldman Sachs 105.8 Citigroup 100.9 JP Morgan Chase 96.8 Bank of America 92.3 Lehman Brothers 71.4 Bear Stearns 41.6 Wachovia 39.6 Bank of New York 9.0 PNC Financial 8.4 State Street Bank 5.8 Mellon Financial 4.1 Northern Trust 4.0 Investors Bank & Trust .6 Source: Institutional Investor Capital Rankings of Largest Securities Firms, consolidated capital 2005 (as of year end 2004) and 2004 Annual Reports, Tier I + Tier II capital. 207.237.75.252 - 172.23.3.31:964
External Operational Risk Capital Costs
$ .4
Further, the industry in 2004 allocated nearly $10.6 billion in capital funds for supporting the guarantees, open position marks-to-market, and margin and cash collateral deposits required of the various clearing entities run by the DTCC/NSCC/FICC facility. With total daily settlement value of $ 4.5 trillion and total failed value attributable to reference data of $67.5 billion, the total additional cost of these deposits are = $160 million attributable to faulty reference data (10.6 X 67.5/4,500). At a 5% cost of capital the industry is incurring an additional capital cost of $8 million X .70/15 = $.4 million per large firm. Summary: In summary, we estimate the range of costs, losses and capital charges associated with reference data in the range of $238 - $1,242 million for the 15 largest US based financial institutions. (Alternatively, SWIFT had estimated repair rates globally for STP at $12 billion annually X .30 X .70/15 = $168 million on a sample of some 15 SWIFT users globally). Note: Where estimates have been identified as to its source or extrapolated from surveys, all referenced sources and surveys are described in more detail in the accompanying report. We have used a standard 5% cost of capital where broker call rates, market losses, interest costs, stock borrow/loan rates, federal funds rates and repurchase rates have been used in the above calculations, based upon the average of these rates from 1990 – through 2004. Where per firm costs are extrapolated a 70% factor has been used to identify the share associated with the 15 largest US headquartered financial enterprises, then divided by 15 to arrive at a per firm average.
50
References Accenture, Tabb Group, Research Overview: Reference Data Management, May, 2006 Accenture, Data Management – The Quest for Quality, 2006 A-Team Consulting Ltd/Cicada, Securities Administration Data: The Essential Piece of the STP Puzzle, 2002 A-Team Consulting Ltd/Reuters, Reference Data Now: Business Drivers and Approaches to Data Management, November 2004 A-Team Consulting Ltd/Sungard, Outsourcing Survey: Reference Data Management – Who should handle it ?, May 2005 AIM Software, Arnold, K., Vienna University “AIM Global Data Management Survey 2004”, 2004 Allen, Linda and Bali, Turan G., “Cyclicality in Catastrophic and Operational Risk Measurements", Working Paper, February 1, 2005 Allen, Paul. “Basel II: Coming to America” Wall Street Technology. September 2004 Allen, P., Reference Data to Go?, Wall Street & Technology, Jan. 6, 2006 Atkin, Michael, Reference Data and Unique Instrument Identification, presented at the Financial Institution’s Management Conference, February 8, 2005 Atkin, M., Age of Enlightenment in Reference Data, Outsell Inc., Vol. 1, Dec. 2005 Banc of America Securities LLC, Focus Report, Form X-17A-5 for period 1/1/05 – 3/31/05 Beck, U. “Risk Society: Towards a New Modernity.” (Sage, London), 1992 Basle Committee on Banking Supervision, http://www.bis.org Basel Committee on Banking Supervision.. “Risks In Computer and Telecommunication Systems” Available at www.bis.org, July 1989 Basel Committee on Banking Supervision. “Risk Management for Electronic Banking and Electronic Money Activities” Available at www.bis.org, March 1998 Basel Committee on Banking Supervision, Sound Practices for the Management and Supervision of Operational Risk, December 2001 Basel Committee on Banking Supervision, QIS2 - The Quantitative Impact Study for Operational Risk: Overview of Individual Loss Data and Lessons Learned, January 2002 Basel Committee on Banking Supervision, “Quantitative Impact Study 3: Technical Guidance”. Available at www.bis.org, October, 2002 Basel Committee on Banking Supervision. July 2003. “Risk Management Principles for Electronic Banking” Available at www.bis.org. Basel Committee on Banking Supervision. The Joint Forum, “Outsourcing in Financial Services” Available at www.bis.org, August, 2004 Brandts, Silke, “Reducing risk through insurance.” OpRisk., December, 2004 Brown A,, Vats S., Merrill Lynch – Moving to a Data Centric View, 2nd Annual XML for Market Data, FISD, April, 2004 Brown D.J., Wang J.T., Northern Trust, A Discussion of Quantitative Models for Operational Risk: Extremes, Dependence and Aggregation, Conference on Implementing an AMA for Operational Risk, Federal Reserve Bank of Boston, May 19, 2005 Celent, Pamela Brewer, Corporate Actions Automation: Getting Closer to Reality, April, 2003 Celent/Iverson, Market Data Management: A Survey, May 15, 2003 Chavez-Demoulin, V., Embrechts, P.: “Advanced extremal models for operational risk”, Working Paper, 2004 Chernobai, Anna, Menn, Christopher, Rachev, Svetlozar, “A Note on the Estimation of the Frequency and Severity Distribution of Operational Losses”, Applied Probability Trust, 2004 CityIQ, SmartStream, SWIFT, Corporate Action Automation Survey, 2003, May, 2003 Chow J.W., State Street Bank, Implementing an AMA for Operational Risk, Conference on Implementing an AMA for Operational Risk, Federal Reserve Bank of Boston, May 20, 2005 Cummins J.D., Lewis C.M, Wei R., The Market Value Impact of Operational Risk Events: US Banks and Insurers, Federal Reserve Bank of Boston Conference on Implementing AMA for Operational Risk, May 19, 2005 Curtis,K., Filanowski,B., How to Organize Reference Data, Inside Reference Data, July, 2006
51
Crouhy M., Galai D., Mark R., “Risk Management,” McGraw-Hill, 2000. Cruz, M. G. Modeling, Measuring and Hedging Oeprational Risk. Wiley, 2002 Data Management Division of Wall Street, Proposal for an Industry-Wide Glossary, June, 1993 De Fontnouvelle, Patrick, De Jesus-Rueff, Virginia, Jordan, John S. and Rosengren, Eric S., "Using Loss Data to Quantify Operational Risk", Working Paper, April 2003 Di Clemente, Annalisa; Romano, Claudio, “A Copula-Extreme Value Theory Approach for Modelling Operational Risk”, Working Paper, 2004 DTCC, Response to SEC’s Concept Release: Securities Transaction Settlement, June 23, 2004 DTCC, Straight-Through Processing: A New Model for Settlement, January 2002 DTCC, Transforming Corporate Action Processing, June, 2003 Duliba, K. The Performance Test, Risk Magazine, November, 1997 Dumond, William, File # S7-13-04 Concept Release – Securities Transactions Settlement, June 15, 2004 Everett-Wilson, Jim, Mansmann, Robert, Rubbico, Ron, Alfred, Charlie. Foliage White Paper, “Reference Data Systems: Mitigating Business Risk”, 2003 Ebnoether, S., Vanini, P., McNeil, A., Antolinez-Fehr, P. “Modeling Operational Risk”, Working Paper, 2001 Embrechts P., Furrer H. and Kaufmann R.: Quantifying regulatory capital for operational risk. Derivatives Use, Trading and Regulation 9(3), 217-233., 2003 Embrechts, P., Kaufmann, R., Samorodnitsky, G.: Ruin theory revisited: stochastic models for operational risk. In: Risk Management for Central Bank Foreign Reserves (Eds. C. Bernadell et al.) European Central Bank, Frankfurt a.M., 243-261, 2004 Embrechts, P., Kluppelberg, C., and Mikosch, T. Modeling Extreman Events for Insurance and Finance. Springer, Berlin, 1997 FPL, Response to SEC Release Nos. 33-8398; 34-49405; IC-26384; File No, S7-13-04, June 15, 2004 Grimmett G., Stirzaker D., “Probability and Random Processes,” Oxford University Press, 2001. Green, R., Grody, A. Bearing Point White Paper “The Basel New Capital Accord & The Challenge of Operational Risk Management Part I of III: Background, History and Industry Commentary”, 2004 Green, R., Grody, A. Bearing Point White Paper “The Basel New Capital Accord & The Challenge of Operational Risk Management Part II of III: Regulations for Compliance, the Continuum of Approaches and Regulatory Expectations.”, 2004 Green, R., Grody, A. Bearing Point White Paper “The Basel New Capital Accord & The Challenge of Operational Risk Management Part III of III: The Challenges Ahead for Financial Institutions and Recommendations for Implementation.” 2004 Grody A., EDI Systems Trends in the U.S. Retail Industry and its Implications for the Securities Industry, NYU Salomon Center and Center for Research on Information Systems, June 25, 1993 Grody A., Harmantzis F., Kaple, G., Operational Risk and Reference Data: Costs, Capital Requirements and Risk Mitigation, Financial Management Association, June, 2006 - http://www.fma.org/Stockholm/Papers/OpRisknReference_Data_11152005.pdf Group of Thirty, Clearance and Settlement Systems in the World's Securities Markets, 1988 Group of Thirty, Global Clearing and Settlement: A Plan of Action, 2003 Group of Thirty, Global Clearing & Settlement Committee Final Monitoring Report, May, 2006 Harmantzis F. C., “Methodologies for managing and measuring operational risk,” Annual INFORMS Meeting, San Jose, CA, 2002 Harmantzis F.C., “Operational risk management,” ORMS Today, 30(1), 2003 Hammer, Michael, Re-engineering the Financial Services Industry, Enterprise Data Management Council, June 16, 2005 Haubenstock, M. and Mudge, D. “Quantifying Capital for Operational risk” The RMA Journal, pg 76-79, 2002 Hughes, Peter, Using transaction data to measure op risk, Operational Risk magazine, Sept. 1, 2004 IBM, Expanding the Innovation Horizon: Global CEO Study 2006, IBM Business Consulting Services, Mar., 2006. International Association of Financial Engineers (IAFE) seminar, “Reference Data Management: Is Data Management a Critical Issue for Risk Managers?”, November, 2004 Jorian, Philippe, ”Value at Risk: The New Benchmark for Managing Financial Risk”, McGraw-Hill, 2nd edition, August 17, 2000
52
JPMorgan Achieves Milestone With Implementation Of Global Market Reference Data Central Repository To Facilitate STP For Clients, JP Morgan Chase Press Release, July 24, 2002, www.jpmorgan.com Kent R. Lazarus. “Risk management systems: Understanding the need Saving Millions on Data” Traders Magazine. New York: Jul 1, 2002. pg. 1 Kentouris, C., Special Report: Data Management – A Reference Data Subset Is Getting Its Due, Securities Industry News, March 13, 2006 Kentouris, C., Special Report: Data Management - Making the Most of Data: The Experts Speak, Securities Industry News, Dec. 19, 2005 Kentouris, C., Parting Shot From G30: Better Standardization Needed, Securities Industry News, May 29, 2006 Kim, Gene, Untangling the Reference Data Environment, , Financial Insights, May 19, 2004 Kuritzkes, Andrew, “Operational Risk Capital: A Problem of Definition” Journal of Risk Finance, pp 1-10, Fall, 2002 Law A.M., Kelton W.D., “Simulation Modeling and Analysis,” McGraw-Hill, 1999. Lindskog F and McNeil AJ: Common Poisson shock models: Applications to Insurance and Credit Risk Modelling. ASTIN Bulletin, 33(2): 209-238, 2003 Marlin, Steven. “Basel II Approved Last Week” Information Week. July 2004 McEachern, Cristina. “Reference data poses a stumbling block on road to STP” Wall Street & Technology. New York: Dec 2001. Vol.19, Iss. 12; pg. 53, 1 pgs Medova, E. and Kyriacou, M. "Extremes in operational risk management." In Dempster, M.A.H. (ed.): Risk management: value at risk and beyond. Cambridge: Cambridge University Press, pp.247-274, 2002 Morrison, S.D., Rethinking Reference Data Approaches, Oprisk & Compliance, June, 2006 National Securities Clearing Corporation, End of Day Pricing Analysis, NSCC, July, 1993 Nelson, M., The State of Reference Data Management: Results from the 2005 TowerGroup Reference Data Survey, TowerGroup, Feb., 2006 Nelson, M., Measuring the Securities Industry's Progress on Reference Data, 2002-05, TowerGroup, Feb., 2006 Nelson, M., Everything You Wanted to Know About Outsourced Reference Data Solutions but Were Afraid to Ask, TowerGroup, Feb., 2006 Omgeo, Response to SEC Release File No. S7-13-04, June 4, 2004 Operational Risk Magazine, Tough challenges ahead, says Citi head, June 2005 Oxera/DTCC, Corporate Action Processing: What Are the Risks? May, 2004 Palley, J, Hope for Hybrids in Data Management, Wall Street & Technology, June 21, 2005 Petrou, K.S, Financial Guardian Group, “Operational Risk and Risk based Capital: A Problem and Its Wrong Solution.” The Wharton Financial Institutions Center, Risk Roundtable 2002, April 19, 2002 S. Ramamurthy, H.Arora , A.Ghosh, Applying op risk and probablistic networks to corporate actions processing, Operational Risk Magazine, July, 2005 Redman T.C., Data: A Sea Change Ahead, Wall Street & Technology, September 23, 2005 Reference Data User Group, Industry Reference Data Issues Paper, February 10, 2003 Reference Data Review, Reuters Identifies Enterprise Data Fastest-Growing Segment in 2003, April, 2004 Reference Data Review, Sitting Up and Taking Notice, , April, 2004 RISK, “Rewards on offer from a new discipline” pg53-54, November 1999 RISK, “Playing the name game” pg 38-42, October 1998 Risk Management Association & Key Risk Indicator Library www.KRIex.org Rosengren E., Federal Reserve Bank of Boston, A Regulatory Perspective on Operational risk, World Bank Presentation, May 20, 2004 Sabatini, J. and Haubenstock, M. “Management Reporting of Operational Risk” The RMA Journal, pg 18-21, July/August 2002 Sandman, J., New Standards panel Faces Old Problems, Securities Industry News, May 22, 2006
53
Securities Industry News, Special Report – Straight-Through Processing, May 8, 2006 SIBOS Edition, Reference Data: A Dirty Job But Somebody’s Got to Do it., Inside Market Data, Sept., 2005 Sanyal, Aniruddho, A pragmatic approach to modeling KRI’s and their impact on OpVaR, Operational Risk Magazine, May, 2005 SAS Survey “Operational Risk Management in the Financial Services Industry”, 2004 Schmerken, Ivy, Wall Street & Technology, Learning How to Share, November 29, 2004 SEC, “Concept Release: Securities Transaction Settlement”, March 11, 2004 Securities and Exchange Commission. Final Rule: Supervised Investment Bank Holding Companies (Corrected Version). 17 CFR Parts 200 and 240. [Release No. 34-49831; File No. S7-22-03]. RIN 3235-AI97. August 2004 Securities Operation Forum and Financial InterGroup Presents The First Cross-Industry Standards Conference, Financial InterGroup, Sept., 1995 SIA – Final T+1 Report, August, 2000 SIA, Response to SEC’s Concept Release: Securities Transaction Settlement, June 16, 2004 Silke N. Brandts, “Operational Risk and Insurance: Quantitative and Qualitative Aspects”, Working Paper, April 30, 2004. Sungard Corporate Statement “The role of technology in achieving Basel II compliance”, 2003 The Tabb Group/Omgeo, Efficient Markets: Measuring and Monitoring Efficiency in Today’s Global Markets, October 2004 Tarry, L. A Clean Sheet: An Interview with the CLS Bank, FX Derivatives and Risk Management Supplement to FOW, May 2006 Taylor, Charles and Davies, Jonathan; “Getting Traction with KRIs: Laying the Groundwork” The RMA Journal, pp. 58-62, November 2003 Tinervin R., Vales J., Business Process Outsourcing: The Coming Wave in Consortia Buying, The Outsourcing Project, 2004 Tower Group – Quality Reference Data, The Key to STP & T+1, 2001 US Federal Reserve, “Advanced Notice of Proposed Rulemaking on Risk-Based Capital Guidelines; Implementation of New Basel Capital Accord” August 2003.
54
1
Endnotes Banking Agencies Announce Revised Plan for Implementation of Basel II Framework , Joint Press Release , Board of Governors of the Federal Reserve System, Federal Deposit Insurance Corporation, Office of the Comptroller of the Currency, Office of Thrift Supervision, September 30, 2005 2 Basel Committee on Banking Supervision, Sound Practices for the Management and Supervision of Operational Risk, December 2001 3 QIS2 - Basel Committee on Banking Supervision, The Quantitative Impact Study for Operational Risk: Overview of Individual Loss Data and Lessons Learned, January 2002 4
IAFE Seminar, “Reference Data Management: Is Data Management a Critical Issue for Risk Managers?”, November, 2004 Management & Operations, The BASIC Approach: Coordinating Group Sets Operational Sights, American Stock Exchange, May 1970 6 In 1975 the SEC adopted rule 15c3-1 to manage operational risks through capital charges applied to such operational items as unprocessed transfers of securities, failed-to-deliver securities and incomplete corporate actions. 7 Development of an Industry-Standard Securities Glossary, The Depository Trust Company, March 24, 1995 8 Symbols represent financial products such as IBM as a common stock, IBMHS as an Aug 2005 Strike 95 option; futures contracts such as IBM1C as a single stock future, PB representing a Frozen Pork Belly contract; etc. 9 Each trading venue sets rules for describing its official close of day price - some set it as the last sale, some average the last set of quotes, some the midpoint of the last bid and offer, some average the last number of trades, etc. Some are set by the exchange, or trading venue, others by associated clearing houses. 10 Group of Thirty, Global Clearing and Settlement: A Plan of Action, 2003 11 SEC “Concept Release: Securities Transaction Settlement”, March 11, 2004 12 DTCC, Response to SEC’s “Concept Release: Securities Transaction Settlement”, June 23, 2004 5
13
FPL, Response to SEC Release Nos. 33-8398; 34-49405; IC-26384; File No, S7-13-04, June 15, 2004
14
Omgeo, Response to SEC Release File No. S7-13-04, June 4, 2004 (William Dumond, File # S7-13-04 Concept Release – Securities Transactions Settlement, June 15, 2004) 16 Data Management Division of Wall Street, Proposal for an Industry-Wide Glossary, June, 1993) 17 NSCC, National Securities Clearing Corporation End of Day Pricing Analysis, July, 1993 18 Michael Hammer, Re-engineering the Financial Services Industry, Enterprise Data Management Council, June 16, 2005 15
19
Reference Data User Group, Industry Reference Data Issues Paper, February 10, 2003 Sibos Issues, Collaboration is a path paved with gold for reference data, Oct. 10, 2006 Page 6. 21 RISK, October 1998 22 QIS2 - Basel Committee on Banking Supervision, The Quantitative Impact Study for Operational Risk: Overview of Individual Loss Data and Lessons Learned, January 2002 23 U.S. Federal Reserve, The Quantitative Impact Study 4 (QIS4) and the Loss Event Collection Exercise, May, 2005 24 QIS5 is to be conducted in the fourth quarter, 2005 with results in the spring, 2006 25 Tough challenges ahead, says Citi head, Operational Risk Magazine, June 2005). 20
26
Securities & Exchange Commission, August 2004 Ibid 28 Citigroup, Annual Report 2004 29 JP Morgan Chase, Annual Report 2004 30 A Regulatory Perspective on Operational Risk, World Bank Presentation, E. Rosengren, Federal Reserve Bank of Boston, May 20, 2004 31 Citigroup Risk capital and capital Allocation presentation March 29, 2003 at www.citigroup.com/citigroup/fin/data/p040329.pdf 32 Presentation by Michael A. Macchiaroli, Associate Director of the Division of Market Regulation, U.S. Securities and Exchange Commission at the Boston Federal Reserve’s conference on Implementing an AMA for Operational Risk, May 20, 2005, 33 Banc of America Securities LLC, Focus Report, Form X-17A-5 for period 1/1/05 – 3/31/05 34 DTCC, Annual Report, 2004 35 Basel Committee on Banking Supervision Working Paper on the Regulatory Treatment of Operational Risk, September 2001 36 www.bis.org 37 The LogNornal is similar to the Normal distribution, but it cannot have negative values (losses) 27
38
QIS4 Loss Data Collection Exercise, Federal Reserve of Boston conference, May, 2005
39
10,000 simulations would calculate a 99.95% confidence level VaR. The 95th percent confidence interval around this percentile is about 7.5% (plus/minus). 40 ANZ, Abbey Citigroup, Deutsche Bank, Dresdner Kleinwort Wasserstein, JP Morgan Chase, KeyCorp, Royal Bank of Canada and State Street EMEA are founding steering committee members of the Key Risk Indicator Library under the oversight of the Risk Management Association 41 Examples are the KRI categories of Transaction & Data Management, and Reference Data Creation & Maintenance and, within these, the specific indicators of: number of transactions; number of confirmations; number of complaints, etc. 42 43
44
Risk Management Association and the Key Risk Indicator Library at www.KRIex.org Aniruddho Sanyal, A pragmatic approach to modeling KRI’s and their impact on OpVaR, Operational Risk Magazine, May, 2005
D.J. Brown, J.T. Wang, Northern Trust, A Discussion of Quantitative Models for Operational Risk: Extremes, Dependence and Aggregation, Conference on Implementing an AMA for Operational Risk, Federal Reserve Bank of Boston, May 19, 2005
45
J.W. Chow, State Street Bank, Implementing an AMA for Operational Risk, Conference on Implementing an AMA for Operational Risk, Federal Reserve Bank of Boston, May 20, 2005 46
“Operational Risk Management in the Financial Services Industry” SAS Survey, 2004 Ibid 48 Ibid 49 Ibid 50 Foliage 2003 51 Foliage 2003 52 A-team/Cicada Study of Reference Data, Securities Administration Data: The Essential Piece Of The STP Puzzle, 2002 53 Inside Market Data Reference, Market Size and Share Analysis, 2006 Edition 54 Reference data – The Key to Quality STP and T+1, Tower Group, 2001 55 Reference Data Now: Business Drivers And Approaches To Data Management, A-Team Consulting Ltd/Reuters, November 2004 56 Reference data – The Key to Quality STP and T+1, Tower Group, 2001 57 Corporate Actions Automation: Getting Closer to Reality, Pamela Brewer, Celent April, 2003 58 Aite Group, Crossing the Data Management Chasm, March, 2006 59 Corporate Action Automation Survey, 2003, SWIFT, CityIQ, SmartStream, May, 2003 60 Reuters Identifies Enterprise Data Fastest-Growing Segment in 2003, Reference Data Review, April, 2004 61 www.Accenture.com 62 Reference Data and Unique Instrument Identification, presented at the Financial Institution’s Management Conference, Michael Atkin, February 8, 2005 63 NAVA, Data Conformity Working Group, Product Identifiers Industry Standard, Feb. 1, 2005 64 Tower Group – Quality Reference Data, The Key to STP & T+1, 2001 65 Foliage 2003 66 Ibid 47
67
Efficient Markets: Measuring and Monitoring Efficiency in Today’s Global Markets , The Tabb Group / Omgeo, October 2004 Reference Data User Group, Industry Reference Data Issues, Feb. 10, 2003 69 Foliage, 2003 68
70
Oxera/DTCC, Corporate Action Processing: What Are the Risks?, May, 2004 AIM Software, 2004
71 72
72 SIA – Final T+1 Report, August, 2000 SIA, Response to SEC’s Concept Release: Securities Transaction Settlement, June 16, 2004 74 DTCC, Annual Report, 2004 75 DTCC, January 2002 Straight-Through Processing: A New Model for Settlement 76 SIA – Final T+1 Report, August, 2000 77 Unpublished Paper – GSTPA, Risk Management System’s Course Term Project, NYU 78 Transforming Corporate Action Processing, DTCC, June, 2003 73
79
Group of Thirty, Global Clearing and Settlement: A Plan of Action, 2003
80
Explaining Settlement Fails, Michael J. Fleming and Kenneth D. Garbade, Federal Reserve Bank of New York, Current Issues in Economics and Finance, Volume 11, Number 9, September 2005 81
The Basel Committee Quantitative Impact Study 3 (QIS3) - Technical Guidance, October 2002, Appendix 6. Further, in Section V, Page 116 it refers to risk mitigation concerns such as in the proper valuation of trading book positions, and in section 591, that all material risks must be captured on a global consolidated basis. Page 118, section 698 describes the Advanced Measurement Approach (AMA) and states that under this approach the risk management system must be implemented with integrity, Section 600 second bullet point 82
Basle Committee on Banking Supervision 2003 Basle Committee on Banking Supervision, 2003 further states that transactions should be conducted in a manner that makes them highly resistant to errors throughout the entire process. Records should be stored, accessed and modified in a similar manner. Adequate change control policies, monitoring and testing procedures should be in place to protect against compromising controls and data reliability. Failing to maintain the data integrity of transactions, records and information is viewed as an explicit exposure to operational risk and financial losses. 83
84 85 86
Foliage, 2003 Accenture, Mercer Oliver Wyman, SAP Survey, 2004
Ibid Ibid 88 Ibid 89 Ibid 90 Ibid 91 Ibid 92 Ibid 93 Sungard Corporate Statement, 2003 94 IAFE Reference Data Seminar, 2004 87
95
A-Team Consulting, Sponsored by Sungard, Outsourcing Survey: Reference Data Management – Who should handle it?, May 2005 Foliage, 2003 97 IAFE Reference Data Seminar 2004 98 AIM Software, 2004 99 Untangling the Reference Data Environment, Gene Kim, Financial Insights, May 19, 2004 100 Reference Data Now: Business Drivers And Approaches To Data Management, November 2004, A-Team Consulting Ltd/Reuters 101 AIM Software, 2004 96
102 103
IAFE Reference Data Seminar, 2004 Celent/Iverson, Market Data Management: A Survey, May 15, 2003
104
Reference Data Now: Business Drivers And Approaches To Data Management, A-Team Consulting Ltd/Reuters, November 2004 A-Team Consulting, Sponsored by Sungard, Outsourcing Survey: Reference Data Management – Who should handle it?, May 2005
105
106 107
Wall Street & Technology, Ivy Schmerken, Learning How to Share, November 29, 2004
Automatic Data Processing (ADP), a for-profit public corporation acts as central source for intermediation between issuers and shareholders who leave securities with brokerage firms in “street name” and, hence, are unknown to the issuer. Each brokerage firm requests the number of packages of material from ADP, which in turn aggregates all requests and forwards to the issuer’s agent. The material is then received, packaged with standard return forms, sent directly to shareholders using one-time-only account mailing lists supplied by each brokerage firm, and returned to ADP for tabulation. 108 Wall Street & Technology , Reducing Market Spend, Alan L. Paris and Bruce O'Donnell, PricewaterhouseCoopers, Sept. 19, 2006