Optical Infrared Flame Detection System with Neural Networks Javid J. Huseynov*ab and Shankar B. Baliga#b a
School of Information and Computer Science, University of California Irvine, Irvine, CA 92697 b General Monitors, Inc., 26776 Simpatica Circle, Lake Forest, CA 92630 ABSTRACT
A model for an infrared (IR) flame detection system using artificial neural networks (ANN) is presented. The joint timefrequency analysis (JTFA) in the form of a Short-Time Fourier Transform (STFT) is used for extracting relevant input features for a set of ANNs. Each ANN is trained using the backpropagation conjugate-gradient (CG) method to distinguish all hydrocarbon flames from a particular type of environmental nuisance and background noise. Signal saturation caused by the increased intensity of IR sources at closer distances is resolved by an adjustable gain control. A classification scheme with trained ANN connection weights was implemented on a digital signal processor for use in an industrial hydrocarbon flame detector. Keywords: artificial neural networks, signal processing, infrared detectors, fire detection
1. INTRODUCTION The study of fires occupies a unique niche in the world of science and engineering because an unwanted fire is considered a failure in the sense that it is not a desirable outcome and is to be avoided.2 Therefore, the early detection of hydrocarbon flames in an industrial facility serves as means of avoiding such failures, and carries the burden of ensuring both the reliability of the detection and the fast response of the system in operation. Infrared (IR) optical sensors are broadly used in industrial hydrocarbon flame detection. Their popularity is dictated by the fixed emission wavelengths of hydrocarbon flames in the IR spectrum, which can be separated from non-flame sources and analyzed in various domains. Classical optical hydrocarbon flame detectors are based on an expert system, where analog signals are collected from the optical sensors, converted into digital format, processed, and an output decision is reported on the presence of flame or lack thereof. Although simple in appearance, the described model of flame detection becomes more complex when dealing with IR data from real industrial environments. In addition to the robust identification of an undesired phenomenon, a flame detection system should also be able to distinguish flames from sources of environmental nuisance and ambient noise. IR signals at flame wavelengths can be easily generated by random motion, modulation of heated surfaces, hot air flow, arc welding, sunlight reflecting off a water surface, and other non-flame related environmental nuisance. To ensure the adherence of a flame detection system to these requirements prior to its deployment, various regulatory compliance standards, such as FM 32603, EN 54-104 and ULC/ORD-C3865 were developed. These standards subject the detection system to a set of reproducible flame and environmental nuisance sources to test and certify its performance upon deployment. Strict flame performance regulations have in the past guided the designs of a variety of expert systems based on a limited set of classical time- and frequency-domain signal processing algorithms. These systems offered simplicity and the definitive reproducibility of performance in standard compliance testing, mostly designed to avoid failures in detection of flames (false negatives). Yet, beyond the regulatory standards, these systems offer very little flexibility in terms of avoiding the identification of nuisance and ambient noise sources as flames (false positives). Particularly, in IR sensor* #
Email:
[email protected]; webpage: http://www.ics.uci.edu/~javid Email:
[email protected]; phone: 949-581-4464
Advanced Signal Processing Algorithms, Architectures, and Implementations XVII, edited by Franklin T. Luk Proc. of SPIE Vol. 6697, 66970L, (2007) · 0277-786X/07/$18 · doi: 10.1117/12.731164
Proc. of SPIE Vol. 6697 66970L-1 Downloaded From: http://proceedings.spiedigitallibrary.org/ on 02/24/2013 Terms of Use: http://spiedl.org/terms
based expert systems, the addition of environmental nuisance (heat, hot surface radiation, sunlight, welding, etc.) in the same IR wavelength and electrical frequency spectrum as hydrocarbon flames makes the rejection of false positives very difficult. Some system designers6-8, 23, 24 attempted to ease the problem with false positives by adding extra sensors at various wavelengths and restricting the system with a set of more elaborate expert rules. However, in the current market, this solution is extremely pricy in terms of both development and unit cost. As opposed to expert systems, adaptive systems are poised to push the performance in both false positive and false negative cases far beyond the scope of regulatory standards at no extra cost. The clear advantage of adaptive detection systems based on fuzzy logic9 or neural networks1, 10-16 is in their reliance on the pattern of the signals rather than on fixed magnitude or phase. For example, an ANN-based detection system can be trained on the data collected from one or more IR sensors observing a variety of false-positive and false-negative cases. Successful training can automatically derive a set of unique input-output correlation rules that would, otherwise, have to be derived by an expert. Hence, the adaptive approach offers a greater classification capability in a much shorter development time. In this paper, we propose a flame detection system based on JTFA20 and multiple ANNs for distinguishing hydrocarbon flames from environmental nuisance and background false positives. The design described here was implemented in the first industrial flame detector using ANN16, which was certified per FM 32603, EN-54104 and ULC/ORD-C3865, and is currently deployed in the field operation. In Section 2, we describe some related work on adaptive fire detection systems. Section 3 presents our signal feature extraction scheme and ANN design, and Section 4 summarizes the experimental results.
2. RELATED WORK Over the last two decades, the application of neural networks for the classification of sources has been a subject of research in fire detection systems. Perhaps, the earliest example was the work by Okayama et al.10 using odor sensors together with a backpropagation neural network to distinguish smoldering fires from environmental noise such as coffee powder and perfume. In subsequent work11, they experimented with inputs from carbon monoxide, temperature and smoke sensors to estimate a probability of fire. Expanding on Okayama’s research, Milke et al.12, 13 applied neural networks to a wider range of sensors and fire test cases, such as those from flammable liquid, paper, cotton, cardboard, etc. Their experiments correctly identified 62% of smoldering fire sources and 87% of nuisance and ambient non-fire sources. Ishii et al.14 used a time-delayed neural network (TDNN) model to distinguish fires from non-fires in a limited number of tests. Relying on historical information, the TDNN records the transient nature of fire and non-fire conditions. In our approach, for extracting the ANN input features, we also look at the signal over a data window of the past 2.5 seconds. However, in our design each data window is processed independently, and no correlations are established between the consecutive data windows for the ANN input. Chen et al.15 proposed using the Fourier Transform-based IR spectroscopy (FT-IR) of gas phase products along with the ANN to distinguish flaming and smoldering fires from environmental nuisance. Their ANN model was formulated using the Linear Vector Quantization (LVQ) approach with a hidden Kohonen layer. Their training model implemented with NeuralWorks software17 produced a 96% success rate in classification and was extensive in analyzing the contribution of various gas types to flaming and smoldering fires. But it wasn’t designed for implementation in a product that must comply with regulatory agency requirements as in our case, i.e. the false negative error rate in our case has to be at 0%. In our previous work1, we presented a model based on a single large-scale backpropagation ANN and non-restricted feature extraction. This design had an average 95% classification success rate using a single network in all test cases. However, while passing the majority of the compliance tests, some issues were observed: 1) The training data from the nuisance sources outside of the flame frequency band was not useful for classification. 2) Feature extraction on a longer data window did not improve classification yet degraded the response time.
Proc. of SPIE Vol. 6697 66970L-2 Downloaded From: http://proceedings.spiedigitallibrary.org/ on 02/24/2013 Terms of Use: http://spiedl.org/terms
3) The scheme using a single large ANN proved to be overly cumbersome in the training process. 4) The placement of sensors at distances less than 40 ft from the fire resulted in a signal saturation. In this work, without changing the training algorithm, we modified the feature extraction and the ANN classification schemes. The feature space is brought closer to the flame flickering frequencies (5 – 15 Hz), and the length of the processing data window is reduced to improve the response time by a factor of two. Instead of a single ANN with a large number of (over 1000) inputs, multiple small ANNs are applied in series, each trained with the data from only two major types of target phenomena, i.e. flame vs. sunlight, flame vs. hot surface without light emission, flame vs. heated surface with light emission, etc. We also introduce an adjustable gain control scheme to resolve the issue of signal saturation.
3. DESIGN The objective of ANN-based classification is to establish numerical representations of input-output relationships without a priori knowledge of system structure. The differentiation of flame sources from non-flame sources requires an elaborate signal-processing scheme for extracting features from the input signal to use in ANN-based classification. 3.1 Feature extraction Typically, signals are analyzed in a time or a frequency domain. Analyzing sensor response in a time domain is complex due to the variance of timed signal patterns relevant to the same environmental phenomenon. For instance, signals produced by the same flame source can vary in amplitude and function depending on distance, angle, presence of obstacles and other non-flame conditions (sunlight, wind, random modulation, bright lights, rain, fog, dust), which may look like a flame to an IR sensor. As opposed to the time domain, the frequency of a flickering flame remains relatively independent of the environmental conditions, so the frequency becomes an important parameter in analyzing signals. At the same time, due to the low-frequency range of a flickering flame, the frequency-only analysis is prone to a lowfrequency noise from non-flame sources, so the time domain information is needed. To avoid the drawbacks of time-only and frequency-only signal processing methods and to track the frequencies of nonstationary time-varying signals, we used JTFA20 via the application of the Short-time Fourier Transform (STFT). The mathematical formulation of STFT is given below:
X l (k ) =
N −1
Σ w(n) x(n + lH )e
− jω k n
,
n=0
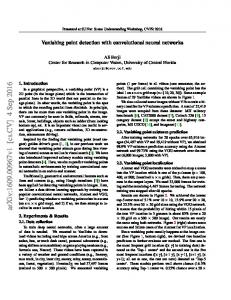
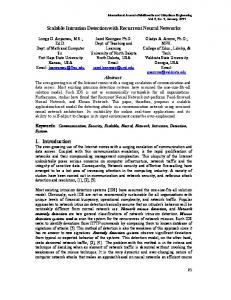
where n is the number of time samples, w(n) is a data window, H is the window shift size, x(n) is the input signal, ω k = 2πf k / f s is the frequency fk of the kth Fourier transform bin, normalized by sampling frequency fs, and l = 0,1,2,… is a discrete frame. In an STFT application, an input signal is cut into slices, followed by the application of the Fast Fourier Transform (FFT)22 to individual slices. The functions obtained by such segmentation are not periodic. This results in higher Fourier coefficients at high frequencies, since FFT interprets jumps between slices as abrupt changes in signal. Such spectral leakage21 is resolved by the application of data windowing, when an input signal buffer is multiplied by a raised cosine wave (Fig. 1). Data windowing gradually attenuates the amplitude of signal at either end of the input buffer, hence reduces the spectral leakage into adjacent slices and forces the input wave to be more periodic. There are several known functions for data windowing such as Hamming, Hanning, Parzen, Gaussian, and others. In our previous work1, we have experimentally identified that the application of the Hamming window results in the best ANN classification. The functional representation of the Hamming window is as follows:
1⎧ ⎛ 2πn ⎞ ⎫ , ⎟⎬ ⎨1.08 − 0.92 cos⎜ 2⎩ ⎝ N − 1 ⎠⎭ where N is the size of the window, and n is the variable index. W Hm (n) =
Proc. of SPIE Vol. 6697 66970L-3 Downloaded From: http://proceedings.spiedigitallibrary.org/ on 02/24/2013 Terms of Use: http://spiedl.org/terms
A
'.1I ' \t ji '
,x(iOw(n)
/
" Vjf
____
'IV/ N
Fig. 1. Application of STFT with data windowing.
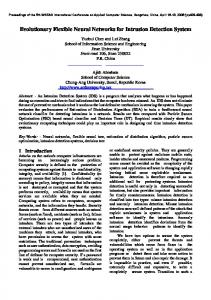
In our application, the length of data window is set to N = 256 samples and the time shift is set at H = 25 samples. At the data sampling rate of 10 ms and the resolution of 0.4 Hz, 50 values, in the index range of 3 to 52, are chosen in the output of a 256-point STFT. These values contain the frequency information in the range of 1.2 Hz to 20.8 Hz. Thus, combined between four sensors, a 200-input ANN feature vector is formed (Fig. 2).
200-INPUTANN INPUT FEAUJREVECTOR
Fig. 2. ANN Input Feature Generation.
As opposed to our previous approach1, where we used a 512-point STFT, this approach reduces the response time of the detection system by a factor of two. Besides this fundamental improvement, the reduction in the size of STFT also facilitates the efficiency of computation in the embedded system thereby allowing us to use more than one ANN in the reduced cycle time. 3.2 Training model The training model used in this design is based on the PCA-CG algorithm by Guterman and Boger18, 19, successfully applied in another application26. The PCA-CG algorithm is based on the conjugate-gradient (CG) descent method for feed-forward networks27 and can train large-scale ANN models as it starts from non-random initial connection weights derived from a training data set. It also uses Principal Component Analysis (PCA) to estimate the number of hidden neurons for training. However, due to processing limitations upon validation in an embedded system, we use a fixed number of 5 hidden neurons. The training algorithm consists of the following steps28:
Proc. of SPIE Vol. 6697 66970L-4 Downloaded From: http://proceedings.spiedigitallibrary.org/ on 02/24/2013 Terms of Use: http://spiedl.org/terms
1) Form joint input-output data vector X = xp ∪ yp, making Np rows of matrix X represent the entire data set. The columns of X are scaled by subtracting the mean of each column from the values in it, and dividing the results by standard deviation of each column.
2) Calculate Σx [a x a] as T
Σx = E{(X - E{X}) (X - E{X}} 3) Determine the eigenvectors and eigenvalues of Σx. Select eigenvectors φ1...φr corresponding to the largest eigenvalues λ1...λr necessary for reconstructing X with a chosen information content ξ:
µi =
λi λ = a i tr( Σ x ) ∑ λ i i =1
Then, assuming that λi and φi are ordered, the number of neurons in the hidden layer, r, would be equal to the number of dimensions necessary to reconstruct the original information with a ζ degree of fidelity, r
∑µ ≥ ξ i
i =1
There are n inputs and m outputs, and a = m+n. 4) Compute the initial input to the hidden weights matrix WH as follows (the last column are the bias values):
⎡ φ 11 ⎢φ 12 WH = ⎢ ⎢..... ⎢φ ⎣ 1r
..... φ n1
h1 ⎤ ..... φ n 2 h 2 ⎥ ⎥ ..... ..... .....⎥ ..... φ nr h r ⎥⎦ a
hi =
∑ φ E{X } T ij
j
j = n +1
5) Compute the initial hidden-to-output weights matrix WO (the last column represents the bias values):
⎡φ(n+1)1 ⎢φ ( n+2)1 Wo = ⎢ ⎢ ..... ⎢φ ⎣ a1
Ubias =
a
..... φ(n+1)r un+1 ⎤ ..... φ(n+2)r un+2 ⎥ ⎥ ..... ..... .....⎥ ..... φar ua ⎥⎦
∑ φ E{X}φ T i
i
= [ u1 , u2 ,...., ua ]T
i = r +1
Proc. of SPIE Vol. 6697 66970L-5 Downloaded From: http://proceedings.spiedigitallibrary.org/ on 02/24/2013 Terms of Use: http://spiedl.org/terms
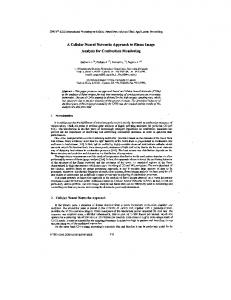
Conjugate-gradient method29 is employed to search for the optimal weights. This algorithm uses non-random initial connection weights, calculated from characteristics of the training data. The number of hidden neurons is kept small, usually between 4 and 7. The causal index, describing the magnitude and sign effect of any output when each input value is changed, is calculated from the trained connection weights for knowledge extraction30. The behavior of the output of hidden neurons can be used for additional error checking and clustering. 3.3 Classification model The ANN classification model implemented in the embedded system consists of 5 hidden neurons and 1 output neuron, indicating either flame or non-flame condition. A unipolar neuron activation (sigmoid) function is used at the output of every neuron. The model of our implementation with multiple feed-forward ANNs is depicted in Fig. 3, and described in detail below.
ANN I
ANN I
ANN N
Fig. 3. The application of multiple ANNs.
Our prior approach1, using a single large-scale ANN, had complicated the training process and the flexibility of the classification. It was impossible to train a single network which would perform well on all the cases involving various false positives differing in physical nature but overlapping in the IR domain with certain hydrocarbon flames. In our experiments, we identified three major types of false positive sources, some of which overlap in features: • • •
Heated surfaces with light emission (arc welding, industrial heaters); Modulated and stationary hot surfaces without light emission (hot plates, hot air flow, hot air gun); Direct, modulated, reflected sunlight and bright light surfaces (incandescent and luminescent lamps, arc welding).
So we have broken down a single large-scale ANN into multiple small sized ANNs, each separately trained to distinguish all flames from only a given set of false positive nuisance sources. During classification, each ANN uses the same set of input features to make a flame vs. non-flame decision. In order for the observed input to be classified as flame, all ANNs must produce a flame likelihood value above certain predefined threshold. The use of multiple specialized ANNs along with the changes to the signal processing scheme and the addition of an automatic gain control, described in the next section, results in a more robust performance.
Proc. of SPIE Vol. 6697 66970L-6 Downloaded From: http://proceedings.spiedigitallibrary.org/ on 02/24/2013 Terms of Use: http://spiedl.org/terms
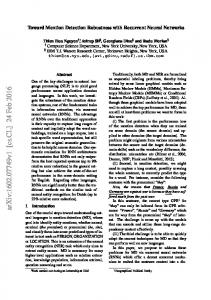
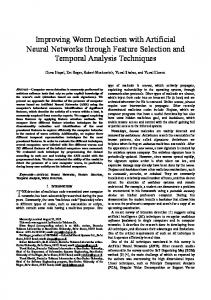
3.4 Gain control An important problem that usually arises in signal processing is the signal saturation21. An excessive intensity of the analog signal from a sensor may yield an analog signal which is cut off (or saturated) at the range limits of the analog-todigital converter (Fig. 4). The saturated signal looks like a square wave, and its FFT does not produce valid spectral information, which ultimately invalidates the input to ANN and the whole scheme. The scaling of the converted signal within the converter’s range is dependent on the electronic gain of the circuit, which is controlled by the embedded software. Hence, to alleviate the signal saturation effects, we have come up with an expert algorithm, which constantly tracks the raw signal amplitude between the limits of VMIN + ∆ and VMAX − ∆ . As soon as the amplitude of the signal falls below or above this range, the system will adjust the electronic gain and rescale the signal back to the range. AMPLITUDE
I
GA!N REOIJCED
VMAX
SIGNAL
NORMALIZEO SIGNAL
lIME
Fig. 4. Signal Saturation and Gain Control.
This improvement to the design enables the detection system to take advantage of the ANN classification upon increased IR radiation at closer distances. For example, an n-heptane flame burning in a 1 square foot pan at 40 feet causes immediate signal saturation at the nominal gain, which made it impossible for the ANN to classify this particular phenomenon under the previous design1. In the new design, because of the gain control mechanism, the signal saturation happens at 10 feet or below with minimal adjusted gain, and the ANNs can effectively distinguish such an intense flame phenomenon from non-flames at or greater than 10 feet.
4. EXPERIMENTAL RESULTS The design described in the previous section has been implemented in the FL4000 flame detector from General Monitors16. The following subsections describe the training implementation, results, and classification performance of the final instrument. 4.1 ANN Training Four independent ANNs have been trained using four data sets with some overlapping data. As in previous work, the data was collected from the IR sensors observing various flame and non-flame nuisance and noise conditions regulated per FM 3260, EN 54-10 and ULC/ORD-C386 requirements. These conditions included n-heptane, propane, butane flames at distances from 0 to 250 feet, direct, reflected and modulated sunlight, arc welding, modulated heater with light source, modulated hot surface with and without a light source, flashlight, incandescent and luminescent light, vibration and other non-flame nuisance. The training program ran in MATLAB 7.1 software on a Windows PC. Each of the four ANNs had inputs of 30,000 samples (30,000 x 200 matrix), out of which 70% were randomly chosen as a training set,
Proc. of SPIE Vol. 6697 66970L-7 Downloaded From: http://proceedings.spiedigitallibrary.org/ on 02/24/2013 Terms of Use: http://spiedl.org/terms
10% for cross validation and 20% for testing. The target was a single column indicating either a flame (1) or a non-flame (0) condition. Table 1: RMS error rates for each ANN in nuisance cases
ANN
(1) Flame vs. Welding
(2) Flame vs. Light
(3) Flame vs. Heat
(4) Flame vs. Hot Surface
3.2%
2.8%
3.9%
1.8%
RMS Error
The structure of the ANN hidden and output layers was the same as in previous design1: 5 hidden neurons and a single output neuron, using a unipolar activation function. The training Root-Mean Square (RMS) error rates in nuisance cases for each ANN are presented above in Table 1. The training algorithm converged in an average of 100 – 150 epochs. Obviously, to meet the standard requirements, the flame detection (false negative) error rate in all cases had to be 0%, which was achieved in the regulatory testing. 4.2 Classification performance The trained ANN model for classification was implemented in the embedded system on a Texas Instruments (TI) F2812 Digital Signal Processor (DSP), using C program with a virtual floating point arithmetic library from TI. Extensive performance tests were conducted on the final instrument to comply with the regulatory standards. The test results show that, in flame response performance, our ANN-based design is equal or superior to some known expertsystems for IR flame detection23, 24. Particularly, our design offers the on-axis range of 230 feet to detect a nominal 1 square foot n-heptane flame with a response time of less than 6 seconds. The highest on-axis range ever offered by an expert system23 for the same source is 210 feet with a response time of over 10 seconds. In addition, our nuisance testing results show advantages of the ANN-based design over expert systems in eliminating false positives (non-flame sources identified as flames). In Table 2, the comparative performance results of rejecting nuisance sources as non-flames are presented for the ANN-based design vis-à-vis the best achievements23, 24 of the expert systems. The table lists the minimum “immunity” distances at which the nuisance source is identified as a false positive. Table 2: Comparative performance in false positive cases for ANN-based vs. expert-system-based design
Nuisance (False Positive) Sources Arc welding @ 190A DC Halogen Lamp (500 W) Fluorescent Lamp (25 W) Incandescent Lamp (60 W) Radiant Heater (1,500 W) Sunlight
Min. Immunity Distance ANN-based Expert (feet) (feet) 15 40 2 8 0 3 1 3 1 3 0 0
Table 3: Comparative performance in false positive cases for the current vs. prior ANN-based design
Nuisance (False Positive) Sources Halogen Lamp (500 W) Fluorescent Lamp (25 W) Incandescent Lamp (60 W) Radiant Heater (1,500 W) Sunlight
Min. Immunity Distance Multiple Single ANN (feet) ANN (feet) 2 10 0 4 1 12 1 10 0 > 0 (fail)
Proc. of SPIE Vol. 6697 66970L-8 Downloaded From: http://proceedings.spiedigitallibrary.org/ on 02/24/2013 Terms of Use: http://spiedl.org/terms
As shown in Table 3, our current multiple-ANN design also shows visible improvements over our previous design with a single large-scale ANN1 in eliminating false positives. The flame response time was improved by two times, while the range remained the same.
5. CONCLUSION A design for an industrial IR flame detection using ANN is presented. JTFA20 using STFT is applied to identify relevant signal frequencies as input features for the ANN. Other, more advanced methods, such as the Discrete Wavelet Transform (DWT)21 can be applied to obtain a better set of input features and subsequently better training and classification. The ANN is trained on a real environmental data using the CG method along with PCA for initializing the connection weights to non-random values. A classification scheme based on 5 hidden and 1 output neurons is implemented on the DSP. The banding of feature frequencies close to the flame flickering range of 1 – 20 Hz removes unnecessary noisy input from the ANN, contributes to faster training and an improved classification success rate. The input reduction also enables using more than one ANN in series for classification, further contributing to lower classification error rates. Additionally, the signal saturation problem is addressed using a gain control mechanism, which improves the quality of collected data for input to ANN at distances closer to the detected phenomenon. The detection system described in this paper has been fully implemented in the industrial IR flame detector by General Monitors16, which was certified per North American FM 32603 and ULC/ORD-C3865, and was tested to meet the European EN 54-104 regulatory standard for industrial flame detection. Presented results show that the flame detector using our ANN-based classification method achieves longer range (up to 230 ft) of flame detection at shorter response times than those currently provided by the expert systems. At the same time, it provides for an exceptional discrimination against non-flame sources of environmental nuisance and electronic noise. Presented improvements over our previous design1 include the two-fold reduction in flame response time and shorter false positive “immunity” ranges.
REFERENCES 1.
J. J. Huseynov, Z. Boger, G. D. Shubinsky, and S. B. Baliga. “Optical Flame Detection Using Large-Scale Artificial Neural Networks”, Proceedings of the IEEE International Joint Conference on Neural Networks (IJCNN’05), 3, 1959-1964 (2005). 2. W. W. Jones. “Development of a Multi-Criteria Algorithm for Fast and Reliable Fire Detection”, Proceedings of the Thirteenth International Conference on Automatic Fire Detection (AUBE’04), 184-195 (2004) 3. Factory Mutual (FM) Global. “Radiant Energy-Sensing Fire Detectors for Automatic Fire Alarm Signaling”, http://www.fmglobal.com 4. European Standard EN 54-10:2002. “Fire Detection and Fire Alarm Systems”, Part 10, European Committee for Standardization, 2002, http://www.cenorm.be 5. Underwriters Laboratories Canada (ULC) Standard ULC/ORD-C386, “Flame Detectors”, http://www.ulc.ca 6. S. B. Baliga, H. Rabe, and B. Bleacher. “Digital Multi-Frequency Flame Detector,” U.S. Patent # 6, 150, 659, (2000). 7. F. Schuler. “Dual Wavelength Fire Detection Method and Apparatus,” U.S. Patent # 5, 850, 182, (1998). 8. E. Goldenberg, T. Olami, J. Arian. “Method For Detecting A Fire Condition”, U.S. Patent # 5, 373, 159, (1994). 9. M. P. Thuillard, “Method for Analyzing the Signals of a Danger Alarm System and Danger Alarm System for Implementing Said Method”, U.S. Patent # 6,011,464, (2000). 10. Y. Okayama. “Approach to Detection of Fire in Their Very Early Stage by Odor Sensors and Neural Net,” Proceedings of Third International Symposium of Fire Safety Science, 955-964, (1991). 11. Y. Okayama. “A Primitive Study of a Fire Detection Method Controlled by Artificial Neural Net”, Fire Safety Journal, 17, 535-553, (1991) 12. J.A. Milke and T.J. McAvoy. “Analysis of Signature Patterns for Discriminating Fire Detection with Multiple Sensors,” Fire Technology, 31 (2), 120-136, (1995).
Proc. of SPIE Vol. 6697 66970L-9 Downloaded From: http://proceedings.spiedigitallibrary.org/ on 02/24/2013 Terms of Use: http://spiedl.org/terms
13. J. A. Milke, “An Application of Neural Networks for Discriminating Fire Detectors”, Proceedings of the International Conference on Automatic Fire Detection (AUBE’95), 213-222 (1995). 14. H. Ishii, T. Ono, Y. Yamauchi and S. Ohtani. “Fire Detection System by Multi-Layered Neural Network with Delay Circuit,” Proceedings of the Fourth International Symposium of Fire Safety Science, 761-772, (1993) 15. Y. Chen, M. A. Serio and S. Sathyamoorthy. “Development of a Fire Detection System Using FT-IR Spectroscopy and Artificial Neural Networks,” Proceedings of the Sixth International Symposium of the International Association for Fire Safety Science, 791-802, (1999). 16. J. J. Huseynov, S. B. Baliga, G. D. Shubinsky, Z. Boger. “Flame Detection System,” U.S. Patent # 7,202,794, (2007). 17. NeuralWorks Professional II/PLUS. NeuralWare Inc., Carnegie, PA, http://www.neuralware.com 18. H. Guterman. “Application of Principal Component Analysis to the design of neural networks,” Neural, Parallel and Scientific Computations, 2, 43-54, (1994). 19. Z. Boger and H. Guterman. “Knowledge extraction from artificial neural networks models,” Proceedings of the IEEE International Conference on Systems Man and Cybernetic (SMC'97), 4, 3030-3035 (1997). 20. T. P. Zielinski. “Joint time-frequency resolution of signal analysis using Gabor transform,” Proceedings of the 16th IEEE Instrumentation and Measurement Technology Conference (IMTC’99), 2, 1183-1188, (1999). 21. D. Swanson. Signal Processing For Intelligent Sensor Systems, Marcel Dekker, Inc., (2000). 22. J. W. Cooley and J. W. Tukey, “An Algorithm for The Machine Calculation of Complex Fourier Series”, Math. Comput., 19, 297 – 301, (1965). 23. X3301 Multi-Spectrum Infrared Flame Detector, Det-tronics Inc., http://www.detronics.com 24. SharpEye 20/20I Triple IR Flame Detector, Spectrex Inc., http://www.spectrex-inc.com 25. Z. Boger. “Artificial Neural Networks Methods for the Identification of the Most Relevant Genes from Gene Expression Array Data,” Proceedings of the IEEE International Joint Conference on Neural Networks (IJCNN’03), 4, 3095-3100, (2003). 26. Z. Boger. “Who is afraid of the BIG bad ANN?” Proceedings of the IEEE International Joint Conference on Neural Networks (IJCNN’02), 3, 2000-2005, (2002). 27. E. M. Johansson, F. U. Dowla, D. M. Goodman. “Backpropagation learning for multi-layer feed-forward neural networks using the conjugate gradient method,” International Journal of Neural Systems, 2(4), 291-301, (1992). 28. Z. B. Alfassi, Z. Boger and R. Yigal. Statistical Treatment of Analytical Data, p. 254, CRC Press, (2005). 29. J. Leonard and M. A. Kramer. “Improvement of the Backpropagation Algorithm for training neural networks”, Computers Chemical Engineering, 14(3), 337-341 (1990). 30. K. Baba, I. Enbutu, and M. Yoda. “Explicit representation of knowledge acquired from plant historical data using neural network,” Proceedings of the International Joint Conference on Neural Networks, 3, 155-160, (1990).
Proc. of SPIE Vol. 6697 66970L-10 Downloaded From: http://proceedings.spiedigitallibrary.org/ on 02/24/2013 Terms of Use: http://spiedl.org/terms