Journal of Financial Markets 1 (1998) 1—50
Optimal control of execution costs Dimitris Bertsimas, Andrew W. Lo* Sloan School of Management, MIT, Cambridge, MA 02142—1347, USA
Abstract We derive dynamic optimal trading strategies that minimize the expected cost of trading a large block of equity over a fixed time horizon. Specifically, given a fixed block SM of shares to be executed within a fixed finite number of periods ¹, and given a price-impact function that yields the execution price of an individual trade as a function of the shares traded and market conditions, we obtain the optimal sequence of trades as a function of market conditions — closed-form expressions in some cases — that minimizes the expected cost of executing SM within ¹ periods. Our analysis is extended to the portfolio case in which price impact across stocks can have an important effect on the total cost of trading a portfolio. ( 1998 Elsevier Science B.V. All rights reserved. JEL classification: G23 Keywords: Market microstructure; Transactions costs; Portfolio management
1. Introduction The tremendous growth in equity trading over the past 20 years, fueled largely by the burgeoning assets of institutional investors such as mutual and pension funds, has created a renewed interest in the measurement and management of
* Corresponding author. Tel.: (617) 253-0920; fax: (781) 863-9695; e-mail:
[email protected]. 1386-4181/98/$19.00 ( 1998 Elsevier Science B.V. All rights reserved PII S 1 3 8 6 - 4 1 8 1 ( 9 7 ) 0 0 0 1 2 - 8
2
D. Bertsimas, A.W. Lo/Journal of Financial Markets 1 (1998) 1—50
trading costs.1 Such costs — often called ‘execution costs’ because they are associated with the execution of investment strategies — include commissions, bid/ask spreads, opportunity costs of waiting, and price impact from trading (see Loeb, 1983 and Wagner, 1993 for further discussion), and they can have a substantial impact on investment performance. For example, Pe´rold (1988) observes that a hypothetical or ‘paper’ portfolio constructed according to the Value Line rankings outperforms the market by almost 20% per year during the period from 1965 to 1986, whereas the actual portfolio — the Value Line Fund — outperformed the market by only 2.5% per year, the difference arising from execution costs.2 This ‘implementation shortfall’ is surprisingly large and underscores the importance of execution-cost control, particularly for institutional investors whose trades often comprise a large fraction of the average daily volume of many stocks. There has also been considerable interest from the regulatory perspective in defining ‘best’ execution, especially in the wake of recent concerns about NASDAQ trading practices, the impact of tick size on trading costs, and the economic consequences of market fragmentation. Indeed, Macey and O’Hara (1996) observe that ‘. . . while the obligation to give customers the benefits of best-execution of orders is one of the most well-established principles of securities law, and despite the fact that the concept of best execution is continually referred to in cases, treatises, law review articles, exchange rules, and administrative proceedings, no clear definition of best execution exists’.
1 There is a large and diverse literature on transactions costs in economics and finance. Niehans (1987) provides an excellent review of the transactions costs literature in economics. The impact of transactions costs on financial decision-making has been considered by Aiyagari and Gertler (1991), Bensaid et al. (1992), Boyle and Vorst (1992), Cohen et al. (1981), Constantinides (1986), Davis and Norman (1991), Dumas and Luciano (1991), Epps (1976), Garman and Ohlson (1981), Grossman and Miller (1988), Grossman and Vila (1992), Heaton and Lucas (1994, 1995), Hodges and Neuberger (1989), Litzenberger and Rolfo (1984), Leland (1985), Magill and Constantinides (1976), Tuckman and Vila (1992), Vayanos (1995), Vayanos and Vila (1995), and many others. Empirical studies of transactions costs in financial markets include Berkowitz et al. (1988), Birinyi (1995), Brennan and Copeland (1988), Chan and Lakonishok (1993, 1995), Demsetz (1968), Hasbrouck and Schwartz (1988), Huang and Stoll (1995), Keim and Madhavan (1995a,b,c), Kraus and Stoll (1972), Schwartz and Whitcomb (1988), Stoll (1989, 1993), Tinic7 (1972), and Turnbull and White (1995). And the more practical aspects of transactions cost management have been explored by Arnott and Wagner (1990), Bodurtha and Quinn (1990), Brinson et al. (1986), Brinson et al. (1991), Collins and Fabozzi (1991), Cuneo and Wagner (1975), Gammill and Pe´rold (1989), Loeb (1983), Pe´rold (1988), Treynor (1981), Wagner and Banks (1992), Wagner and Edwards (1993), and the papers in Sherrerd (1993). 2 See also Bodurtha and Quinn (1990), Brinson et al. (1986), Brinson et al. (1991), Chan and Lakonishok (1993, 1995), Hasbrouck and Schwartz (1988), Keim and Madhavan (1995a,b,c), Loeb (1983), Treynor (1981), and Turnbull and White (1995).
D. Bertsimas, A.W. Lo/Journal of Financial Markets 1 (1998) 1—50
3
In this paper, we provide one clear definition of best execution, based on the minimization of the expected cost of execution using stochastic dynamic programming. While dynamic optimization is certainly not new to financial economics (see, for example, Merton, 1969; Samuelson, 1969), the use of dynamic programming in defining best execution is novel. In particular, our approach explicitly recognizes the fact that trading takes time, and that the very act of trading affects not only current prices but also price dynamics which, in turn, affects future trading costs. Therefore, defining and controlling execution costs are fundamentally dynamic problems, not static ones, a fact recognized implicitly by Pe´rold (1988) and most professional portfolio managers, and developed explicitly here. Indeed, recent studies by Chan and Lakonishok (1995) and Keim and Madhavan (1995a,b,c) show that because the typical institutional investor’s trades are so large, they are almost always broken up into smaller trades executed over the course of several days. Chan and Lakonishok call such sequences ‘packages’, and using a sample of 1.2 million transactions of 37 large investment management firms during the period from July 1986 to December 1988, they show that only 20% of the market value of these packages are completed within a day and that over 53% are spread over four trading days or more (Chan and Lakonishok, 1995, Table 1). For this reason, best execution cannot be defined as a single number or in the context of a single trade — it is a strategy that unfolds over the course of several days and which ought to adapt to changing market conditions. Dynamic optimization provides a compelling economic rationale for trading in packages: properly parceled packages minimize the expected costs of execution over a fixed time horizon. In particular, we propose and solve the following problem in this paper: given a fixed block SM of shares to be executed within a fixed finite number of periods ¹, and given price dynamics that capture price impact, i.e., the execution price of an individual trade as a function of the shares traded and other ‘state’ variables, find the optimal sequence of trades (as a function of the state variables) that will minimize the expected cost of executing SM within ¹ periods.3 Using stochastic dynamic programming, we obtain explicit closed-form expressions for these optimal trading strategies, which we call best-execution strategies, for various specifications of price dynamics. We show that bestexecution strategies can sometimes be expressed as a linear combination of a naive (and not uncommon) strategy — breaking up SM shares evenly into
3 We do not consider the selection of the particular type of trade — limit versus market order — in a dynamic context. For an analysis of this complementary and important issue, see Angel (1994), Bernhardt and Hughson (1994), Harris (1994), Hasbrouck and Harris (1992), Kumar and Seppi (1993), and Lo et al. (1998).
4
D. Bertsimas, A.W. Lo/Journal of Financial Markets 1 (1998) 1—50
a package of ¹ trades each of size SM /¹ — and a correction factor that adjusts each trade size up or down according to additional information, e.g., stock-specific private information, opportunity costs, changing market conditions, etc. In the absence of such information, we derive conditions under which the naive strategy is optimal: an arithmetic random walk for prices with linear price impact (see Section 2.3). We also show by construction that apart from these rather restrictive and empirically implausible conditions, the naive strategy is not optimal in general. We also obtain the expected cost of best execution — the optimal-value function which is given recursively by the Bellman equation — as a by-product of the optimization process, which may serve as a useful benchmark for pricing principal-bid and negotiated-block transactions. The typical broker/dealer engaging in such transactions will not willingly hold large positions for long, and will seek to trade out of these positions as quickly and as cost-effectively as possible, i.e., he will seek best-execution strategies for his holdings. Of course, risk aversion, adverse selection, and inventory and opportunity costs may change the objective function to be minimized, in which case our benchmark may only be a lower bound on the fair market price of a block transaction. Nevertheless, even in these cases the problem of best execution is still a dynamic optimization problem and our approach is still applicable (although closedform expressions for best-execution strategies may not be available). Moreover, we show that our basic approach — described in Sections 2 and 3 — can be extended in several important ways: (1) specifying more general price-impact functions and deriving numerical solutions (Section 4); (2) trading a portfolio of stocks simultaneously (Section 5); and (3) imposing constraints such as no-sales or, in the portfolio case, a maximum dollar amount invested (Section 6). These results comprise a systematic and quantitative approach to defining and controlling execution costs, measuring the liquidity of large-block transactions, and rationalizing within an economic paradigm the kind of informal trading practices that characterize many institutional equity investors.
2. The basic model Consider an investor seeking to acquire a large block of SM shares of some stock over a fixed time interval [0, ¹].4 Since it is well-known that the shortterm demand curves for even the most actively traded equities are not perfectly elastic, a market order at date 0 for the entire block SM is clearly not an optimal
4 For simplicity, we consider buying SM only — selling SM is symmetric and the solution follows directly from our analysis below with only minor changes in notation.
D. Bertsimas, A.W. Lo/Journal of Financial Markets 1 (1998) 1—50
5
trading strategy.5 A more effective strategy would be to break SM into smaller purchases distributed throughout the interval [0, ¹], but how should such purchases be parceled out? The answer depends, of course, on the degree to which a purchase affects the market price, i.e., the ‘price impact’ and the dynamics of future market prices. Given a particular price-impact function, e.g., the ordered probit model of Hausman et al. (1992), and a specification for the price dynamics, e.g., a random walk, a dynamic optimal trading strategy that minimizes the expected total cost of acquiring SM in [0, ¹] may be obtained by stochastic dynamic programming. 2.1. Defining best execution To illustrate this approach, suppose that at time 0 the investor begins his program to acquire SM shares, and this program must be completed by time ¹. With little loss in generality, let time be measured in discrete intervals of unit length. Since the length of a ‘period’ is arbitrary, it can be set to accommodate even the finest trading-decision interval that is of practical relevance. For example, if the decision to acquire SM is made at the start of the day and the acquisition must be completed by the day’s end, setting ¹"13 yields 30 minute intervals from the 9:30 am market open to the 4:00 pm market close. If the acquisition is part of an end-of-quarter portfolio rebalancing, the trading horizon may be extended to three or four days, in which case ¹ increases proportionally.6 Although all of our results are qualitatively independent of both the time horizon and the number of trading periods (with the exception of numerical examples, of course), for concreteness the length of each period should be regarded as some fraction of a single day and related parameters should be calibrated accordingly. Denote by S be the number of shares acquired in period t at price P , where t t t"1, 2,2, ¹. Then the investor’s objective of minimizing execution costs may
5 For theoretical models that provide economic motivation for the existence of price impact, see Allen and Gale (1992), Easley and O’Hara (1987), Foster and Viswanathan (1990), Jarrow (1992), Kyle (1985, 1989), Vayanos (1992), and Vila (1989). For empirical studies of price impact, see Barclay and Warner (1993), Bodurtha and Quinn (1990), Chan and Lakonishok (1993, 1995), Hausman et al. (1992), Holthausen et al. (1987, 1990), Keim and Madhavan (1995b,c), Kraus and Stoll (1972), and Shleifer (1986). 6 If 30 minute intervals are deemed too long for a given trading horizon, either because of volatility or opportunity cost, ¹ can be increased and the parameters of the optimization problem rescaled accordingly. Of course, a more natural way to handle the timing issue is to re-cast this problem in continuous time. However, the analysis becomes considerably more complex and closed-form solutions are difficult to obtain (see, for example, Davis and Norman, 1990; Magill and Constantinides, 1976). Moreover, for empirical applications continuous-time models must be discretized. Therefore, we take a discrete-time approach throughout this paper.
6
D. Bertsimas, A.W. Lo/Journal of Financial Markets 1 (1998) 1—50
be expressed as:
C
D
T Min E + P S t t 1 M N St t/1 subject to the constraint
(2.1)
T + S "SM . (2.2) t t/1 We may also wish to impose a no-sales constraint, i.e., S *0 (after all, it is t difficult to justify selling stocks as part of a buy-program), but for expositional convenience we shall ignore these constraints for now and return to them in Section 6. To complete the statement of the problem, we must specify the ‘law of motion’ for P . This includes two distinct components: the dynamics of P in the absence t t of our trade (the trades of others may be causing prices to fluctuate), and the impact that our trade of S shares has on the execution price P . For simplicity, t t suppose that the former component is given by an arithmetic random walk, and the latter component is simply a linear function of trade size so that a purchase of S shares may be executed at the prevailing price P plus an impact t t~1 premium of hS , h'0.7 Then the law of motion for P may be expressed as: t t P "P #hS #e , h'0, E[e DS , P ]"0 (2.3) t t~1 t t t t t~1 where e is assumed to be a zero-mean independently and identically distributed t (IID) random shock, i.e., white noise. Observe that the two components — price impact and price dynamics — can be separated. A nonlinear price impact function can easily be incorporated into the random walk specification, and non-random-walk dynamics can be combined with a linear price impact function. However, these two components interact in important ways. For example, Eq. (2.3) implies that price impact has a ‘permanent’ effect on the price level because of the random-walk specification of the price dynamics. It is this interaction between price impact and price dynamics that makes execution-cost control a dynamic optimization problem. This interaction also explains the difficulties in developing a clear economic definition of best execution: such a definition requires the specification of price dynamics as well as price impact, and these vary from one stock to another, and may well vary over time (see Bertsimas et al., 1998 for further details).
7 Although we refer to hS as a price-impact function, it is a simple matter to modify it include t other components of execution costs such as commissions, a bid/ask spread, and opportunity cost. However, for expositional convenience we shall refer to hS simply as price impact throughout this t paper.
D. Bertsimas, A.W. Lo/Journal of Financial Markets 1 (1998) 1—50
7
Despite the fact that Eq. (2.3) has some implausible empirical implications — independent price increments, positive probability of negative prices, percentage price impact that decreases with price, permanent price impact, etc. — it provides a concrete illustration of the more general and considerably more complex analysis which we shall present in later sections. Moreover, we shall see in Section 2.3 that Eq. (2.3) is precisely the dynamics necessary to render the naive strategy of dividing SM into ¹ trades each of size SM /¹ the optimal one. The investor’s problem is now well-posed: find the sequence of trades MS N that t minimizes the expected execution costs E [+T P S ], subject to the constraint 0 t/1 t t that +T S "SM , and given a linear price-impact function incorporated into the t/1 t law of motion (2.3) for P . This is a classical optimal control problem which can t be solved by stochastic dynamic programming, and we define the best-execution strategy as its solution. 2.2. The Bellman equation The basic ingredients for any dynamic programming problem are the state of the environment at time t, the control variable, the randomness, the cost function, and the law of motion. In our context, the state at time t"1,2, ¹ consists of the price P realized at the previous period, and ¼ , the number of t~1 t shares that remain to be purchased. The state variables summarize all the information the investor requires in each period t to make his decision regarding the control. The control variable at time t is the number of shares S purchased. t The randomness is characterized by the random variable e . The objective is t given by Eq. (2.1), while the law of motion is given by Eq. (2.3) and an additional state equation which measures the remaining number of shares to be traded: ¼ "¼ !S , ¼ "SM , ¼ "0, (2.4) t t~1 t~1 1 T`1 where the boundary condition ¼ "0 is equivalent to the constraint that T`1 SM must be executed by period ¹. The dynamic programming algorithm is based on the observation that a solution or ‘optimal control’ MS*, S*,2, S*N must also be optimal for the T 1 2 remaining program at every intermediate date t. That is, for every t, 1(t(¹ the sequence MS*, S* ,2, S*N must still be optimal for the remaining program T t t`1 E [+T P S ]. This important property is summarized by the Bellman equation t k/t k k (2.5), which relates the optimal value of the objective function in period t to its optimal value in period t#1: » (P , ¼ )"Min E [P S #» (P , ¼ )]. (2.5) t t~1 t t t t t`1 t t`1 St By starting at the end (time ¹) and applying the Bellman equation (2.5) and the law of motion for P , Eq. (2.3) and ¼ , Eq. (2.4), recursively, the optimal control t t
8
D. Bertsimas, A.W. Lo/Journal of Financial Markets 1 (1998) 1—50
can be derived as functions of the state variables that characterize the information that the investor must have to make his decision in each period. In particular, the optimal-value function » ( ) ), as a function of the two state T variables P and ¼ , is given by T~1 T » (P , ¼ )"Min E [P ¼ ]"(P #h¼ )¼ . (2.6) T T~1 T T T T T~1 T T ST Since this is the last period and ¼ must be set to 0, there is no choice but to T`1 execute the entire remaining order ¼ , hence the optimal trade size S* is simply T T ¼ . Substituting the law of motion (2.3) into P ¼ yields » as a function of T T T T P and ¼ . T~1 T In the next-to-last period ¹!1, the Bellman equation is less trivial: » (P ,¼ )"Min E [P S #» (P , ¼ )] T~1 T~2 T~1 T~1 T~1 T~1 T T~1 T T~1 S "Min E [(P #hS #e )S #» (P #hS T~1 T~2 T~1 T~1 T~1 T T~2 T~1 ST~1 #e ,¼ !S )]. T~1 T~1 T~1
(2.7)
(2.8)
By substituting the right-hand side of Eq. (2.6) into Eq. (2.8), and substituting for ¼ and P using Eqs. (2.3) and (2.4), respectively, the right-hand side of T T~1 Eq. (2.8) may be cast as an explicit function of S which can be minimized by T~1 taking its derivative with respect to S and solving for its zero. This yields: T~1 /2 , S* "¼ T~1 T~1
(2.9)
» (P ,¼ )"¼ (P #3h¼ ), T~1 T~2 T~1 T~1 T~2 4 T~1
(2.10)
where Eq. (2.10) is obtained by substituting S* into Eq. (2.8). T~1 Continuing in this fashion, the optimal trades S* and the optimal-value T~k function » (P , ¼ ) may be obtained recursively as: T~k T~k~1 T~k S* "¼ /(k#1) T~k T~k
(2.11)
A
B
k#2 » (P , ¼ )"¼ P # h¼ , T~k T~k~1 T~k T~k T~k~1 2(k#1) T~k
(2.12)
until we reach the beginning of the program and find S*"¼ /¹ 1 1
(2.13)
A
B
¹#1 » (P , ¼ )"¼ P # h¼ . 1 0 1 1 0 1 2¹
(2.14)
D. Bertsimas, A.W. Lo/Journal of Financial Markets 1 (1998) 1—50
9
2.3. The best-execution strategy Substituting the initial conditional ¼ "SM into Eqs. (2.13) and (2.14) then 1 yields the optimal trade size S* as an explicit function of SM , and the expected 1 best-execution cost » as an explicit function of SM , P , and the price-impact 1 0 parameter h: S*"SM /¹, 1
(2.15)
C
D
A B
T hSM 2 1 » (P , ¼ )"E + P S* "P SM # 1# . 1 0 1 1 t t 0 2 ¹ t/1 By forward substitution using Eqs. (2.15), (2.11) and (2.4), we find that
(2.16)
(2.17) S*"S*"2"S*"SM /¹. T 2 1 The best-execution strategy is simply to divide the total order SM into ¹ equal ‘waves’ and trade them at regular intervals. This remarkably simple trading strategy comes from the fact that the price impact hS does not depend on either the prevailing price P or the size of the t t~1 unexecuted order ¼ , hence the price-impact function is the same in each period t and independent from one period to the next. But since each period’s execution cost P S is a convex (quadratic) function of S , the sum of these single-period t t t execution costs will be minimized at the point where the marginal execution costs are equated across all periods. There is no advantage to shifting trades to one period or another — they all offer the same trade-offs to the objective function — hence the trade sizes should be set equal across all periods. Note that in this case the optimal controls MS*N are all non-negative hence the nont negativity constraints could have been imposed trivially. The optimal-value function at time 1, » (P , ¼ ), gives the expected cost of the 1 0 1 best-execution strategy and we see from Eq. (2.16) that this cost is the sum of two terms: the no-impact cost P SM and the cumulative price impact hSM 2(1#(1/¹))/2. 0 Observe that while the impact term is a decreasing function of ¹ — having more time to acquire SM can never increase the expected cost — the cumulative price impact does not vanish as ¹ increases without bound. This seems counterintuitive since one might expect price impact to become negligible if there is no time limit on completing the purchase. However, observe that our law of motion for P , Eq. (2.3), implies that the price impact hS of an individual trade has t t a permanent effect on P , hence even infinitesimally small trades will have an t impact on next period’s price, and the limiting sum of all these infinitesimal trades multiplied by infinitesimally increased prices is finite and non-zero: hSM 2/2. These results underscore the importance of the law of motion’s specification in determining the total expected cost of executing SM . Of course, Eq. (2.3) is empirically implausible for a number of reasons. However, it serves a useful purpose in demonstrating the basic approach to best execution, as well as in
10
D. Bertsimas, A.W. Lo/Journal of Financial Markets 1 (1998) 1—50
rationalizing the rather common practice of parceling a large trade into smaller pieces of equal size and submitting them at regular intervals over some fixed time span. This naive strategy is indeed optimal if the price-impact function and price dynamics of P are given by Eq. (2.3). t In the next section we present a closed-form solution for the best-execution strategy under a more complex price-impact function, one which depends both on the trade size and a serially-correlated state variable that proxies for information such as proprietary research or market conditions. With information, the best-execution strategy differs in important ways from the naive strategy S*"SM /¹. In particular, the best-execution strategy becomes a nontrivial funct tion of the information variable and can sometimes exhibit counterintuitive trading patterns. 2.4. Linear price impact with information Suppose that the price-impact function is linear in S as in Eq. (2.3), but now t let X denote a serially-correlated state variable which also affects the execution t price P linearly, hence t P "P #hS #cX #e , h'0 (2.18) t t~1 t t t X "oX #g , o3(!1, 1) (2.19) t t~1 t where e and g are independent white noise processes with mean 0 and variances t t p2 and p2, respectively. g e The presence of X in the law of motion for P captures the potential impact of t t changing market conditions or of private information about the security. For example, X might be the return on the S&P 500 index, a common component in t the prices of most equities. Broad market movements affect all securities to some degree, and c measures the sensitivity of this particular security to such market movements. Alternatively, X might represent some private information about the securt ity, and c the importance of that information for P . In particular, X may denote t t the output of an ‘alpha model’ which incorporates stock-specific analysis to yield an excess return not yet impounded into market prices. In either case, the impact of X on the execution price, and the time series t properties of X have important implications for the best-execution strategy. t Having specified the linear price-impact function with information in Eqs. (2.18) and (2.19), the best-execution strategy and optimal-value function can be obtained by dynamic programming as before (see the Appendix), and is given by , S* "d ¼ #d X T~k w, k T~k x, k T~k » (P , X , ¼ )"P ¼ #a ¼2 T~k T~k~1 T~k T~k T~k~1 T~k k T~k #b X ¼ #c X2 #d k k T~k T~k k T~k
(2.20)
(2.21)
D. Bertsimas, A.W. Lo/Journal of Financial Markets 1 (1998) 1—50
11
for k"0, 1,2, ¹!1, where d
1 ob , , d , k~1 w, k k#1 x, k 2a k~1
(2.22)
and
A
B
h 1 a " 1# , k 2 k#1
a "h, 0
hob k~1, b "c# b "c, k 0 2a k~1 o2b2 c "o2c ! k~1, c "0, k k~1 0 4a k~1 d "0. (2.23) d "d #c p2, 0 k k~1 k~1 g Since we assume h'0, a is positive, and c and d are negative for all k'0. The k k k sign of b can vary, but is positive for all k'0 if h, c, and o are all positive. k In contrast to the case of a linear price-impact function with no information, the best-execution strategy (2.20) varies over time as a linear function of the remaining shares ¼ and the information variable X . In particular, the T~k T~k first term of Eq. (2.20) is simply the naive strategy of dividing the remaining shares ¼ at time ¹!k evenly over the remaining k#1 periods. T~k The second term of Eq. (2.20) is an adjustment that arises from the presence of serially correlated information X . Observe that this term vanishes if o"0. T~k When o"0 this implies that X is unforecastable, and while X still has an T~k T~k impact on the current execution price, observing X tells us nothing about T~k expected future execution prices hence it can no longer affect the best-execution strategy. If o'0 and we assume, without loss of generality, that c'0, then d in x,k Eq. (2.20) is also positive, implying that positive realizations of X increases T~k the number of shares purchased at ¹!k, ceteris paribus. This may seem counterintuitive at first because a positive X necessarily increases the execuT~k tion price P by cX , so why trade more? T~k T~k The answer may be found in the fact that X is positively serially correT~k lated, hence X '0 implies that future realizations are likely to be positive T~k which, in turn, implies additional expected increases in future execution prices.8 Therefore, although a positive X makes it more costly to purchase shares in T~k
8 In particular, a one-unit increase in X implies an expected increase in P of co, an T~k T~k`1 expected increase in P of co2, and so on. T~k`2
12
D. Bertsimas, A.W. Lo/Journal of Financial Markets 1 (1998) 1—50
period ¹!k, this additional cost is more than offset by the sequence of expected future price increases that arise from positively serially-correlated information. Alternatively, if o(0 so that X exhibits reversals, Eq. (2.20) shows that T~k a positive realization of X decreases the number of shares purchased, ceteris T~k paribus: it is more expensive to trade in period ¹!k and X is likely to T~k reverse next period making it less expensive to trade then, hence it is optimal to trade less now. The impact of an increase in X on expected best-execution costs may be T~k measured explicitly by the derivative of the optimal-value function » with T~k respect to X : T~k L» /LX "b ¼ #2c X . T~k T~k k T~k k T~k
(2.24)
Suppose c and o are positive so that b is positive. Since c is always negative, the k k impact of an increase in X on the expected best-execution cost depends on T~k whether b ¼ outweighs 2c X . For empirically plausible parameter values, k T k T~k the first term will generally dominate the second, hence increases in X will T~k typically increase the expected best-execution cost, a sensible implication given that an increase in X increases current and all future expected prices. T~k It is also not surprising that » is an increasing function of ¼ for T~k T~k empirically plausible parameter values — the larger is the unexecuted portion of the initial block, the higher the expected best-execution cost. In the next section, we provide a numerical example to illustrate the behavior of the best-execution strategy under several simulated scenarios. 2.5. A numerical example Tables 1—3 provide illustrative numerical examples of the best-execution strategies under the linear price-impact function with information (2.18)—(2.19) for three simulated realizations of the information variable X and pricing t shocks e . The goal is to minimize the expected execution costs of a 100,000t share purchase over ¹"20 periods for a stock currently trading at P "$50, 0 given the following parameter values: h"5]10~5, c"5.0, o"0.50, p2"(0.125)2, p2"0.001. g e To develop some intuition for these parameters, observe that the no-impact cost of acquiring SM is 100,000]P "$5M, and the expected full-impact cost is 0 100,000]E[P #hSM #cX #e ]"100,000]$55"$5.5 million 0 1 1 since E[X ]"0 from Eq. (2.19), hence h is calibrated to yield an impact t of $500,000 on a 100,000-share block purchase. From Eq. (2.19) it also
13
D. Bertsimas, A.W. Lo/Journal of Financial Markets 1 (1998) 1—50
Table 1 Best-execution strategies for acquiring a 100,000-share block of stock within 20 periods, for a simulated realization of the information variable MX N and price shock Me N, assuming an initial t t price P "$50 and linear price-impact function hS #cX , where P "P #hS #cX #e and 0 t t t t~1 t t t h"5]10~5, c"5.0, X "oX #g , X "0, p2"0.001, p2"(0.125)2, and o"0.50. Note: The t 5~1 t 0 g e non-negativity restriction was not imposed and was not binding in this realization. Performance summary Metric
Naive strategy ($1000s)
Optimal strategy ($1000s)
Improvement (cents/share)
Expected cost Actual cost
5255.2 5314.9
5251.4 5296.6
3.7899 18.2906
Period
P t
S* t
d ¼ w,T~t t
d X x,T~t t
cX t
» /$1000 t
Cost-to-go
1 2 3 4 5 6 7 8 9 10 11 12 13 14 15 16 17 18 19 20
49.994 50.187 50.666 50.572 50.783 51.091 51.673 52.169 52.923 53.547 54.213 54.414 54.935 55.086 55.615 56.095 56.132 56.402 56.475 56.722
4307 5470 6383 2114 5680 6250 8527 8423 8230 8227 6916 3182 6578 3040 4743 4305 1465 2621 1617 1920
5000 5036 5012 4932 5108 5070 4985 4713 4404 4056 3639 3275 3286 2816 2779 2386 1906 2053 1768 1920
!693 434 1371 !2817 572 1180 3542 3710 3827 4171 3278 !92 3292 224 1965 1919 !441 569 !152 0
!0.04 0.02 0.08 !0.16 0.03 0.07 0.21 0.22 0.23 0.25 0.20 !0.01 0.22 0.02 0.15 0.16 !0.04 0.07 !0.03 !0.02
5251.4 5026.0 4752.7 4405.4 4312.7 4023.2 3720.6 3289.4 2852.6 2434.1 1996.7 1620.6 1458.9 1093.9 930.0 670.3 428.8 347.5 199.8 108.9
5296.6 5081.3 4806.7 4483.3 4376.4 4087.9 3768.7 3328.0 2888.6 2453.0 2012.5 1637.5 1464.4 1103.0 935.6 671.8 430.3 348.1 200.2 108.9
follows that: cp g "0.183 JVar[cX ]" t J1!o2 hence the standard deviation of the information component is approximately 18 cents (per period). Finally, the standard deviation of e is calibrated to be 12.5 t cents or one ‘tick’ (per period).
14
D. Bertsimas, A.W. Lo/Journal of Financial Markets 1 (1998) 1—50
Table 2 Best-execution strategies for acquiring a 100,000-share block of stock within 20 periods, for a simulated realization of the information variable MX N and price shock Me N, assuming an initial t t price P "$50 and linear price-impact function hS #cX , where P "P #hS #cX #e and 0 t t t t~1 t t t h"5]10~5, c"5.0, X "oX #g , X "0, p2"0.001, p2"(0.125)2, and o"0.50. Note: The t t~1 t 0 g e non-negativity restriction was not imposed and was not binding in this realization. Performance summary Metric
Naive strategy ($1000s)
Optimal strategy ($1000s)
Improvement (cents/share)
Expected cost Actual cost
5231.0 5248.3
5226.9 5252.4
4.0849 !4.1143
Period
P t
S* t
d ¼ w,T~t t
d X x,T~t t
cX t
» /$1000 t
Cost-to-go
1 2 3 4 5 6 7 8 9 10 11 12 13 14 15 16 17 18 19 20
49.927 50.508 50.779 51.390 51.693 51.669 51.844 51.767 51.644 51.890 51.901 52.045 52.840 53.639 54.224 54.367 54.237 54.436 54.479 54.871
2014 7927 6310 5070 5547 4227 6208 1322 2794 5978 2880 4950 10082 10378 6980 3273 1280 3643 3979 5156
5000 5157 5003 4926 4917 4875 4922 4823 5115 5325 5260 5525 5597 4956 4052 3466 3515 4259 4568 5156
!2986 2770 1307 144 630 !648 1287 !3501 !2320 653 !2380 !575 4486 5423 2928 !193 !5534 !617 !588 0
!0.17 0.15 0.07 0.01 0.04 !0.04 0.08 !0.21 !0.14 0.04 !0.15 !0.04 0.30 0.38 0.22 !0.02 !0.21 !0.07 !0.12 0.03
5226.9 5169.8 4771.9 4436.7 4210.4 3915.5 3694.8 3331.2 3261.7 3121.8 2790.2 2645.1 2408.5 1888.3 1329.5 948.1 765.7 697.1 499.1 282.9
5252.4 5151.8 4751.5 4431.1 4170.5 3883.7 3665.3 3343.3 3274.9 3130.6 2820.4 2670.9 2413.3 1880.6 1323.9 945.4 767.4 698.0 499.7 282.9
For the first simulated realization the expected best-execution cost is $5,251,395, which compares favorably with the expected cost of $5,255,185 for the naive strategy,9 implying an improvement of 3.8 cents/share on average. However, since the information variable X is stochastic, and since t
9 The expected cost of the naive strategy under Eqs. (2.18) and (2.19) is given by
C
D
AB
A
B
T SM 2 ¹(¹#1) SM cX o!oT`1 1 ¹! E + P SM /¹ "P SM #h # . t 0 1 ¹ 2 ¹ 1!o 1!o t/1
15
D. Bertsimas, A.W. Lo/Journal of Financial Markets 1 (1998) 1—50
Table 3 Best-execution strategies for acquiring a 100,000-share block of stock within 20 periods, for a simulated realization of the information variable MX N and price shock Me N, assuming an initial t t price P "$50 and linear price-impact function hS #cX , where P "P #hS #cX #e and 0 t t t t~1 t t t h"5]10~5, c"5.0, X "oX #g , X "0, p2"0.001, p2"(0.125)2, and o"!0.50. Note: t t~1 t 0 g e The non-negativity restriction was not imposed and was not binding in this realization. Performance summary Metric
Naive strategy ($1000s)
Optimal strategy ($1000s)
Improvement (cents/share)
Expected cost Actual cost
5256.3 5267.2
5255.6 5265.0
0.6 2.1
Period
P t
S* t
d ¼ x,T~t t
d X x,T~t t
cX t
» /$1000 t
Cost-to-go
1 2 3 4 5 6 7 8 9 10 11 12 13 14 15 16 17 18 19 20
50.373 50.467 51.081 51.140 51.330 51.828 52.099 52.279 52.674 52.463 52.821 53.161 53.332 53.222 53.782 53.947 53.929 54.296 54.803 54.989
5586 6341 3429 5077 5246 3846 4579 6033 4204 7732 3652 4839 5708 7144 2006 4886 6253 3827 3450 6161
5000 4969 4893 4979 4973 4955 5034 5069 4989 5060 4793 4919 4929 4818 4431 4916 4923 4480 4806 6161
586 1372 !1464 98 273 !1109 !455 964 !785 2672 !1140 !80 779 2326 !2425 !30 1330 !652 !1355 0
!0.09 !0.21 0.23 !0.02 !0.04 0.17 0.07 !0.15 0.12 !0.43 0.18 0.01 !0.13 !0.39 0.41 0.01 !0.24 0.13 0.27 0.04
5255.7 4976.1 4662.4 4512.0 4234.4 3970.5 3788.7 3542.8 3231.4 2999.4 2583.3 2393.2 2136.5 1821.8 1442.7 1340.0 1071.0 732.0 527.2 338.8
5265.0 4983.6 4663.6 4488.5 4228.8 3959.6 3760.3 3521.7 3206.3 2984.8 2579.2 2386.3 2129.0 1824.6 1444.4 1336.5 1072.9 735.7 527.9 338.8
the best-execution strategy S* is a function of X , the actual execution cost of the t t best-execution strategy will not typically be equal to its expected value. For this realization, the actual cost of the best-execution strategy is $5,296,615 and the actual cost of the naive strategy is $5,314,906, yielding an improvement of 18.3 cents/share. Of course, while the expected best-execution cost is guaranteed to be lower than the expected cost of all other feasible strategies, there is no assurance that the best-execution strategy will always yield the lowest execution cost — Table 2 provides another simulated realization for which the actual cost of the naive
16
D. Bertsimas, A.W. Lo/Journal of Financial Markets 1 (1998) 1—50
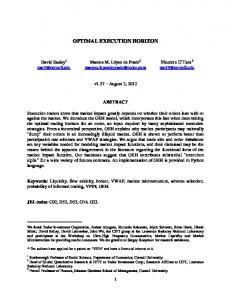
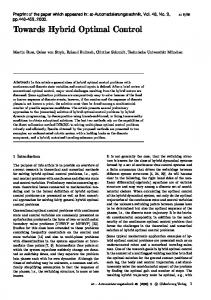
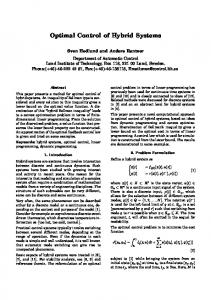
strategy is lower than that of the best-execution strategy, despite the fact that the best-execution strategy possesses a lower expected cost. Tables 1 and 2 also demonstrate the adaptive nature of the best-execution strategy. For example, Table 1 shows that in periods 7—10, unusually large trades — over 8000 shares in each of these four periods — were executed (recall that the naive strategy executes 5000 shares in each period). The columns labelled ‘d ¼ ’ and ‘d X ’ report the breakdown of these trades into two w,T~t t x,T~t t components, one due to the non-information-related motive for trade, and the other due to the impact of the information contained in the state-variable X for t the expected price. In periods 7—10, there were unusually large realizations for X implying higher expected prices in the future (since X is positively autocort t related), and this information component is responsible for the additional shares executed. In period 12, an unusually low realization for X occurs, yielding t a negative information component, hence the shares executed in that period is lower than usual. Figs. 1 and 2 provide a clearer illustration of the adaptive nature of the best-execution strategy. Because information is positively serially correlated, positive realizations of X imply not only higher trading costs now, but higher trading costs for several t periods thereafter (on average), hence the best-execution strategy calls for largerthan-usual trades during these high-cost periods, a somewhat counterintuitive but optimal trading pattern. When the information component exhibits persistence, trading ‘into’ expected price increases can be more economical than the natural tendency to wait for a more favorable price. Of course, the best-execution strategy depends intimately on the specific dynamics of the information variables that enter the price-impact function. In particular, if in our example o were negative, the opposite patterns would be observed — a large positive realization of X would portend negative realizations t of X in the near future (on average), and this would cause trading to be shifted t from today into the future. Table 3 and Fig. 3 illustrate this intuition explicitly. In contrast to the best-execution strategies of Tables 1 and 2, here a large positive realization X — in period 3, for example — reduces the trade size for that t period, and vice-versa for large negative realizations of X . Instead of trading t into price rises, the fact that X exhibits reversals implies that it is optimal to t trade out of them.
3. Linear-percentage temporary price impact The closed-form best-execution strategies derived in Section 2 were primarily illustrative examples, meant to introduce the overall approach and provide some intuition for the determinants and properties of best-execution strategies in a simple context. But from a practical perspective, these illustrative examples have several important limitations.
D. Bertsimas, A.W. Lo/Journal of Financial Markets 1 (1998) 1—50
17
Fig. 1. Best-execution strategy and information-based component for Table 1.
In particular, the fact that, aside from price impact, prices P are assumed to t follow arithmetic random walks in Eqs. (2.3) and (2.18) implies a positive probability of negative prices. Also, the random walk specification implies that both price impact and information have only permanent effects on prices, which
18
D. Bertsimas, A.W. Lo/Journal of Financial Markets 1 (1998) 1—50
Fig. 2. Best-execution strategy and information-based component for Table 2.
contradicts several recent empirical studies that suggest some combination of permanent and temporary effects (see, for example, Barclay and Litzenberger, 1988; Barclay and Warner, 1993; Chan and Lakonishok, 1993, 1995; Holthausen; Leftwich, and Mayers, 1987, 1990). And finally, because of the linearity
D. Bertsimas, A.W. Lo/Journal of Financial Markets 1 (1998) 1—50
19
Fig. 3. Best-execution strategy and information-based component for Table 3.
in Eqs. (2.3) and (2.18), the percentage price impact — as a percentage of the execution price — is a decreasing function of the price level, which is also counterfactual (see, for example, Birinyi, 1995; Leinweber, 1993, 1994; Loeb, 1983).
20
D. Bertsimas, A.W. Lo/Journal of Financial Markets 1 (1998) 1—50
3.1. LPT law of motion For these reasons, we propose a more plausible alternative to Eqs. (2.3) and (2.18) which we call the ‘linear-percentage temporary’ (LPT) law of motion. Specifically, let the execution price at time t be comprised of two components, a no-impact price PI , and the price impact * : t t P "PI #* . (3.1) t t t The no-impact price may be viewed as the price which would prevail in the absence of any market impact — a plausible and observable proxy for such a price is the midpoint of the bid/offer spread (although it can be arbitrary as long as it is unaffected by the trade size S ).10 The fact that PI may be observable t t is important for the empirical implementation of our best-execution strategy, and is explored more fully in Bertsimas et al. (1998). For convenience, and to ensure non-negative prices, we shall adopt a geometric Brownian motion specification for the price dynamics of PI : t PI "PI exp(Z ) (3.2) t t~1 t where Z is an IID normal random variable with mean k and variance p2. z t z The price impact * captures the effect of trade size S on the transaction t t price (including the bid/offer spread), and we shall assume that as a percentage of the no-impact price PI , it is a linear function of the trade size S and t t X where, as before, X proxies for private information or market conditions, t t hence * "(hS #cX )PI , (3.3) t t t t X "oX #g (3.4) t t~1 t where g is white noise with mean 0 and variance p2. Once again we have g t set X to be an AR(1) process which allows us to capture varying degrees t of predictability in information or market conditions. The parameters h and c measure the sensitivity of price impact to trade size and market conditions. This LPT specification of the law of motion for P resolves a number of t problems facing the linear price impact specification of Section 2. First, PI is t guaranteed to be non-negative, and P is also guaranteed to be non-negative t under mild restrictions on * . t
10 Indeed, the electronic crossing system POSIT — long recognized as a means of trading equities without market impact — uses the average of the bid and offer prices in crossing its orders.
D. Bertsimas, A.W. Lo/Journal of Financial Markets 1 (1998) 1—50
21
Second, by separating the transaction price P into a no-impact comt ponent PI and the impact component * , the price impact of a trade is temt t porary, moving the current transaction price but having no effect on future prices. Third, the percentage price impact increases linearly with the trade size, which is empirically more plausible than having absolute price impact increasing linearly with trade size (see, for example, Loeb, 1983 (Table 2)). Fourth, the LPT law of motion implies a natural decomposition of execution costs, decoupling market-microstructure effects from price dynamics, which is closely related to Pe´rold’s (1988) notion of implementation shortfall. To see this, observe that under Eq. (3.1) the optimization problem is given by
C
D
C G C
D
T T Min E + P S "Min E + PI (1#hS #cX )S (3.5) t t t t t t 1 1 M N M N t t t/1 t/1 S S T T "Min E + PI S #E + * S (3.6) t t t t 1 1 M N St t/1 t/1 subject to the laws of motion (3.1)—(3.4) and (2.4). Because Eq. (3.1) implies that price impact is a temporary phenomenon, affecting only the current trade price P and not the no-impact price level PI , the objective function in Eq. (3.6) t t separates into two terms. The first term is the no-impact cost of execution and the second term is the total impact cost. This decomposition is precisely the one proposed by Pe´rold (1988) in his definition of implementation shortfall, but now applied to executing SM . In particular, the ‘paper’ return or execution cost is given by the first term, the actual cost is given by the sum of the two terms, hence the second term is the implementation shortfall in executing SM . And finally, we shall see in the following section that the LPT specification admits a closed-form solution in which the best-execution strategy is a simple linear function of the state variables and the optimal-value function is quadratic.
D C
DH
3.2. The best-execution strategy As in Section 2, we consider the unconstrained problem here and derive the best-execution strategy via dynamic programming. The constrained case is discussed in Section 6 — dynamic programming cannot easily accommodate constraints because of its recursive nature, and we refer readers to some approximation methods that may be more useful in the presence of constraints. The best-execution problem is given by
C
D
T Min E + P S t t 1 M N St t/1 subject to the LPT law of motion (3.1)—(3.4) and (2.4).
(3.7)
22
D. Bertsimas, A.W. Lo/Journal of Financial Markets 1 (1998) 1—50
By solving the usual Bellman equation recursively, we obtain the following best-execution strategy and optimal-value function: S* "d X #d ¼ #d , T~k x, k T~k w, k T~k 1, k
(3.8)
» (PI , X , ¼ )"qPI [a #b X #c X2 T~k T~k~1 T~k T~k T~k~1 k k T~k k T~k #d X ¼ #e ¼ #f ¼2 ] , k T~k T~k k T~k k T~k (3.9) where q, E[exp(Z )]"exp(k #p2/2) and Md , d , d N and Ma ,2, f N t z x, k w, k 1, k k k are fixed coefficients given in the Appendix. These expressions are qualitatively similar to those of the linear price impact case: the best-execution strategy is a linear function of the two state-variables X and ¼ , but now with an added constant term, and the t t optimal-value function is a quadratic function of X and ¼ , but is now t t proportional to PI . 3.3. A Monte Carlo analysis of best execution To gauge the practical relevance of the best-execution strategy under the LPT law of motion, we perform several Monte Carlo simulation experiments for various combinations of parameter values. Specifically, we return to the numerical example of Section 2.5 in which the goal is to minimize the expected execution costs of a 100,000-share purchase over ¹"20 periods for a stock currently trading at P "$50, where the parameters of the LPT law of motion 0 are calibrated as: k"0, p "0.02/J13, h"5]10~7, g &N(0, 1!o2), z t c"0.0000, 0.0010, 0.0025, 0.0050, 0.0100, o"!0.50, !0.25, 0.00, 0.25, 0.50. The first two parameters imply that the continuously compounded return log PI /PI has zero mean and a 2% daily standard deviation (recall that each t t~1 period is meant to be a 30 minute interval and there are 13 such intervals in a typical trading day for the New York Stock Exchange, hence the divisor J13 for the standard deviation). The parameter h is calibrated to yield a percentage price impact of 5% for a 100,000-share trade. Observe that the variance of the error term g for the information variable t X is a function of the autocorrelation coefficient o — this specification t yields a unit variance for X for any value of o. Such a normalization is always t
D. Bertsimas, A.W. Lo/Journal of Financial Markets 1 (1998) 1—50
23
possible regardless of the natural units of X (simply divide X by its stant t dard deviation), and is a convenient normalization since it implies that the information-sensitivity parameter c is measured in units of standard deviation of X . t For each combination of parameter values (we considered five different values for c and five different values for o, yielding 25 combinations), we simulated an independent set of 50,000 sample paths of MPI N and MX N, implemented the t t best-execution strategy (3.8) on each path, and recorded the realized bestexecution cost as well as the realized cost of the naive strategy SM /¹. The results of these simulations are summarized in Table 4 which is organized according to the values of c (rows) and o (columns). For example, the first three rows of the table correspond to simulation results for c"0.0000 — the first row reports the expected cost (in cents/share above the no-impact cost P SM ) of either 0 the best execution strategy (the ‘S*’ column) or the naive strategy (the ‘SM /¹’ column), the second row reports the average realized cost of either strategy (averaged over 50,000 replications), and the third row contains in parentheses the standard errors of the average realized cost reported in the second row. The five column-subpanels correspond to the five different values for o and the five row-subpanels correspond to the five different values for c. Consider the first row-subpanel and third column-subpanel, which corresponds to the simulation for c"0.0000 and o"0.00. In this case, the expected cost of best execution is 13.3058 cents/share above the no-impact cost P SM , 0 and is close but not identical to the expected cost of the naive strategy, 13.3098 (the ‘Diff’. column reports the difference of the two). This is not surprising because in this case the information variable X plays no role in detert mining price impact, hence the best-execution strategy and the naive strategy yield similar costs. However, the costs are not identical because the optimal strategy does account for the drift in the stock price, and while these effects are minimal for the c"0.0000 case, they are not zero. Observe that some slight differences between the best-execution and naive strategies are observed in the second row’s entries. Recall that these entries are the average realized execution costs for the two strategies, and these averages are subject to sampling variation (even for 50,000 replications). However, they are reasonably close to their theoretical counterparts, and would be even closer for a larger number of replications. As we move down to the next row-subpanel, where c"0.0010, the differences between the best-execution and naive strategies become more pronounced. For example, when o"!0.50 the best-execution strategy has an expected cost of 12.8778 cents/share while the naive strategy’s expected cost is still fixed at 13.3098 (the expected cost of the naive strategy does not depend on c or o). When c increases, implying that information X has a larger effect on price t impact * , the best-execution strategy performs even better. For c"0.0050 and t
0.0100
0.0050
0.0025
0.0010
0.0000
c
13.3058 13.3098 13.3207 13.3260 (0.3325) (0.3349) 12.8778 13.3098 12.9780 13.4086 (0.3308) (0.3331) 10.6307 13.3098 10.9115 13.5869 (0.3315) (0.3338) 2.6054 13.3098 2.9075 13.6040 (0.3308) (0.3317) !29.4961 13.3098 !29.4341 13.3893 (0.3454) (0.3343)
Diff.
S*
o"0.00 SM /¹ Diff.
S*
o"0.25 SM /¹
Diff.
S*
o"0.50 SM /¹
Diff.
0.0040 13.3058 13.3098 0.0040 13.3058 13.3098 0.0040 13.3058 13.3098 0.0040 13.3058 13.3098 0.0040 0.0053 13.2289 13.2329 0.0040 13.2538 13.2575 0.0038 12.9591 12.9584 !0.0007 13.1136 13.1163 0.0027 (0.0032) (0.3301) (0.3325) (0.0031) (0.3302) (0.3325) (0.0031) (0.3307) (0.3331) (0.0031) (0.3309) (0.3333) (0.0031) 0.4320 12.8933 13.3098 0.4165 12.9195 13.3098 0.3903 12.9590 13.3098 0.3508 13.0228 13.3098 0.2870 0.4305 13.0345 13.4556 0.4212 12.9273 13.3059 0.3786 12.9476 13.3056 0.3580 13.3972 13.6819 0.2847 (0.0069) (0.3306) (0.3329) (0.0083) (0.3319) (0.3342) (0.0098) (0.3292) (0.3314) (0.0113) (0.3308) (0.3330) (0.0129) 2.6791 10.7276 13.3098 2.5822 10.8911 13.3098 2.4187 11.1381 13.3098 2.1717 11.5370 13.3098 1.7728 2.6754 10.8182 13.4205 2.6023 10.6637 13.1275 2.4638 11.4047 13.5947 2.1900 11.1427 12.8976 1.7550 (0.0166) (0.3309) (0.3329) (0.0197) (0.3311) (0.3327) (0.0236) (0.3330) (0.3343) (0.0275) (0.3326) (0.3338) (0.0319) 10.7044 2.9929 13.3098 10.3169 3.6468 13.3098 9.6630 4.6348 13.3098 8.6750 6.2305 13.3098 7.0793 10.6965 2.8609 13.2108 10.3499 3.6529 13.3177 9.6647 4.7800 13.5062 8.7262 6.5647 13.6405 7.0758 (0.0370) (0.3323) (0.3331) (0.0421) (0.3330) (0.3322) (0.0488) (0.3357) (0.3333) (0.0567) (0.3398) (0.3363) (0.0650) 42.8059 !27.9460 13.3098 41.2558 !25.3304 13.3098 38.6402 !21.3783 13.3098 34.6881 !14.9956 13.3098 28.3054 42.8234 !28.2093 13.1683 41.3776 !25.3868 13.2366 38.6233 !21.3424 13.4958 34.8382 !15.2465 13.0046 28.2511 (0.1051) (0.3453) (0.3344) (0.1052) (0.3512) (0.3368) (0.1129) (0.3578) (0.3393) (0.1273) (0.3679) (0.3432) (0.1445)
S*
SM /¹
Diff.
SM /¹
S*
o"!0.25
o"!0.50
Table 4 Monte Carlo simulations of execution costs for purchasing SM "100,000 shares of stock with an initial price P "$50 over ¹"20 periods — in cents/share above 0 the no-impact cost P SM — under the optimal strategy S* and the naive strategy SM /¹. The three rows that correspond to each value of c contain the theoretical 0 values of the best execution costs (first row), the means (each averaged over 50,000 replications) of the Monte Carlo simulations of the actual realized costs (second row), and the standard errors of those means (third row), respectively. A linear-percentage price-impact function P "PI (1#aS #cX ) is assumed, where PI is t t t t t the zero-impact price, S is the number of shares executed, and X is an information variable that measures current market conditions. The data-generating t t process for PI and X are given by: PI "PI exp(Z ), Z &N(k , p2), and X "oX #g , g &N(0, p2). The simulation parameters were calibrated to t t t t~1 t t z z t t~1 t t g approximate half-hour intervals: a"5]10~7, k "0 p2"(0.02)2/13, p2"1!o2, X "0, PI "50 z z g 1 0
24 D. Bertsimas, A.W. Lo/Journal of Financial Markets 1 (1998) 1—50
D. Bertsimas, A.W. Lo/Journal of Financial Markets 1 (1998) 1—50
25
o"!0.50, the best-execution strategy outperforms the naive strategy by 10.7044 cents/share, with an expected execution cost of only 2.6054 cents/share. When c"0.0100 the expected execution costs become negative — in this case, there is so much value in exploiting X that the best-execution strategy performs t better than the no-impact benchmark P SM . Although this case is unrealistic, it 0 does highlight the important role that information can play in determining execution costs. Table 4 shows that under the LPT law of motion, the best-execution strategy yields a significant improvement over the naive strategy, approximately 3—5 cents/share for empirically plausible parameter values, which amounts to a 25—40% reduction in execution costs. Of course, these figures are highly parameter specific and also depend intimately on the particular law of motion we have chosen. Nevertheless these Monte Carlo results seem to suggest that in some cases, best-execution strategies are quite effective in controlling execution costs.
4. The general formulation In this section we describe the general approach to minimizing expected execution costs. Despite the fact that closed-form solutions may not exist for many cases of empirical interest, in almost all cases it is possible to obtain numerical solutions to well-posed dynamic programming problems. We begin with the same objective function:
C
D
T Min E + P S t t 1 M N St t/1 subject to the same constraint: T + S "SM t t/1 but with a more general law of motion: P "f (P , X , S , e ), (4.1) t t t~1 t t t X "g (X , g ), (4.2) t t t~1 t ¼ "¼ !S , ¼ "SM , ¼ "0. (4.3) t t~1 t~1 1 T`1 The price-impact function is now implicitly contained in the law of motion (4.1) for P , which is a general nonlinear and possibly time-varying function f of P , t t t~1 a state-vector X , the control S , and a random shock e .11 Since X is a vector of t t t t 11 We follow the convention that all vectors are column vectors unless they are explicitly transposed, and that boldface Roman letters denote vectors and matrices.
26
D. Bertsimas, A.W. Lo/Journal of Financial Markets 1 (1998) 1—50
arbitrary dimension, it can accommodate multiple factors as in the ordered probit model of Hausman et al. (1992), and the fact that g ( ) ) is a function of only t a single lag is not as restrictive as it may seem because additional lags may be captured by increasing the dimension of X , i.e., expansion of the states. Moret over, since g ( ) ) is not restricted to be linear, it is possible to capture complex t dynamic behavior of the state variables parsimoniously, e.g., threshold autoregressions, Markov switching processes, etc. The Bellman equation and optimal trade at the end of the fixed horizon is given by » (P , X , ¼ )"Min E [P S ]"E [ f (P , X , ¼ , e )¼ ], T T~1 T T T T T T T T~1 T T T T ST (4.4) S*"¼ . T T In period ¹!1, the Bellman equation becomes
(4.5)
» (P ,X ,¼ )"Min E [P S #» (P , X , ¼ )] T~1 T~2 T~1 T~1 T~1 T~1 T~1 T T~1 T T ST~1 (4.6) [f (P ,X ,S ,e )S "Min E T~1 T~1 T~2 T~1 T~1 T~1 T~1 T~1 S #» ( f ( ) ), g ( ) ), ¼ !S )] . (4.7) T T~1 T T~1 T~1 Performing the one-period minimization in Eq. (4.7) — subject to any additional constraints that might be present — yields the optimal trade S* as a function of T~1 the state variables P ,X , and ¼ . Hence T~2 T~1 T~1 (P ,X ,¼ ). (4.8) S* "h T~1 T~1 T~2 T~1 T~1 Proceeding recursively in this fashion, the optimal-value function and optimal trade at time ¹!k is then » (P , X , ¼ )"Min E [P S T~k T~k~1 T~k T~k T~k T~k T~k St #» (P , X ,¼ )] (4.9) T~k`1 T~k T~k`1 T~k`1 "Min E [ f (P , X , S , e )S T~k T~k T~k~1 T~k T~k T~k T~k ST~k #» (f ( ) ), g ( ) ), ¼ !S )], T~k`1 T~k T~k`1 T~k T~k ,X ,¼ ) S* "h (P T~k T~k T~k~1 T~k T~k
(4.10) (4.11)
D. Bertsimas, A.W. Lo/Journal of Financial Markets 1 (1998) 1—50
27
and when we reach the starting point of the trading horizon: » (P , X , ¼ )"Min E [P S #» (P , X , ¼ )] 1 1 1 2 1 2 2 1 0 1 1 S1
(4.12)
"Min E [f (P , X , S , e )S #» (f ( ) ), g ( ) ), ¼ !S )] (4.13) 1 1 0 1 1 1 1 2 1 2 1 1 S1 (4.14) S*"h (P , X , ¼ ), ¼ "SM 1 1 0 1 1 1 the initial conditions will enable us to obtain the entire sequence of optimal trades as functions of the state variables, which yields the best-execution strategy: S*"h (P , X , SM ), 1 1 0 1 S*"h (P , X , SM !S*), 1 2 2 1 2 F
A
B
k~1 S*"h P , X , SM ! + S* , k k k~1 k t t/1 F
A
B
T~1 S* "h P ,X , SM ! + S* , T~1 T~1 T~2 T~1 t t/1 T~1 (4.15) S*"SM ! + S*. t T t/1 Moreover, the optimal-value function at the start of the trading horizon, » (P , X , SM ), is an estimate of the best-execution costs, and depends only on the 1 0 1 initial price, the initial state-vector, and the total number of shares to be traded. Of course, for certain specifications of the law of motion, computing the optimal control explicitly may be intractable because a closed-form expression for the optimal-value function » (2) is not available (see Eq. (4.10)). T~k`1 Therefore, in the next two sections we propose alternatives that address the computational challenges of determining best execution. 4.1. A discretization approach Perhaps the most common method for solving dynamic programming problems numerically is to discretize the state space and control space and perform the dynamic optimization via grid search at each stage. In particular, we discretize the possible prices P as a multiple of some t constant, d. A natural choice for d is 1 since the minimum variation of prices on 8 most US stocks is $0.125. Suppose that the horizon ¹ is such that the range of
28
D. Bertsimas, A.W. Lo/Journal of Financial Markets 1 (1998) 1—50
possible prices is concentrated on a relatively small interval and let K be the number of possible values in that interval. Let the trade sizes S also be discrete, t varying in fixed increments of s shares — an obvious choice for s is 100 shares since most institutional trades are round lots. This implies that ¼ , the remaint ing shares to be executed at time t, is also denominated in multiples of s. Let J"SM /s denote the number of round lots that need to be executed initially. Finally, let the information vector X take on a finite number N of possible t values. Under these assumptions, at each time t the optimal-value function » (P , X , ¼ ) must be evaluated numerically for KJN possible values. Note t t~1 t t that these values need to be stored only temporarily, as they will be used in step t!1 of the dynamic programming algorithm, but not at step t!2 (at this step the values » (P , X , ¼ ) are needed). As a result, the total memory t~1 t~2 t~1 t~1 requirements are of the order O(KJN). In order to develop some intuition for the computational requirements of the discretization, consider the following example. Suppose that 100,000 shares, currently trading at $50, must be executed over the next 20 periods. We assume that within this time period, the price will be within $45 and $55, meaning that there are K"80 possible prices to consider (multiples of 1). If we choose s"100 8 then J"1000. We also discretize the information variable into N"10 states. Then at each step we need to compute the optimal-value function for KJN"800,000 values of the state and control variables. With 20 periods, this implies a total of 16 million evaluations of the optimal-value function. Given the speed of today’s workstations, such computations can be performed in seconds. For example, if we assume that the computation of each optimal-value function » (P , X , ¼ ) takes 10~6 seconds, then the total comt t~1 t t putation will be 16 seconds. Of course, if we require a more refined discretization, the computational requirements increase dramatically. For example, if we allow trade size to vary in increments of 1 share instead of 100 shares, and if the information variable takes on 100 discrete values instead of 10, the computational demands increase by a factor of 1000. 4.2. Approximate dynamic programming For certain applications — stocks with high volatility, longer horizons, or a large number of information variables — the discretization approach may be computationally infeasible. In such cases, we propose a recently developed technique known as ‘approximate dynamic programming’ in which the optimal-value function is approximated at each stage by a quadratic function (see, for example, Bertsekas (1995)). In contrast to the discretization method which is numerical (but exact), approximate dynamic programming always yields an analytical (but approximate) solution.
D. Bertsimas, A.W. Lo/Journal of Financial Markets 1 (1998) 1—50
29
Specifically, let Y "(P , X , ¼ ) denote the state vector at time t. Beginning t t~1 t t at the end, we must first compute » (Y ) (note that this requires no minimizT T ation). We approximate this function with »K (Y ) where T T »K (Y ),Y @ Q Y #b@ Y T T T T T T T
(4.16)
and the matrix Q and vector b are selected to minimize: T T
P
(» (Y )!»K (Y ))2 dY . T T T T T
(4.17)
y T
This is a least-squares problem which can always be solved in closed form. At step ¹!k we apply the Bellman recursion but with one important difference: we use »K (Y ) in place of » (Y ) for the minimization: T~k`1 T~k`1 T~k`1 T~k`1 » (Y )"Min E [f (P , X , S , e )S T~k T~k T~k T~k T~k~1 T~k T~k T~k T~k T~k S #»K (f ( ) ), g ( ) ), ¼ !S )]. T~k`1 T~k T~k`1 T~k T~k
(4.18)
This minimization can be easily performed because the approximating optimalvalue function is quadratic. After computing » (Y ), again we approximate T~k T~k this function with a quadratic function: »K (Y )"Y@ Q Y #b@ Y T~k T~k T~k T~k T~k T~k T~k
(4.19)
where, as before, the matrix Q and the vector b are selected to minimize: T~k T~k
P
(»
y T~k
(Y )!»K (Y ))2 dY . T~k T~k T T~k T~k
(4.20)
There are several compelling reasons for using a quadratic approximation to » (Y ). First, in all of cases we have considered in Sections 2 and 3, the T~k T~k optimal-value functions are quadratic, hence in these cases approximate dynamic programming is exact. Second, a quadratic approximation can capture a variety of nonlinearities parsimoniously. For example, if the vector of information variables contains three scalars — quite a challenge for the discretization approach — this implies that »K (Y ) is uniquely determined by the (5]5)T~k T~k matrix Q and the (5]1)-vector b . Finally, the minimization that must be t t performed at each stage of the dynamic program is considerably more tractable when the optimal-value function is quadratic. Of course, an unresolved issue is the magnitude of the approximation error. Because approximate dynamic programming is still in its infancy, very little is known about the magnitude of the approximation error. However, some preliminary studies seem to indicate that the approximations are quite good — see
30
D. Bertsimas, A.W. Lo/Journal of Financial Markets 1 (1998) 1—50
Bertsekas (1995, Chapter 6) and the accompanying references for further discussion.
5. Best execution for portfolios In the previous sections we have focused our attention on the best-execution strategies for a single stock, but in typical applications institutional investors trade many stocks at once, i.e., ‘list’ trading. In this section we extend our approach to the multivariate setting in which a portfolio of n stocks must be executed within ¹ periods. The portfolio case contains several interesting features not captured by our single-stock analysis. Perhaps the most important feature is the ability to capture cross-stock relations such as the cross-autocorrelations reported in Lo and MacKinlay (1990). In particular, one might expect price movements in one stock to induce similar movements in the price of another, either because of common factors driving both, or because of linked trading strategies, e.g., pairs trading, index arbitrage, etc. In such cases, the price impact of trading a portfolio may be larger than the sum of the price impact of trading the individual stocks separately. Alternatively, if some stocks are negatively correlated (perhaps because of portfolio substitution effects), or if the portfolio to be executed includes both purchases and sales, then the portfolio execution cost may be lower than the sum of the individual stocks’ execution costs due to a kind of diversification effect in which the trades of one stock lower the price impact of trades in another. Whether execution costs are magnified or mollified in the portfolio case is, of course, an empirical issue that turns on the law of motion for the vector of prices and state variables. In either case, it is clear that the portfolio setting is considerably more complex than the single-stock case. Fortunately, much of the analysis in Sections 2 and 3 — including closed-form solutions in the linear price impact and LPT law of motion cases — extends to the portfolio case with only minor changes in notation. Of course, for more complex laws of motion, especially those which require numerical solutions, the portfolio problem can quickly become computationally intractable. However, in such cases the approximate dynamic programming approach we discuss in Section 4.2 would be a suitable alternative — see Bertsimas et al. (1998) for a more detailed analysis. Let S1 ,[SM 2 SM ]@ denote the vector of stocks to be purchased or sold within 1 n ¹ periods, where a negative entry indicates a sale and a positive entry indicates a purchase. Denote by P , S , and W the n-vector of prices, shares executed, and t t t remaining shares to be executed, respectively, at time t. Then the best-execution problem for the portfolio S1 may be expressed compactly as
C
T Min E + P@S t t 1 M N St t/1
D
(5.1)
D. Bertsimas, A.W. Lo/Journal of Financial Markets 1 (1998) 1—50
31
Subject to T + S "S1 , (5.2) t t/1 W "W !S (5.3) t t~1 t and the law of motion for P and accompanying information variables X . In the t t next two sections, we present analytical solutions to Eq. (5.1) which illustrate the complexities (and opportunities) that the portfolio case has to offer. 5.1. The multivariate linear price impact case Suppose the price vector P follows the multivariate version of Eq. (2.18) t P "P #AS #BX #e (5.4) t t~1 t t t where A is a positive definite (n]n)-matrix, B is an arbitrary (n]m)-matrix, X is t an m-vector of information variables, and e is n-vector white noise with mean t 0 and covariance matrix R . As before, we assume that X follows a stationary e t AR(1) process. Hence X "CX #g (5.5) t t~1 t where C is an (m]m)-matrix with eigenvalues all less than unity in modulus, and g is m-vector white noise with mean 0, covariance matrix R , and which is t g independent of e . t Under the law of motion (5.4)—(5.5), the portfolio problem (5.1)—(5.3) can be solved via Bellman’s equation, which yields the following best-execution strategy and optimal-value function: S* "(I!1 A~1 A@)W #1 A~1 B@ CX , (5.6) 2 k~1 T~k T~k 2 k~1 k~1 T~k W #W @ A W » (P , X , W )"P @ T~k k T~k T~k~1 T~k T~k T~k~1 T~k T~k #X @ B W #X @ C X #d T~k k T~k T~k k T~k k (5.7) for k"0, 1,2, ¹!1, where A "A!1 AA~1 A@, A "A, 4 k k~1 0 B "1 C@B (A@ )~1A@#B@, B "B@, k 2 k~1 k~1 0 C "C@C C!1 C@B (A@ )~1B C, C "0, k~1 0 4 k~1 k~1 k k~1 (5.8) d "d #E[g@ C g ], d "0. T~k k~1 T~k 0 k k~1 Observe that Eq. (5.6) is qualitatively similar to the single-stock best-execution strategy — it is linear in the two state variables W and X . However, there is T~k T~k
32
D. Bertsimas, A.W. Lo/Journal of Financial Markets 1 (1998) 1—50
one key difference: in the portfolio case, unless the matrix A is diagonal, the best-execution strategy for one stock will depend on the parameters and state variables of all the other stocks. To see this, observe that the matrix coefficient in Eq. (5.6) will generally not be a diagonal (I!1A~1 A@) multiplying W 2 k~1 T~k matrix unless A is itself diagonal. Of course, if A is diagonal this means that trading in one stock has no price impact on any other stocks (see Eq. (5.4)), hence the portfolio problem essentially reduces to n independent single-stock problems. For this reason, whether or not the portfolio best execution cost is greater or less than the sum of the individual stocks’ best execution costs depends wholly on the values in A and is an empirical issue which is examined in Bertsimas et al. (1998). 5.2. The multivariate LPT case The multivariate version of the linear-percentage temporary price impact case is given by the following law of motion: P "P3 #D , (5.9) t t t P3 "exp(Z )P3 , vec(Z )&N(l , R ), (5.10) t t t~1 t z z D "diag[P3 ](AS #BX ), (5.11) t t t t X "CX #g , g &WN(0 , R ), (5.12) t t~1 t t z g where g is vector white noise with mean 0 and covariance matrix R , the vec( ) ) is t g the vectorization operator (which maps its matrix argument into a column vector composed of stacked columns of the matrix), and diag( ) ) is the diagonalization operator (which maps its vector argument into a diagonal matrix with the vector as the diagonal). The (n]n)-matrix A is assumed to be positive definite, B is an arbitrary (n]m)-matrix, and C is an (m]m)-matrix with eigenvalues less than unity in modulus. The specification (5.9) has the same motivation as the single-stock case (3.1) in which price impact is assumed to have only a temporary effect on market prices. The form of the price impact function D in Eq. (5.11) is also similar to that of the t single-stock case (3.3), except now the percentage price impact function for each stock i, * /P is a linear function AS of the trade sizes of all n stocks, not just of it it t S . As in Section 5.1, if A is diagonal the portfolio problem reduces to n indepenit dent single-stock problems. Under the law of motion (5.9)—(5.12), the portfolio problem (5.1)—(5.3) can be solved via Bellman’s equation, which yields the following best-execution strategy: S* "L W #G X #c T~k k T~k k T~k k
(5.13)
D. Bertsimas, A.W. Lo/Journal of Financial Markets 1 (1998) 1—50
33
where the fixed parameters L , G and c are calculated recursively.12 As in the k k k single-stock case (3.8), the best-execution strategy is linear in the two state variables W and X and has a constant term c as well. T~k T~k k 6. Imposing constraints In most practical applications, there will be constraints on the kind of execution strategies that institutional investors can follow. For example, if a block of shares is to be purchased within ¹ periods, it is very difficult to justify selling the stock during these ¹ periods even if such sales are warranted by the best-execution strategy.13 Therefore, in practice buy-programs (sell-programs) will almost always be accompanied by non-negativity (non-positivity) constraints. Such constraints are often binding for best-execution strategies, particularly when the information variable has a large effect on price impact. For example, Table 5 reports the frequency and magnitude of sells generated by the bestexecution strategy for the buy-program in Section 3.3 under the LPT law of motion. The last row shows that when c"0.0100, i.e., when information has an enormous effect on price impact — over 25% of the best-execution trades are sells, and the average total sell size is between 25% and 30% of the total number of shares SM to be executed. Of course, if we seek numerical solutions to the best-execution problem as discussed in Section 4.1, non-negativity constraints can be imposed almost trivially. Moreover, approximations to dynamic optimization such as the static optimization approach of Bertsimas and Lo (1998) may accommodate constraints more readily than a recursive algorithm like dynamic programming. Section 6.1 contains a more detailed discussion of the difficulties of imposing non-negativity constraints in our context. In Section 6.2 we present a rare example in which a closed-form best-execution strategy is available even when non-negativity constraints are imposed. Although certainly not generic, this example provides some insight into the nature of such constraints and their effect on best execution.
12 We omit these formulae for the sake of brevity — they offer no particular insights or intuition and would lengthen this paper by several pages. Interested readers may contact the authors for the formulae. 13 Other common constraints include sector-balance constraints, turnover constraints, tax-motivated constraints, and, in the portfolio case, dollar-balance constraints. This last type of constraint — the dollar-value of the portfolio at the end of trading lies within some fixed interval — is one of the most difficult to impose because the constraint is a function of the entire vector of prices which is stochastic. See Bertsimas and Lo (1998) for a probabilistic method of imposing such constraints.
0.0100
0.0050
0.0025
0.0010
0.0000
c
0.00 (0.00) 0.00 (0.00) 1.71 (0.01) 13.81 (0.03) 28.38 (0.03)
1.04 (0.01) 7.00 (0.02) 34.21 (0.06)
—
—
0.00 (0.00) 0.00 (0.00) 1.55 (0.01) 13.43 (0.03) 28.09 (0.03)
Prob. (%)
Prob. (%)
Size (%)
o"!0.25
o"!0.50
0.94 (0.01) 6.59 (0.02) 33.09 (0.05)
—
—
Size (%) 0.00 (0.00) 0.00 (0.00) 1.29 (0.01) 12.60 (0.03) 27.48 (0.03)
Prob. (%)
o"0.00
0.88 (0.01) 5.92 (0.02) 31.06 (0.05)
—
—
Size (%) 0.00 (0.00) 0.00 (0.00) 0.95 (0.01) 11.45 (0.03) 26.42 (0.03)
Prob. (%)
o"0.25
0.80 (0.01) 5.11 (0.02) 28.05 (0.05)
— — —
Size (%)
0.00 (0.00) 0.00 (0.00) 0.48 (0.01) 9.21 (0.03) 24.53 (0.03)
Prob. (%)
o"0.50
0.71 (0.01) 3.91 (0.02) 22.91 (0.05)
— — —
Size (%)
Table 5 Frequency and magnitude of sells generated by the best-execution strategy MS*N in Monte Carlo simulations of execution costs for purchasing S"100,000 t shares of stock with an initial price P "$50 over T"20. Entries in the ‘Prob. (%)’ column are averages, across 50,000 replications, of the percentage of 0 ¹ trades that are sells, hence these are estimates of the probability that any particular trade will be a sell. Entries in the ‘Size (%)’ column are averages, across 50,000 replications, of the total sell position of each replication as a percentage of S. Standard errors are given in parentheses. A linear-percentage price-impact function P "PI (1#aS #cX ) is assumed, where P is the zero-impact price, S is the number of shares executed, and X is an information t t t t t t t variable that measures current market conditions. The data-generating process for PI and X are given by: PI "PI exp(Z ), Z &N(k , p2), and t t t t~1 t t z z X "oX #g , g &N(0, p2). The simulation parameters were calibrated to approximate half-hour intervals: a"5]10~7, k "0, p2"(0.02)2/13, t t~1 t t g z z p2"1!o2, X "0, PI "50 g 1 0
34 D. Bertsimas, A.W. Lo/Journal of Financial Markets 1 (1998) 1—50
D. Bertsimas, A.W. Lo/Journal of Financial Markets 1 (1998) 1—50
35
6.1. Why imposing constraints is difficult Although there are well-known techniques for performing constrained optimization in a static setting, corresponding techniques for dynamic optimization problems have not yet been developed. To see why this is such a difficult task, consider the simplest case of imposing non-negativity restrictions S *0 in the t linear price-impact model of Section 2.1. Without any constraints, the optimalvalue function » is quadratic in the state variable ¼ , hence the Bellman T~k T~k equation can be easily solved in closed form (see Eq. (2.21)). But if nonnegativity constraints S *0 are imposed, » becomes a piecewise-quadratic t T~k function, with 3k pieces. To see how this arises, observe that for k"0 the optimal control is S*"¼ T T and » is a quadratic function of ¼ . In the next stage, k"1, we calculate the T T subject to the optimal control S* by minimizing a quadratic function of S T~1 T~1 constraints 0)S )¼ . The solution is given by T~1 T~1
G
if a ¼ #b X (0, 1 T~1 1 T~1 S* " a ¼ #b X if 0(a ¼ #b X (¼ , T~1 1 T~1 1 T~1 1 T~1 1 T~1 T~1 ¼ if a ¼ #b X '¼ . T~1 1 T~1 1 T~1 T~1 0
(6.1)
This partitions the range of ¼ into three intervals, over each interval T~1 there is a different optimal control S* , and within each interval » T~1 T~1 is a continuous quadratic function of ¼ . At the next stage, k"2, each T~1 of these three intervals is partitioned into another three intervals, each with a different optimal control S* , and so on, the number of intervals growing T~2 exponentially with k. Therefore, even in this simple case, calculating S* and T~k » exactly is only feasible for a very small number of periods ¹ (for example, T~k when ¹"20 there are 320"3,486,784,401 intervals at the last stage of the dynamic program). 6.2. A closed-form solution with non-negativity constraints To develop further intuition for how non-negativity constraints affect bestexecution strategies, in this section we present a specification of the law of motion under which a closed-form best-execution strategy is available under non-negativity constraints. Consider the single-stock case of Section 2 in which some information X affects price impact. However, in contrast to the linear price impact t specification of Section 2.4, suppose that X affects price impact in a multit plicative fashion, so that the price impact of a trade of S shares is hX S . t t t
36
D. Bertsimas, A.W. Lo/Journal of Financial Markets 1 (1998) 1—50
Instead of increasing or decreasing the price level, X now affects the price t elasticity. Let the price and information dynamics be given by the following law of motion: P "P #hX S #e t t~1 t t t
(6.2)
log X "log X #g t t~1 t
(6.3)
where e and g are independent white noise processes with mean 0 and variances t t p2 and p2, respectively. The price dynamics (6.2) imply that price impact is g e permanent, and the information dynamics (6.3) is an AR(1) in the logarithm of X to ensure that X is always positive so that the price elasticity hX cannot t t t change sign (if it does, the optimization problem is no longer well-defined because the objective function may not be convex). Under the law of motion (6.2)—(6.3) and (2.4), and with non-negativity constraints S *0, the investor’s minimization problem is well-posed. Once t again, we apply Bellman’s equation recursively to characterize the bestexecution strategy, this time performing a constrained minimization at each stage: » (P , X , ¼ )" Min E [P S T~k T~k~1 T~k T~k T~k T~k T~k 0xST~kxWT~k #»
(P , X ,¼ )]. T~k`1 T~k T~k`1 T~k`1 (6.4)
It can be shown that the best-execution strategy and optimal-value function is given by S* "a ¼ , T~k k T~k
(6.5)
» (P , X , ¼ )"P ¼ #hb X ¼2 T~k T~k~1 T~k T~k T~k~1 T~k k T~k T~k
(6.6)
for k"¹!1,2, 1 where the constants (a , b ) are computed recursively as k k follows:
G
(a , b )" k k
A
B
1 1 1! , 1! 2ib 4ib k~1 k~1
(0, ib ) k~1
1 * k~1 2i 1 if b ( k~1 2i if b
(6.7)
for k"1,2, ¹!1, where i,E[exp(g )]"E[X /X ] is the gross ext t t~1 pected growth rate of X , and (a , b )"(1, 1). By forward substitution using the t 0 0 law of motion, explicit expressions for the optimal controls S*,2, S* may be T 1
D. Bertsimas, A.W. Lo/Journal of Financial Markets 1 (1998) 1—50
37
obtained as S*"a SM , 1 T~1 (1!a )SM , S*"a 2 T~2 T~1 (1!a !a )SM , S*"a 3 T~3 T~2 T~1 F !2!a )SM , S*"a (1!a k T~k T~k~1 T~1 F S* "a (1!a !2!a )SM , T~1 1 2 T~1 T~1 S*"SM ! + S*. (6.8) T t t/1 From Eqs. (6.5) and (6.7), a clear structure for the best-execution strategy emerges. If i lies in the interval (0, 1], so that the expected growth rate of the 2 price elasticity hX is between !100% and !50%, then it follows from t Eq. (6.7) that a "1 and a "a "2"a "0. This implies that the best0 1 2 T~1 execution strategy is to trade nothing in the first ¹!1 periods and trade everything in the last period. With such a negative expected growth rate for the price elasticity, it pays to wait until the very end before trading. If i lies in the interval (1, 3], implying an expected growth rate between 2 4 !50% and !25%, then a "1, a "1!1/2i, and a "2"a "0. In 0 1 2 T~1 this case, the best-execution strategy is to trade nothing in the first ¹!2 periods, trade a fraction 1!1/2i of SM in the second-to-last period ¹!1, and all of the remaining shares in period ¹. As i increases, increasing the opportunity cost of delayed trades, the bestexecution strategy begins its trading sooner and sooner. When i"1, implying a zero expected growth rate for the price elasticity, Eqs. (6.5) and (6.7) show that the best-execution strategy reduces to that of the linear price impact model with no information (see Section 2.3): S*"2"S*"SM /¹. When the expected T 1 growth of X is 0, the law of motion for the multiplicative case has virtually t identical implications for expected execution costs as the linear price impact case, hence the best-execution strategy is the same. When i exceeds unity, the best-execution strategy tilts trades towards the earlier periods for obvious reasons, and as i increases without bound, a approaches unity from below, and in the limit the best-execution strategy T~1 is to trade the entire block SM in the first period. 7. Limitations, extensions, and open questions We have argued above that our general approach to defining and implementing best execution is quite general indeed, nevertheless, there are several
38
D. Bertsimas, A.W. Lo/Journal of Financial Markets 1 (1998) 1—50
important limitations, extensions, open research questions that bear further discussion. 7.1. Order types and optimal order-submission strategies In modelling the price impact of a single trade as a simple function of the number of shares traded, we have subsumed the choice of order type — limit versus market order — the investor will use to execute the trade. This choice is no simple matter, and requires a certain sophistication as well. Market orders are executed immediately but incur substantial price impact. Limit orders incur no price impact but may not be executed immediately, if at all. Therefore, the trade-off between limit and market orders is a subtle one that generates yet another dynamic optimization problem, one that is clearly beyond the scope of this paper but which has been the subject of several recent studies (see, for example, Angel, 1994; Harris and Hasbrouck, 1992; Harris, 1994; Kumar and Seppi, 1993; and Lo et al. (1998)). In particular, this optimization problem requires an explicit measure of the investor’s need for immediacy or ‘urgency’ which can then be balanced against the price impact of a market order. Of course, a mathematically more complete specification of the best-execution optimization problem would include order type as a control variable and urgency in the objective function. However, without some sort of simplification or approximation, this problem is computationally intractable. The best-execution strategies proposed in this paper can be viewed as a second-best solution: first optimize the number of shares to be traded within each 30 minute interval, and then perform a second optimization within this 30 minute interval to decide the proportion of market and limit orders to use. Although such a two-stage optimization will almost certainly not coincide with the globally optimal execution strategy, it may be an adequate approximation and will be the subject of future investigations. 7.2. The risks of best execution As Table 2 clearly illustrates, the best-execution strategy minimizes expected execution costs, not actual execution costs. Of course, without perfect foresight, minimizing actual execution costs is impossible. But in the same way that investors evaluate the risks surrounding a given expected return, we can also evaluate the uncertainty around expected best-execution costs. There are at least four sources of uncertainty surrounding the expected best-execution costs » : (1) the realized cost is typically different from the 1 expected cost, and although over time and trades the average of the former should equal the latter, this may be small comfort if the ‘tracking errors’ are wild and unpredictable; (2) the expected cost » is itself a function of random initial 1 conditions (X in particular), and will vary from program to program even if the 1
D. Bertsimas, A.W. Lo/Journal of Financial Markets 1 (1998) 1—50
39
same block of shares were to be executed each time and at the same initial price; (3) estimation errors of the parameter estimates for the law of motion for P and t X will be propagated recursively through Bellman’s equation to » , so that t 1 even small uncertainties in the parameter values may lead to large uncertainty in the expected execution cost; and (4) the law of motion for P and X may suffer t t from the kind of non-stationarities and time-variation that plague all economic models — factors that affect price impact and price dynamics last year need not be relevant next year, and vice versa. The third and fourth sources of uncertainty — parameter estimation errors and parameter instabilities — are problems that affect all quantitative models in financial economics. Moreover, there are no simple solutions to these problems and their impact must be assessed on a case-by-case basis. Therefore, we can only alert readers to these potentially important issues and leave them aside for now. To address the first and second sources of uncertainty, we simulate 50,000 sample paths of MP , X N for the LPT specification of Section 3.1 and for each t t sample path, we calculate the expected best-execution cost » and the actual 1 cost that the best-execution strategy generated. Moreover, we can decompose both the expected and actual cost into two components according to Eq. (3.6): a ‘fundamental value’ component (the first term of (3.6)) and a ‘price-impact’ component (the second term of (3.6)). The standard deviation of these two components over the 50,000 replications measures the risk of best-execution due to fundamentals and price-impact. Table 6 presents the Monte Carlo simulation results for various combinations of parameter values for c and o, and where the other parameter values are calibrated as in Table 4. The two rows that correspond to each value of c describe the behavior of the fundamental component (the first row) and the price-impact component (the second row). The ‘Expected Cost’ entry is the theoretical best-execution cost, and the ‘Simulation Mean’ and ‘Simulation Std. Dev.’ is the mean and standard deviation, respectively, of the actual cost of the best-execution strategy across the 50,000 replications. The entries in Table 6 show that under the LPT specification there is considerable uncertainty in execution costs, but that almost all of the uncertainty is due to variability in fundamentals (the first term of Eq. (3.6)), not price impact. For example, in the (c, o)"(0.0000, 0.00) case, the standard deviation of the fundamental component is 73.6114 cents/share, but the standard deviation of the price-impact component is only 0.1789 cents/share. Of course, the standard deviation of the price-impact component increases as the information component X becomes more important, i.e., as c increases. For example, in the extreme t case (c, o)"(0.0050, 0.25), the mean of the price-impact component is 3.8326 cents/share but the standard deviation is 7.7815. This is not surprising because as c increases, information plays a more important role in the best-excution strategy (and in the price-impact component specifically), hence the variability of information will manifest itself in the variability of the price-impact component.
0.0050
0.0010
0.0000
c
5000.8000 12.5058 5000.8000 12.0933 5000.8000 2.1929
5001.0883 12.5067 5000.4702 12.0958 5000.7811 2.2390
73.6337 0.1789 73.5890 0.8721 74.5058 5.8138
5000.8000 12.5058 5000.8000 12.1195 5000.8000 2.8468
Expected Cost
Simulation Std. Dev.
Expected Cost
Simulation Mean
o"0.00
o"!0.25
5000.8217 12.5060 5001.0150 12.1203 4999.9618 2.8394
Simulation Mean 73.6114 0.1789 73.7902 1.0957 74.3045 6.5070
Simulation Std. Dev.
5000.8000 12.5058 5000.8000 12.1590 5000.8000 3.8348
Expected Cost
o"0.25
5000.2701 12.5046 5000.9525 12.1604 5000.8120 3.8326
Simulation Mean
73.6561 0.1789 73.9691 1.3864 74.9754 7.7815
Simulation Std. Dev.
Table 6 Monte Carlo simulations of the two components of execution costs — fundamental and price-impact components (both in cents/share) — for purchasing SM "100,000 shares of stock with an initial price P "$50 over ¹"20 periods under the optimal strategy S*. A linear-percentage temporary price-impact 0 function P "PI #* is assumed, where D "(hS #cX )PI , PI is the zero-impact price, S is the number of shares executed, and X is an information t t t t t t t t t t variable that measures current market conditions. The data-generating process for PI and X are given by: PI "PI exp(Z ), Z &N(k , p2), and t t t t~1 t t z z X "oX #g , g &N(0, p2). The simulation parameters were calibrated to approximate half-hour intervals: h"5]10~7, k "0 p2"(0.02)2/13, t t~1 t t g z z p2"1!o2, X "0, PI "$50. The two rows that correspond to each value of c describe the behavior of the fundamental component (first row) and the g 1 0 price-impact component (second row). Within each row and for each of the three subpanels corresponding to o"!0.25, 0.00, 0.25, the expected cost is reported in the first column, the mean and standard deviation of the simulated cost (over 50,000 replications) is reported in the second and third columns, respectively, of each subpanel
40 D. Bertsimas, A.W. Lo/Journal of Financial Markets 1 (1998) 1—50
D. Bertsimas, A.W. Lo/Journal of Financial Markets 1 (1998) 1—50
41
But even in this case, the standard deviation of the price-impact component is still an order of magnitude smaller than the standard deviation of the fundamental component. These simulations suggest that while the overall risk of the best-execution strategy is substantial, virtually all of it is due to the variability of prices, not to the variability of price impact. This implies that most trading strategies, regardless of their optimality for execution costs, will exhibit similar risks. While risk preferences are crucial for determining optimal portfolios (see Section 7.3), they may not be as important for the narrower goal of minimizing execution costs. 7.3. Other objective functions Expected execution costs is only one of many possible objective functions that investors may wish to minimize. In particular, a natural alternative to expected costs is an objective function that also incorporates some measure of risk, e.g., variance of costs and other higher moments. Investors may be willing to accept a higher expected cost of execution if doing so will ensure a much lower variance in the cost of execution. Using the first moment as the objective function implicitly assumes that the investor is risk neutral with respect to execution costs, and while this may be a plausible assumption for broker/dealers and other institutional block-equity traders, we might expect such traders to charge some sort of premium above minimum expected execution costs due to adverse selection and other strategic considerations (see, for example, Glosten and Milgrom, 1985). While the inclusion of higher moments into the objective function is conceptually straightforward, analytical solutions for the best-execution strategy are not available except in a few very specialized cases.14 Nevertheless, numerical solutions are readily obtained in these cases, hence the risk of best execution can be managed in much the same way that static portfolio theory balances risk and expected return. However, this raises the larger issue of what the proper objective function should be. Specifically, while we have focused exclusively on execution costs in this paper, investors are ultimately interested in maximizing the expected utility of their wealth. Therefore, the most natural approach to execution costs is to maximize the investor’s expected utility of wealth subject to the law of motion for P and X , i.e., combine the portfolio optimization problem with the execut t tion problem. This is the approach taken by Davis and Norman (1990), Grossman and Vila (1992), Heaton and Lucas (1996), Magill and Constantinides (1976), Vayanos (1995), and Vayanos and Vila (1995). There is no doubt that such an approach is the ‘right’ one — our implicit two-stage optimization cannot yield a better outcome (in terms of the investor’s expected utility) than a combined optimization. But as with many financial optimization 14 In particular, we have derived approximate results for a mean-variance objective function in the linear additive case of Section 2.4
42
D. Bertsimas, A.W. Lo/Journal of Financial Markets 1 (1998) 1—50
problems, the maximization of expected utility with transactions costs is analytically and computationally intractable in all but the most stylized examples. And although such examples do provide important insights into the economics of transactions costs, they have little to say about minimizing transactions costs in practice. 7.4. Partial versus general equilibrium Our analysis assumes that the law of motion for P and X is given. In t t particular, the parameters and functional form of the law of motion are unaffected by the investor’s trades. Although this partial-equilibrium approach may be appropriate in some circumstances, one can imagine other circumstances when an equilibrium model is more appropriate. For example, if a small number of large investors dominate the market, then strategic considerations become more significant. In such cases, the law of motion for P and X will be directly influenced by t t each of the large investors’ trades, hence the best-execution strategy will depend on an infinite regress of expectations of other investors’ expectations. These strategic interactions and their equilibrium implications have been explored in some simple contexts by Jarrow (1992), Kyle (1985, 1989), and Vayanos (1995). Despite the potential importance of equilibrium considerations, our approach is still appropriate even in the presence of strategic behavior if the law of motion is properly calibrated and the environment relatively stable. In particular, if the law of motion is estimated from historical data (see, for example, Bertsimas et al., 1998), then it represents a ‘reduced-form’ description of price impact and price dynamics, which includes the effects of strategic interactions among large investors. Of course, the standard criticism of reduced-form models is also relevant in this context: structural changes cannot be anticipated by reducedform models. Nevertheless, given the level of anonymity imposed by current market structure, it is difficult to see how strategic interactions can be easily incorporated into the best-execution problem. However, this is an important open question that deserves further investigation.
8. Conclusion With the advent of more accurate models and measures of execution costs, and given the dramatic increase in institutional trading in recent years, the optimal control of execution costs has never been more important. We have argued that this is a dynamic optimization problem because trading takes time, the demand for financial securities is not perfectly elastic, and the price impact of current trades, even small trades, can affect the course of future prices. Using stochastic dynamic programming, we have derived trading strategies that minimize the expected cost of execution — called best-execution strategies — which adapt to changing market conditions and price changes in an optimal
D. Bertsimas, A.W. Lo/Journal of Financial Markets 1 (1998) 1—50
43
fashion. We have shown that the common approach of breaking up a large trade into a number of smaller trades of equal size is optimal only in one very special case: when price impact is linear in the trade size, permanent in its affect on future prices, and when prices follow an arithmetic random walk. For empirically more plausible price dynamics and price-impact functions, the best-execution strategy varies through time as a function of several state variables which measure market conditions and the remaining shares to be executed. Monte Carlo simulations indicate that for at least one specification of price dynamics and price impact, on average the execution cost of the best-execution strategy is 25% to 40% less than that of the naive strategy of trading in equal-size lots. A by-product of the dynamic programming algorithm is the expected cost of best-execution, which is given by the optimal-value function. This may be a useful benchmark for pricing principal-bid and negotiated-block transactions since dealers engaging in such ‘basket’ trades will be pricing their bids with an eye towards trading out of these positions as quickly and as cheaply as possible, i.e., they will seek best-execution strategies for the basket. We have extended our analysis to the portfolio case in which trades in several securities must be executed simultaneously. The results are qualitatively similar to the single-security case, but they differ in one important respect: the portfolio case captures potentially important cross-effects between prices and over time, and these cross-effects are optimally exploited by the portfolio best-execution strategy. In particular, unless the collection of securities are independent in terms of price impact — trades in one security have no impact on other securities’ prices — the components of the best-execution strategy for the portfolio will not, in general, be identical to the best-execution strategy for individual securities. Whether or not the portfolio execution costs are greater or less than the sum of individual securities’ execution costs depends of course on the signs and magnitudes of the cross-effects, a subject of ongoing investigation in Bertsimas et al. (1998). We have also discussed extensions of our results to more general price-impact functions and price dynamics, and to the case with constraints. In many cases numerical solutions are available, but in some cases — those with many constraints — alternatives to dynamic programming must be considered. Of course, the challenging problem of building transactions costs directly into optimal consumption/investment decisions and dynamic equilibrium models still remains. Our more modest goal in this paper is to minimize expected execution costs, a far simpler problem, but one which has considerable relevance and for which we can provide a fairly complete set of solutions.
Acknowledgements We thank Robert Ferstenberg for stimulating our interest in this area, and Petr Adamek and Martin Haugh for excellent research assistance. We
44
D. Bertsimas, A.W. Lo/Journal of Financial Markets 1 (1998) 1—50
are grateful to Dave Cushing, Chris Darnell, Rohit D’Souza, John Heaton, Holly Horrigan, Leonid Kogan, Bruce Lehmann, Greg Peterson, Jiang Wang, a referee and seminar participants at Columbia, Harvard, London Business School, MIT, Northwestern, the 1996 NNCM Conference, the NYSE Conference on Best Execution, the Society of Quantitative Analysts, and Yale for helpful comments and discussion. This research was partially supported by the MIT Laboratory for Financial Engineering, an Alfred P. Sloan Research Fellowship, an NSF grant (SBR—9709976), and a Presidential Young Investigator Award (DDM-9158118) with matching funds from Draper Laboratory.
Appendix A. In this appendix we derive the best-execution strategies for the linear and linear-percentage price-impact functions of Sections 2 and 3. A.1. Linear price impact We show that Eqs. (2.20) and (2.21) is the optimal control and optimal-value function, respectively, by induction on k. For k"0, the optimal control is S*"¼ and the optimal-value function is T T » (P , X , ¼ ),Min E [P S ]"(P #hS #cX )S T T~1 T T T T T T~1 T T T ST (A.1) "P ¼ #h¼2 #cX ¼ T T T T~1 T where we have substituted a "h, b "c, c "0, and d "0 in Eq. (2.21) to 0 0 0 0 obtain Eq. (A.1). Assuming that Eq. (2.21) holds for k, we will prove it for k#1. Applying Bellman’s equation yields » (P ,X ,¼ )"Min E [P S T~k~1 T~k~2 T~k~1 T~k~1 T~k~1 T~k~1 T~k~1 ST~k~1 #» (P , X , ¼ )]. T~k T~k~1 T~k T~k (A.2) Using the induction hypothesis we substitute Eq. (2.21) into Eq. (A.2) and obtain » (P ,X ,¼ )"Min E [P S T~k~1 T~k~2 T~k~1 T~k~1 T~k~1 T~k~1 T~k~1 ST~k~1 #P ¼ #a ¼2 T~k~1 T~k k T~k #b X ¼ #c X2 #d ]. k T~k T~k k T~k k (A.3)
D. Bertsimas, A.W. Lo/Journal of Financial Markets 1 (1998) 1—50
45
Using the laws of motion (2.18), (2.19), and (2.4) we obtain » (P ,X ,¼ ) T~k~1 T~k~2 T~k~1 T~k~1 #hS #cX )¼ "Min [(P T~k~2 T~k~1 T~k~1 T~k~1 ST~k~1 #a (S !¼ )2#b oX (¼ !S ) k T~k~1 T~k~1 k T~k~1 T~k~1 T~k~1 (A.4) #p2)#d ]. #c (o2X2 g k T~k~1 k Note that the function to be minimized in Eq. (A.4) is quadratic in S . T~k~1 Moreover, from the induction hypothesis a *0 (if h*0) and therefore the k function is convex. It is straightforward to verify that the optimal solution is attained at
A
B
h ob S* " 1! ¼ # kX . (A.5) T~k~1 T~k~1 2a T~k~1 2a k k Substituting Eq. (A.5) into Eq. (A.4) then yields Eq. (2.21) for k#1. Observe that a satisfies the following recursion: k h a "h 1! , a "h. (A.6) k 0 4a k~1 Solving this recursion yields
A
B
A
B
h 1 a " 1# . k 2 k#1
(A.7)
Therefore, the optimal control becomes ¼ ob " T~k~1# k X S* T~k~1 k 2a T~k~1 k and the induction is complete.
(A.8)
A.2. Linear percentage price impact As usual, we begin at the end by characterizing the optimal-value function » and then proceed recursively according to Bellman’s equation: T » (PI , X , ¼ )"Min E [P S ]"E [P ¼ ] T T~1 T T T T T T T T ST "qPI (¼ #cX ¼ #h¼2 ) T T~1 T T T
(A.9) (A.10)
46
D. Bertsimas, A.W. Lo/Journal of Financial Markets 1 (1998) 1—50
where q,E
A
p2 [exp(Z )]"E[exp(Z )]"exp k # z T~1 T T z 2
B
(A.11)
since, by assumption, Z is IID normal with mean k and variance p2. In the z t z next-to-last period, the optimal-value function satisfies: » "Min E [P S #» (PI , X , ¼ )] T~1 T~1 T~1 T~1 T T~1 T T ST~1 "Min MPI (1#hS #cX )S #qPI T~1 T~1 T~1 T~1 T~1 ST~1 ](¼ !S )[1#coX #h(¼ !S )]N. T~1 T~1 T~1 T~1 T~1 The best execution at ¹!1 is then #d ¼ #d S* "d X T~1 x,1 T~1 w,1 T~1 1,1 where d
c(qo!1) q q!1 " , d " , d " . x,1 2h(q#1) w,1 q#1 1,1 2h(q#1)
(A.12)
(A.13)
(A.14)
(A.15)
Therefore, the optimal-value function »
is given by T~1 » (PI ,X ,¼ )"qPI [a #b X #c X2 T~1 T~2 T~1 T~1 T~2 1 1 T~1 1 T~1 #d X ¼ #e ¼ #f ¼2 ] 1 T~1 T~1 1 T~1 1 T~1 (A.16)
where a "d (1#hd )!qd (1!hd ), 1 1,1 1,1 1,1 1,1 b "(1!q)d , 1 x,1 c "d (hd #c)!qd (co!hd ), 1 x,1 x,1 x,1 x,1 d "c(1#o)d , 1 w,1 e "2d , 1 w,1 f "hd . 1 w,1 Continuing in this fashion, we arrive at the following recursions:
(A.17a) (A.17b) (A.17c) (A.17d) (A.17e) (A.17f)
S #» (PI ,X ,¼ )] » "Min E [P T~k T~k T~k T~k`1 T~k T~k`1 T~k`1 T~k ST~k (A.18)
D. Bertsimas, A.W. Lo/Journal of Financial Markets 1 (1998) 1—50
47
which yields the best-execution strategy: S* "d X #d ¼ #d T~k x, k T~k w, k T~k 1, k where qod !c qf qe !1 k~1 k~1 , d " k~1 d " , d " . x,k 2(h#qf ) w,k h#qf 1,k 2(h#qf ) k~1 k~1 k~1 Hence
(A.19)
(A.20)
» (PI , X , ¼ )"qPI [a #b X #c X2 T~k T~k~1 T~k T~k T~k~1 k k T~k k T~k #d X ¼ #e ¼ #f ¼2 ] k T~k T~k k T~k k T~k (A.21) where a "d (1#hd )#q(a #p2c )!qd (e !d f ), (A.22a) g k~1 1,k k~1 1,k k~1 k 1,k 1,k k~1 b "qob !d (qe !1), (A.22b) k k~1 x,k k~1 c "d (hd #c)#qo2c !qd (od !d f ), (A.22c) k x,k x,k k~1 x,k k~1 x,k k~1 d "cd #qod (1!d ), (A.22d) k w,k k~1 w,k e "d #q(1!d )e , (A.22e) k w,k w,k k~1 f "hd . (A.22f) k w,k This set of recursions completely characterize the best-execution strategy MS*N, t and the expected cost of best execution is given by X ¼ » (PI , X , ¼ )"qPI [a #b X #c X2#d T~1 1 1 1 0 1 1 0 T~1 T~1 1 T~1 1 #e ¼ #f ¼2] T~1 1 T~1 1 T "Min E + P S . t t 1 M N St t/1
C
D
(A.23) (A.24)
References Aiyagari, R., Gertler, M., Asset returns with transactions costs and uninsured individual risk. Journal of Monetary Economics 27, 311—332. Allen, F., Gale, D., 1992. Stock-price manipulation. Review of Financial Studies 5, 503—529. Angel, J., 1994. Limit versus market orders. Working Paper No. FINC-1377-01-293, School of Business Administration, Georgetown University. Arnott, R., Wagner, W., 1990. The measurement and control of trading costs. Financial Analyst Journal 46, 73—80. Barclay, M., Litzenberger, R., 1988. Announcement effects of new equity issues and the use of intraday price data. Journal of Financial Economics 21, 71—100.
48
D. Bertsimas, A.W. Lo/Journal of Financial Markets 1 (1998) 1—50
Barclay, M., Warner, J., 1993. Stealth trading and volatility: which trades move prices? Journal of Financial Economics 34, 281—306. Bensaid, B., Lesne, J., Pages, H., Scheinkman, J., 1992. Derivative asset pricing with transaction costs. Mathematical Finance 2, 63—86. Berkowitz, S., Logue, D., Noser, E. Jr., 1988. The total cost of transactions on the NYSE. Journal of Finance 43, 97—112. Bernhardt, D., Hughson, E., 1994. Splitting orders. Working Paper, Department of Economics, Queen’s University. Bertsekas, D., 1995. Dynamic programming and optimal control, vol. I. Athena Scientific, Belmont, MA. Bertsimas, D., Lo, A., 1998. A static optimization alternative to dynamic programming with constraints. Working paper, Sloan School of Management, MIT. Bertsimas, D., Hummel, P., Lo, A., 1998. An empirical analysis of best execution. Working paper, Sloan School of Management, MIT. Birinyi, L., 1995. What does institutional trading cost?. Birinyi Associates, Greenwich, CT. Bodurtha, S., Quinn, T., 1990. Does patient program trading really pay? Financial Analysts Journal 46, 35—42. Boyle, P., Vorst, T., 1992. Option replication in discrete time with transaction costs. Journal of Finance 47, 271—294. Brennan, M., Copeland, T., 1988. Stock splits, stock prices, and transaction costs. Journal of Financial Economics 22, 83—101. Brinson, G., Hood, R., Beebower, G., 1986. Determinants of portfolio performance. Financial Analysts Journal 42, 39—44. Brinson, G., Singer, B., Beebower, G., 1991. Determinants of portfolio performance II: an update. Financial Analysts Journal 47, 40—48. Chan, L., Lakonishok, J., 1993. Institutional trades and intra-day stock price behavior. Journal of Financial Economics 33, 173—199. Chan, L., Lakonishok, J., 1995. The behavior of stock prices around institutional trades. Journal of Finance 50, 1147—1174. Cohen, K., Maier, S., Schwartz, R., Whitcomb, D., 1981. Transaction costs, order placement strategy and existence of the bid—ask spread. Journal of Political Economy 89, 287—305. Collins, B., Fabozzi, F., 1991. A methodology for measuring transaction costs. Financial Analysts Journal 47, 27—36. Constantinides, G., 1986. Capital market equilibrium with transaction costs. Journal of Political Economy 94, 842—862. Cuneo, L., Wagner, W., 1975. Reducing the cost of stock trading. Financial Analysts Journal 26, 35—44. Davis, M., Norman, A., 1990. Portfolio selection with transactions costs. Mathematiacs of Operations Research 15, 676—713. Demsetz, H., 1968. The cost of transacting. Quarterly Journal of Economics 82, 33—53. Dumas, B., Luciano, E., 1991. An exact solution to a dynamic portfolio choice problem under transactions costs. Journal of Finance 46, 577—596. Easley, D., O’Hara, M., 1987. Price, trade size, and information in securities markets. Journal of Financial Economics 19, 69—90. Epps, T.W., 1976. The demand for brokers’ services: the relation between security trading volume and transaction cost. Bell Journal of Economics 7, 163—196. Foster, D., Viswanathan, S., 1990. A theory of the interday variations in volume, variance, and trading costs in securities markets. Review of Financial Studies 3, 593—624. Gammill, J., Perold, A., 1989. The changing character of stock market liquidity. Journal of Portfolio Management 15, 13—18. Garman, M., Ohlson, J., 1981. Valuation of risky assets in arbitrage-free economies with transactions costs. Journal of Financial Economics 9, 271—280.
D. Bertsimas, A.W. Lo/Journal of Financial Markets 1 (1998) 1—50
49
Glosten, L., Milgrom, P., 1985. Bid, ask and transaction prices in a specialist market with heterogeneously informed traders. Journal of Financial Economics 14, 71—100. Grossman, S., Miller, M., 1988. Liquidity and market structure. Journal of Finance 43, 617—633. Grossman, S., Vila, J., 1992. Optimal dynamic trading with leverage constraints. Journal of Financial and Quantitative Analysis 27, 151—168. Harris, L., 1994. Optimal dynamic order submission strategies in some stylized trading problems. Working Paper No. 94—8, School of Business Administration, University of Southern California. Harris, L., Hasbrouck, J., 1992. Market vs. limit orders: the superdot evidence on order submission strategy, NYSE working paper No. 92—02. Hasbrouck, J., Schwartz, R., 1988. Liquidity and execution costs in equity markets. Journal of Portfolio Management 14, 10—16. Hausman, J., Lo, A., MacKinlay, C., 1992. An ordered probit analysis of transaction stock prices. Journal of Financial Economics 31, 319—379. Heaton, J., Lucas, D., 1996. Evaluating the effets of incomplete markets on risk sharing and asset pricing. Journal of Political Economy 104, 443—487. Hodges, S., Neuberger, A., 1989. Optimal replication of contingent claims under transactions costs. Review of Futures Markets 8, 222—239. Holthausen, R., Leftwich, R., Mayers, D., 1987. The effect of large block transactions on security prices: a cross-sectional analysis. Journal of Financial Economics 19, 237—267. Holthausen, R., Leftwich, R., Mayers, D., 1990. Large block transactions, the speed of response, and temporary and permanent stock-price effects. Journal of Financial Economics 26, 71—95. Huang, R., Stoll, H., 1995. Dealer versus auction markets: a paired comparison of execution costs on NASDAQ and the NYSE, Working paper 95—16, Financial Markets Research Center, Owen Graduate School of Management, Vanderbilt University. Jarrow, R., 1992. Market manipulation, bubbles, corners, and short squeezes. Journal of Financial and Quantitative Analysis 27, 311—336. Keim, D., Madhavan, A., 1995a. The anatomy of the trading process. Journal of Financial Economics 37, 371—398. Keim, D., Madhavan, A., 1995b. The upstairs market for large-block transactions: analysis and measurement of price effects. Review of Financial Studies to appear. Keim, D., Madhavan, A., 1995c. Execution costs and investment performance: an empirical analysis of institutional equity trades, Working paper, School of Business Administration, University of Southern California. Kraus, A., Stoll, H., 1972. Price impacts of block trading on the New York stock exchange. Journal of Finance 27, 569—588. Kumar, P., Seppi, D., 1993. Limit and market orders with optimizing traders. Working paper, Graduate School of Industrial Administration, Carnegie-Mellon University. Kyle, A., 1985. Continuous auctions and insider trading. Econometrica 53, 1315—1336. Kyle, A., 1989. Informed speculation with imperfect competition. Review of Economic Studies 56, 317—356. Leinweber, D., 1993. Using information from trading in trading and portfolio management. In: Sherrerd, K. (Ed.), Execution Techniques, True Trading Costs, and the Microstructure of Markets. Association for Investment Management and Research, Charlottesville, VA. Leinweber, D., 1994. Careful structuring reins in transaction costs. Pensions and Investments July 25, 19. Leland, H., 1985. Option pricing and replication with transactions costs. Journal of Finance 40, 1283—1301. Litzenberger, R., Rolfo, J., 1984. Arbitrage pricing, transaction costs and taxation of capital gains: a study of government bonds with the same maturity date. Journal of Financial Economics 13, 337—351.
50
D. Bertsimas, A.W. Lo/Journal of Financial Markets 1 (1998) 1—50
Lo, A., MacKinlay, C., 1990. When are contrarian profits due to stock market overreaction? Review of Financial Studies 3, 175—206. Lo, A., MacKinlay, C., Zhang, J., 1998. Econometric models of limit-order executions, MIT Laboratory for Financial Engineering working paper No. LFE-1031-97. Loeb, T., 1983. Trading cost: the critical link between investment information and results. Financial Analysts Journal 39, 39—44. Macey, J., O’Hara, M., 1996. The law and economics of best execution. Working Paper, Cornell University, unpublished. Magill, M., Constantinides, G., 1976. Portfolio selection with transactions costs. Journal of Economic Theory 13, 245—263. Merton, R., 1969. Lifetime portfolio selection under uncertainty: the continuous-time case. Review of Economics and Statistics 51, 247—257. New York Stock Exchange Fact Book: 1994 Data, New York Stock Exchange, April 1995. Niehans, J., 1987. Transaction costs. In J. Eatwell, M. Milgate, and Newman, P. (Eds.), The New Palgrave: A dictionary of economics. The MacMillan Press, London, U.K. Pe´rold, A., 1988. The implementation shortfall: paper versus reality. Journal of Portfolio Management 14, 4—9. Samuelson, P., 1969. Lifetime portfolio selection by dynamic stochastic programming. Review of Economics and Statistics 51, 239—246. Schwartz, R., Whitcomb, D., 1988. Transaction costs and institutional investor trading strategies. Monograph Series in Finance and Economics 1988—2/3, Salomon Brothers Center for the Study of Financial Institutions, New York University, New York. Sherrerd, K. (Ed.), 1993. Execution techniques, true trading costs, and the microstructure of markets. Association for Investment Management and Research, Charlottesville, VA. Shleifer, A., 1986. Do demand curves for stocks slope down? Journal of Finance 41, 579—590. Stoll, H., 1989. Inferring the components of the bid—ask spread: theory and empirical tests. Journal of Finance 44, 115—134. Stoll, H., 1993. Equity trading costs. Association for Investment Management and Research, Charlottesville, VA. Tinic7 , S., 1972. The economics of liquidity services. Quarterly Journal of Economics 86, 79—93. Treynor, J., 1981. What does it take to win the trading game? Financial Analysts Journal 37, 55—60. Tuckman, B., Vila, J., 1992. Arbitrage with holding costs: a utility-based approach. Journal of Finance 47, 1283—1302. Turnbull, A., White, R., 1995. Trade type and the costs of making markets. Working Paper, Western Business School University of Western Ontario. Vayanos, D., 1992. A dynamic model of an imperfectly competitive bid—ask market. Unpublished working paper. Vayanos, D., 1995. Transaction costs and asset prices: a dynamic equilibrium model. Working paper, Graduate School of Business, Stanford University. Vayanos, D., Vila, J., 1995. Equilibrium interest rate and liquidity premium under proportional transaction costs. Working paper, Graduate School of Business, Stanford University. Vila, J., 1989. Simple games of market manipulation. Economics Letters 29, 21—26. Wagner, W., 1993. Defining and measuring trading costs. In Sherrerd, K. (ed.), Execution Techniques, True Trading Costs, and the Microstructure of Markets. Association for Investment Management and Research, Charlottesville, VA. Wagner, W., Banks, M., 1992. Increasing portfolio effectiveness via transaction cost management. Journal of Portfolio Management 19, 6—11. Wagner, W., Edwards, M., 1993. Best execution. Financial Analyst Journal 49, 65—71.