Abstract: This paper presents a method for optimal location of STATCOM in IEEE-14 bus system. In this paper, our aim would be finding optimal placement of ...
International Journal of Science and Research (IJSR) ISSN (Online): 2319-7064 Index Copernicus Value (2013): 6.14 | Impact Factor (2013): 4.438
Optimal Location of Statom Using Particle Swarm Optimization in IEEE-14 Bus System to Improve Voltage Profile & THD Reduction Noopur Sahu1, Ankit Dubey2 1, 2
Disha Institute of Management & Technology, Raipur, Chhattisgarh, India
Abstract: This paper presents a method for optimal location of STATCOM in IEEE-14 bus system. In this paper, our aim would be finding optimal placement of STATCOM for voltage profile improvement, loss reduction, and THD (Total Harmonic Distortion) reduction in distribution & transmission networks. Particle Swarm Optimization (PSO) is used as the solving tool, where the problem is defined and the objective function is introduced. Taking into account the fitness values sensitivity in PSO algorithm process, it is desired to apply harmonic and load flow calculations for decision-making. Results show that the PSO is able to give the superlative solution with statistical significance and a great degree of convergence. A thorough description of the method, results, conclusions and future scopes are also presented.
Keywords: Optimal location, Particle swarm optimization, STATCOM (static compensator), total harmonic distortion.
1. Introduction Transmission lines consume a considerable amount of power. The necessity of power and its dependency has grown exponentially over the years. The void between limited production and tremendous demand has increased the focus on minimizing power losses. The losses like transmission loss range from the conjecture factors like physical or environmental losses to severe technical losses. The primary factors like reactive power and voltage deviation are significant in stretched conditions and long range transmission lines of powers. The short and medium range of transmission lines accounts for micro-static values of power loss but the transmission losses of vulnerable size are witnessed in long transmission range of more than 100 kilometers. The subject of power transmission has always been an interest of researchers. A numerous methods have been developed to maximize the throughput of the systems. The controlling devices such as synchronous condensers, generators, reactors, tap changing transformers are used to minimize the losses. FACTS technologies offer competitive solutions to today‟s power systems in terms of increased power flow transfer ability, enhancing constant control over the voltage profile, minimizing losses, improving damping capacity, etc. In this paper we have incorporated Static Synchronous Compensator (STATCOM) as the FACTS device to control the power loss in transmission lines. To optimize the device we forwarded our study to the optimization of STATCOM device by Particle Swarm Optimization. The model is structured in MATLAB and the performance comparison is presented in results. Heuristic methods represent the wide range of computable global optimization techniques that employs novel approaches for intelligent search of optimal values. These have common characteristics of natural evolution, physical processes and stochastic events.
Power systems components mainly consist of generators, transformers, switches, transmission lines,loads, active and passive compensators etc. Power system networks are complex systems that are non-stationary, nonlinear, and prone to instability, disturbance and faults. Strengthening of a power system can be accomplished by improving the voltage profile,enhancing the transmission capacity and others. Nevertheless, some of these solutions may require considerable investment that could be difficult to recover. Flexible AC Transmission System (FACTS) devices are an alternate solution to address some of those problems. Simple heuristic tactics are traditionally applied for determining the location of FACTS devices in a small power system. However, more scientific methods are required for placing and sizing FACTS devices in a larger power network. FACTS sizing and distribution constitutes a breakthrough problem in power systems due to multiple local minima and the overwhelming computational effort. Nowadays, many Evolutionary Computation Techniques have been developed to determine the optimal placement of FACTS devices with promising results. Different algorithms such as Genetic Algorithms (GA) and Evolutionary Programming have been tried for finding the optimal allocation as well as the types of devices and their sizes. Particle Swarm Optimization (PSO) is another evolutionary computation technique that can be used to solve the FACTS sizing and allocation problem. It has been applied to other power engineering problems such as: economic dispatch, generation expansion problem short term load forecasting and others, giving better results than classical methods and with less computational effort. In addition, it has been shown recently that the application of PSO is suitable in principle to optimally place FACTS devices in a multi machine power system to find out where the loss reduction and total harmonics distortion is minimum. The main goal of this paper is to show the application of PSO for the optimal allocation of a Static Compensator
Paper ID: SUB152558
Volume 4 Issue 3, March 2015 www.ijsr.net Licensed Under Creative Commons Attribution CC BY
2595
International Journal of Science and Research (IJSR) ISSN (Online): 2319-7064 Index Copernicus Value (2013): 6.14 | Impact Factor (2013): 4.438 (STATCOM), shunt FACTS device, in a power system. The criterion used in finding the best solution is to optimize the power flow of the .An IEEE-14 bus system work is used as an example to the methodology. In addition, the reduction in THD after using the PSO technique is also studied.
space. The particles change its order or condition according to the following three principles: (1) To keep its inertia (2) to change the condition according to its most optimist position (3) to change the condition according to the swarm‟s most optimist position.
2. Particle Swarm Optimization Particle swarm optimization (abbreviated as PSO) is a population based stochastic optimization technique given by Dr.Eberhart and Dr. Kennedy in 1995, encouraged by social behaviour of bird flocking or fish schooling. This algorithm originally intends to graphically simulate the graceful and irregular choreography of a bird folk. Each entity within the swarm is represented by a vector in multidimensional search space. This vector has also one assigned vector which determines the next movement of the particle and is called the velocity vector. The PSO algorithm also gives the technique about how to update the velocity of a particle. It is based on the natural process of group communication to share individual knowledge when a group of birds or insects search food or migrate and so forth in a searching space, although all particles do not know where the best position is. But from the nature of their group activities or social behaviour, if any member can find out a desirable path to go, the rest of the particle members will follow quickly. The PSO algorithm is basically designed from animal‟s activity or behaviour to solve optimization problems. In PSO, each element or member of the population is called a „particle‟ and the population is called a „swarm‟. Starting with a randomly initialized population and moving in randomly chosen directions, each particle goes through the searching space and remembers the best previous positions of itself and its neighbours. Particles of a swarm communicate good positions to each other as well as dynamically adjust their own position and velocity derived from the best position of all particles. The next stride begins when all particles have been moved. Finally, all particles tend to move towards better and better positions over the searching process until the swarm move to close to an optimum of the fitness function f: Rn→R. The PSO was originally developed for real valued spaces but many problems are, however, defined for separate or distinct valued spaces where the domain of the variables is finite. The PSO process is based on iteration a fixed number of times or until a minimum error based on desired performance index is achieved. The most optimist solution can be worked out in particle swarm optimization algorithm by the assistance of each individual. The particle without volume and quality serves as each individual, and the simple behavioural pattern is regulated for each particle to show the complexity of the whole particle swarm. This algorithm can be implement to carry out the complex optimist problems.
3. Particle Swarm Optimization Algorithm In the basic particle swarm optimization algorithm, particle swarm consists of “n” particles, and the position of each particle stands for the probable solution in D-dimensional
Paper ID: SUB152558
The position of each particle in the swarm is exaggerated both by the most optimist position during its movement (individual experience) and the position of the most optimist particle in its surrounding (near experience). When the entire particle swarm is surrounding the particle, the most idealist position of the surrounding is equal to the one of the whole most optimist particle; this algorithm is called the whole PSO. If the constricted surrounding is used in the algorithm, then it is called as partial PSO. Each particle can be represented by its current speed and position, the most optimal position of each individual and the most optimist position of the surrounding. In the partial PSO, the speed and location of each particle vary according the following equality: + (
and stand for separately the speed of In this equality, the particle “i” at its “k” times and the d-dimension quantity of its position; represents the d-dimension quantity of the individual “i” at its most optimist positional its “k” times. is the d-dimension quantity of the swarm at its most optimist position. In order to evade particle being far away from the searching space, the speed of the particle fashioned at its each direction is limited between , and . If the number of is too big, the solution is far-off from the best, if the number of is too small, the solution will be the local optimism; and represent the speeding figure, regulating the length when flying to the most particle of the whole crowd and to the most optimist individual particle. If the figure is too small, the particle is probably far away from the objective field, if the figure is too big; the particle will may be go to the target field suddenly or fly beyond the target field. The proper figures for and can control the speed of the particle‟s flying and the solution will not be the partial optimism. Usually, is equal to and they are equal to 2; and symbolize random fiction, and 0-1 is an arbitrary number.
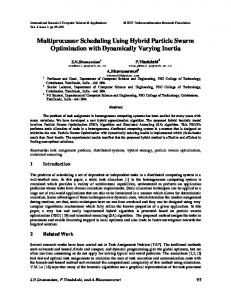
4. Static Synchronous Compensator (STATCOM) A static synchronous compensator (STATCOM), also known as a “static synchronous condenser” (“STATCON”), is a regulating device used on alternating current electricity transmission network system. It is normally based on a power electronics voltage-source converter and can act as either a source or sink of reactive AC power to an electrical network. If connected to a source of power it can also give active AC power. It is a member of the FACTS family of devices, that is connected in shunt with power system. The STATCOM consists of a solid state voltage source converter with GTO thyristor switches or other high performance of semi-conductor and transformer. The elementary principle of
Volume 4 Issue 3, March 2015 www.ijsr.net Licensed Under Creative Commons Attribution CC BY
2596
International Journal of Science and Research (IJSR) ISSN (Online): 2319-7064 Index Copernicus Value (2013): 6.14 | Impact Factor (2013): 4.438 a STATCOM installed in a power system is the production ac voltage source by a voltage source inverter (VSI) connected to a dc capacitor. The transfer of active and reactive power between the power system and the STATCOM is caused by the voltage difference across the reactance. The STATCOM can also improve transient stability, damping low frequency oscillation, and increasing transmission capacity. The STATCOM is represented by a voltage source, which is connected to the system via a coupling transformer. The source voltage is in phase with the ac system voltage at the point of connection, and the magnitude of the voltage is controllable. The current from the source is restricted to a maximum value by adjusting the voltage. The concept of STATCOM was proposed by Gyugyi in 1976. Power Converter employed in the STATCOM mainly of two types i.e. is Voltage Source Converter and Current Source Converter. In Current source Converter direct current always has one polarity and the power reversal takes place through reversal of dc voltage polarity while In Voltage Source Converter dc voltage always has one polarity, and the power reversal takes place through reversal of dc current polarity. The power semiconductor devices used in current source converter requires bidirectional voltage blocking capability and for achieving this Characteristic an additional diode must be connected in series with a semiconductor switch which increased the system cost and its becomes costlier as compared to voltage source converter moreover Voltage source converter can operate on higher efficiency in high power applications. Because of the above reasons Voltage source converter is Preferred over Current source converter and now these days it act as a basic electronic block of a STATCOM that converts a dc voltage at its input terminals into a three-phase set of ac voltages at fundamental frequency with controllable magnitude and phase angle. Basically an ac voltage can be generated from a dc voltage from a voltage-sourced converter based STATCOM. With a voltage sourced converter, the frequency, the phase angle and the magnitude of the output voltage can be controlled. The main principle of generation of reactive power by a voltage-sourced converter is akin to that of the conventional rotating synchronous machine. From a dc input voltage source, the converter produces a set of controllable threephase output voltages provided by the charged capacitor Cs with the system frequency of the ac power system.
Figure 4.2: V-I Characteristics of STATCOM
5. IEEE 14 Bus System IEEE 14 bus system is used to test the power flow analysis without and with STATCOM. The IEEE14 bus test system is shown in Figure 5.1.
Figure 5.1: Single line diagram of IEEE-14 Bus system Here, the STATCOM is connected randomly at different buses. The voltage of all buses is heavily affected for the increasing load. The STATCOM is randomly connected and power flow losses for various buses are calculated to improve the voltage profile and also compensate the reactive power of whole system. Initially the 14 bus system is tested without STATCOM. The approach can be taken into account for the unbalances of both network and load in 14 bus system. Now the loads of the other buses are considered and overall power generation is varied with increasing percentage from 40% to 100%. IEEE 14 bus system is now used to test the load flow analysis without and with STATCOM. For this analysis, the STATCOM is connected randomly in different buses there by verifying the real and reactive power variation. Table 1: Lines Data Sending Receiving end Bus end bus
Figure 4.1: A single-line diagram of var generator by rotating a voltage-sourced switching converter.
Paper ID: SUB152558
1 2 2
2 3 4
R (p.u.)
X(p.u)
0.01938 0.05917 0.04699 0.19797 0.05811 0.17632
Volume 4 Issue 3, March 2015 www.ijsr.net Licensed Under Creative Commons Attribution CC BY
Half χ(p.u)
Xmer tap
0.0264 0.0219 0.0187
1 1 1
2597
International Journal of Science and Research (IJSR) ISSN (Online): 2319-7064 Index Copernicus Value (2013): 6.14 | Impact Factor (2013): 4.438 1 2 3 4 5 4 7 4 7 9 6 6 6 9 10 12 13
5 5 4 5 6 7 8 9 9 10 11 12 13 14 11 13 14
0.05403 0.05695 0.06701 0.01335 0 0 0 0 0 0.03181 0.09498 0.12291 0.06615 0.12711 0.08205 0.22092 0.17093
0.22304 0.17388 0.17103 0.04211 0.25202 0.20912 0.17615 0.55618 0.11001 0.0845 0.1989 0.25581 0.13027 0.27038 0.19207 0.19988 0.34802
0.0246 0.017 0.0173 0.0064 0 0 0 0 0 0 0 0 0 0 0 0 0
1 1 1 1 0.93 0.97 1 0.96 1 1 1 1 1 1 1 1 1
Load
Table 6.1(a): Result Comparison
No STATCOM STATCOM without PSO STATCOM with PSO
Table 2: Bus Data Bus Bus V/g No. Code Magnitude
Figure 6.1: PSO Convergence Graph for STATCOM position [1 2 9]
Generator
Active Power Loss (MW) 29.3 28.1 23.3
Reactive THD Power Loss (%) (MVAR) 99.4 1.73 98.2 1.7 96.3 1.58
MW MVAR MW MVAR Qmin Qmax 1 2 3 4 5 6 7 8 9 10 11 12 13 14
1 2 2 0 0 2 0 2 0 0 0 0 0 0
1.06 1.045 1.01 1 1 1.07 1 1.09 1 1 1 1 1 1
30.38 0 131.88 66.92 10.64 15.68 0 0 41.3 12.6 4.9 8.54 18.9 20.86
17.78 0 26.6 10 2.24 10.5 0 0 23.24 8.12 2.52 2.24 8.12 7
40 232 0 0 0 0 0 0 0 0 0 0 0 0
-40 0 0 0 0 0 0 0 0 0 0 0 0 0
0 -40 0 0 0 -6 0 -6 0 0 0 0 0 0
0 50 40 0 0 24 0 24 0 0 0 0 0 0
** Angle degrees for all the buses in 14 Bus system is 0º and injected MVAR too is 0.
6. Simulation Results Simulation process has been done using MATLAB in which inputs are the IEEE 14 Bus Data standard values. Parameters chosen for the Particle Swarm Optimization process are: C1 = 1.494 C2 = 1.494 N =25 W = 0.8 Stall = 0 Maximum Iterations = 1000
1) Below table shows the desired result for STATCOM position [1 2 9]. 2) For this position, the optimal placement of STATCOM is given [5 2 11] by PSO method. 3) P_loss1 =29.2777,Q_loss1 = 99.4127 & THD1 =1.7319 are Active Power loss. Reactive Power loss & THD when the system is not connected with STATCOM. 4) P_loss2 = 28.1255, Q_loss2 = 98.2783 & THD2 = 1.8431 are Active Power loss, Reactive Power Loss & THD when system is connected with STATCOM. 5) P_loss3= 23.3492 Q_loss3= 96.2907 & THD3 =1.5837 are Active Power loss, Reactive Power loss and THD with reduced value when system is connected with STATCOM after implementation of PARTICLE SWARM OPTIMIZATION. Table 6.1(b): Result for STATCOM position [1 2 9] Name P_loss1(MW) P_loss2(MW) P_loss3(MW) Q_loss1(MVAR) Q_loss2(MVAR) Q-loss3(MVAR) Loss Stat_pos THD1(%) THD2(%) THD3(%)
Value 29.2777 28.1255 23.3492 99.4127 98.2783 96.2907 119.639 [5 2 11] 1.7319 1.8431 1.5837
Min 29.2777 28.1255 23.3492 99.4127 98.2783 96.2907 119.639 2 1.7319 1.8431 1.5837
Max 29.2777 28.1255 23.3492 99.4127 98.2783 96.2907 119.639 11 1.7319 1.8431 1.5837
For Position [1 4 9] of STATCOM in bus system:
The PSO algorithm has been tested for four different cases of STATCOM placement in IEEE 14 Bus System. The following graphs and tables for each case have been shown below: For Position [1 2 9] of STATCOM in bus system:
Figure 6.2: PSO Convergence Graph for STATCOM position [1 4 9]
Paper ID: SUB152558
Volume 4 Issue 3, March 2015 www.ijsr.net Licensed Under Creative Commons Attribution CC BY
2598
International Journal of Science and Research (IJSR) ISSN (Online): 2319-7064 Index Copernicus Value (2013): 6.14 | Impact Factor (2013): 4.438 Table 6.2(a): Result Comparison Active Reactive THD Power Loss Power Loss (%) (MW) (MVAR) 29.3 99.4 1.73
No STATCOM STATCOM without PSO
28.7
99
1.84
STATCOM with PSO
23.3
96.3
1.58
Table 6.2(b): Result for STATCOM position [1 4 9] Name P_loss1(MW) P_loss2(MW) P_loss3(MW) Q_loss1(MVAR) Q_loss2(MVAR) Q-loss3(MVAR) Loss Stat_pos THD1(%) THD2(%) THD3(%)
Value 29.2777 28.7255 23.3492 99.4127 99.0600 96.2907 119.639 [5 2 14] 1.7319 1.8431 1.5837
Min 29.2777 28.7255 23.3492 99.4127 99.0600 96.2907 119.639 2 1.7319 1.8431 1.5837
Max 29.2777 28.7255 23.3492 99.4127 99.0600 96.2907 119.6399 14 1.7319 1.8431 1.5837
1) Above table shows the desired result for STATCOM position [1 4 9]. 2) For this position, the optimal placement of STATCOM is given [5 2 14] by PSO method. 3) P_loss1 =29.2777, Q_loss1 = 99.4127 & THD1 =1.7319 are Active Power loss .Reactive Power loss & THD when the system is not connected with STATCOM. 4) P_loss2 = 28.7255, Q_loss2 = 99.0600 & THD2 = 1.8431 are Active Power loss, Reactive Power Loss & THD when system is connected with STATCOM. 5) P_loss3= 23.3492 Q_loss3= 96.2907 & THD3 =1.5837 are Active Power loss, Reactive Power loss and THD with reduced value when system is connected with STATCOM after implementation of PARTICLE SWARM OPTIMIZATION.
P_loss2(MW) P_loss3(MW) Q_loss1(MVAR) Q_loss2(MVAR) Q-loss3(MVAR) Loss Stat_pos THD1(%) THD2(%) THD3(%)
29.6235 23.3492 99.4127 99.5134 96.2907 119.6399 [14 2 11] 1.7319 1.7321 1.5837
29.6235 23.3492 99.4127 99.5134 96.2907 119.639 2 1.7319 1.7321 1.5837
29.6235 23.3492 99.4127 99.5134 96.2907 119.6399 14 1.7319 1.7321 1.5837
1) Above table shows the desired result for STATCOM position [8 11 14]. 2) For this position, the optimal placement of STATCOM is given [14 2 11] by PSO method. 3) P_loss1 =29.2777 ,Q_loss1 = 99.4127 & THD1 =1.7319 are Active Power loss .Reactive Power loss & THD when the system is not connected with STATCOM. 4) P_loss2 =29.6235, Q_loss2 = 99.5134 & THD2 = 1.7321 are Active Power loss, Reactive Power Loss & THD when system is connected with STATCOM. 5) P_loss3= 23.3492 Q_loss3= 96.2907 & THD3 =1.5837 are Active Power loss, Reactive Power loss and THD with reduced value when system is connected with STATCOM after implementation of PARTICLE SWARM OPTIMIZATION. For Position [9 10 14] of STATCOM in bus system:
For Position [8 11 14] of STATCOM in bus system: Figure 6.4: PSO Convergence Graph for STATCOM position [9 10 14]
Table 6.4(a): Result Comparison No STATCOM STATCOM without PSO STATCOM with PSO
Figure 6.3: PSO Convergence Graph for STATCOM position [8 11 14] Table 6.3(a): Result Comparison Active Power Loss (MW) No STATCOM STATCOM without PSO STATCOM with PSO
29.3 29.6 23.3
Reactive Power Loss (MVAR) 99.4 99.5 96.3
THD (%) 1.73 1.74 1.58
Table 6.3(b): Result for STATCOM position [8 11 14] Name P_loss1(MW)
Value 29.2777
Paper ID: SUB152558
Min 29.2777
Max 29.2777
Active Power Reactive Power Loss (MW) Loss (MVAR) 29.3 99.4 29.2 98.8 23.3 96.3
THD 1.73 1.82 1.58
1) Below table shows the desired result for STATCOM position [9 10 14]. 2) For this position, the optimal placement of STATCOM is given [12 2 8] by PSO method. 3) P_loss1 =29.2777,Q_loss1 = 99.4127 & THD1 =1.7319 are Active Power loss .Reactive Power loss & THD when the system is not connected with STATCOM. 4) P_loss2 =29.2248, Q_loss2 = 98.8398 & THD2 = 1.8431 are Active Power loss, Reactive Power Loss & THD when system is connected with STATCOM. 5) P_loss3= 23.3492 Q_loss3= 96.2907 & THD3 =1.5837 are Active Power loss, Reactive Power loss and THD with reduced value when system is connected with
Volume 4 Issue 3, March 2015 www.ijsr.net Licensed Under Creative Commons Attribution CC BY
2599
International Journal of Science and Research (IJSR) ISSN (Online): 2319-7064 Index Copernicus Value (2013): 6.14 | Impact Factor (2013): 4.438 STATCOM after implementation SWARM OPTIMIZATION.
of
PARTICLE
The process will continue till the convergence is reached.
Table 6.4(b): Result for STATCOM position [9 10 14] Name P_loss1(MW) P_loss2(MW) P_loss3(MW) Q_loss1(MVAR) Q_loss2(MVAR) Q-loss3(MVAR) Loss Stat_pos THD1(%) THD2(%) THD3(%)
Value 29.2777 29.2248 23.3492 99.4127 98.8398 96.2907 119.6399 [12 2 8] 1.7319 1.8431 1.5837
Min 29.2777 29.2248 23.3492 99.4127 98.8398 96.2907 119.6399 2 1.7319 1.8431 1.5837
Max 29.2777 29.2248 23.3492 99.4127 98.8398 96.2907 119.6399 12 1.7319 1.8431 1.5837
For all the four different cases, we can say that: The above diagrams shows that after the initialization of the swarm, the position of the particles are randomly initialize within the feasible space. After that, the performance F of each particle is evaluated using its current position „x‟. It will undergo simultaneous comparison with its best performance. The first result shows the value of Active Power Loss, Reactive Power Loss and THD when IEEE 14 bus system is without STATCOM. The second result shows the losses values and THD when STATCOM is used. The final result gives the reduced value after the implementation of Particle Swarm Optimization Algorithm along with the optimal sitting of STATCOM in the bus system. P_loss1, Q_loss1 and THD1 are the variables for calculating the losses and THD in IEEE 14 bus system without STATCOM. P_loss2, Q_loss2 and THD2 are the variables used for calculating the losses and THD in the bus system with STATCOM where three STATCOMs has been placed randomly. P_loss3, Q_loss3 and THD3 are the variable used for losses and THD obtained after implementation of the proposed algorithm. This flow chart shows the whole process going through, after the implementation of PSO algorithm. In the first step all the input data of IEEE 14 bus system is considered including the bus data and the line data. All the constant parameters necessary for the PSO algorithm to be carried out is considered. After generating the initial values for the process, objective function value is calculated for each particle. In the next step, STATCOM are placed randomly in three buses altogether which calculate power losses for these random position. If harmonics is present it will go to next step where it will calculate THD % . After that the process will evaluate the fitness function of each value. After that it will update particles‟s position and velocity and the process will continue till it attains convergence. The process will compare in the performance of each particle to the global best particle. Hence the condition will arise such as: F(Pbest) = F(x) , Pbest = x and F(Pgbest) = F(x) , Pgbest = x Paper ID: SUB152558
Figure 6.5: Flow Chart of Particle Swarm Optimization Process calculating Losses & THD
7. Conclusion & Future Scope The rapid growth of high power electronics industry has made Flexible AC Transmission System (FACTS) devices feasible and attractive for utility applications .Flexible AC Transmission Systems (FACTS), besides the underlying concept of independent control of active and reactive power flows, are an efficient solution to the reactive power control problem and voltage in transmission and distribution systems, offering an attractive alternative for achieving such objectives. Electric power Quality problem mainly include unbalancing of voltage, harmonics, performance and its compensation does not depend upon common coupling voltage. Therefore, STATCOM is very viable and effective during the power system disturbances. Moreover, much research confirms several advantages of STATCOM. PSO is an efficient modern heuristic algorithm to solve non convex and complex problems. Its ability of better convergence is
Volume 4 Issue 3, March 2015 www.ijsr.net Licensed Under Creative Commons Attribution CC BY
2600
International Journal of Science and Research (IJSR) ISSN (Online): 2319-7064 Index Copernicus Value (2013): 6.14 | Impact Factor (2013): 4.438 used to find the location of STATCOM In the context of our research for the minimization of Transmission Power Losses by the application of FACTS devices, a comparison is made in the proposed approach. Particle Swarm Optimization is used to optimize the location of STATCOM using the IEEE 14 Bus model. It has been observed that after the implementation of Particle Swarm Optimization Algorithm in the test system, there is reduction in active and reactive power loss and total harmonics distortion, by finding the optimal sitting of STATCOM.
References [1] P. K. Roy , S. P. Ghoshal , S. S. Thakur, “Optimal VAR Control for Improvements in Voltage Profiles and for Real Power Loss Minimization using Biogeography Based Optimization”, Electrical Power and Energy Systems, Vol. 43, No.1, pp. 830–838, December 2012. [2] Abbas Rabiee, Maziar Vanouni, Mostafa Parniani, “Optimal Reactive Power Dispatch for Improving Voltage Stability Margin Using a Local Voltage Stability Index”, Energy Conversion and Management, Vol. 59, pp. 66-73, July 2012. [3] Kursat Ayan, Ulas kilic, “Artificial Bee Colony Algorithm Solution for Optimal Reactive Power Flow”, Applied Soft Computing, Vol.12, No. 5, pp. 1477–1482, May 2012. [4] M. Varadarajan, K. S. Swarup, “Differential Evolutionary Algorithm for Optimal Reactive Power Dispatch, Electrical Power & Energy Systems, Vol. 30, No. 8, pp. 435–441, October 2008. [5] http://electrical-engineering-portal.com/total-losses-inpower-distribution-and-transmission-lines-1 [6] IEEE Committee Report, “Readers Guide to Subsynchronous Resonance”, IEEE Trans. On Power System, Vol. 7, No. 1, pp. 150-157, Feb 1992. [7] IEEE Committee Report, “First Benchmark Model for Computer Simulation of Sub-synchronous Resonance”, IEEE Trans. On Power Apparatus and System, vol. 96, no. 5, pp. 1565-1572, Sept/Oct. 1977. [8] Safari, H. Shayeghi, H. A. Shayanfar, “Optimization Based Control Coordination of STATCOM and PSS Output Feedback Damping Controller Using PSO Technique”, International Journal on Technical and Physical Problems of Engineering (IJTPE), Issue 5, Vol. 2, No. 4, pp. 6-12, December 2010. [9] C.Schaduer and H. Mehta, “Vector analysis and control of advanced static var compensator,” IEEE Proceedings on generation, transmission and distribution, Vol 140, No 4, PP: 299-306, July 1993. [10] Laszlo Gyugi, “Dynamic compensation of AC transmission line by solid state synchronous voltage sources,” IEEE transaction on power delivery, Vol. 9, No 2, pp: 904-911, April 1994. [11] Ahmed A.A. Esmin, Germano Lambert-Torres, “Application of Particle Swarm Optimization to Optimal Power Flow”, International Journal of Innovative Computing, Information & Control ,Vol.8,No.3(A),March 2012. [12] Puli.Venkata Kishore, S.Rama Reddy,P.V.Kishore, “Modelling & Simulation of IEEE 14 bus System with
Paper ID: SUB152558
D-STATCOM for Power Quality Improvement, Indian T.Sci,Res 3(1),2012 [13] Vishnu J, Rishi Menon, Tibin Joseph, Sasidharan Sreedharan, Vipindas P,Sebin Joseph,Chittesh V C, “Maximum Loadability Assesment of IEEE 14 Bus System by using FACTS Devices incorporating Stability Constraints” ,Pro.of 2nd IRF International Conference, 10th Aug.2014. [14] G.H.Hwang, K.B.Ching, M.Z.Ssamsuddin, „Economic Dispatch Studies for IEEE 14 Bus Distribution”, 3rd International Power Engineering & Optimization Conference,Malaysia,3-4 June,2009. [15] S.Uma Mageswaran, Dr.N.O.Guna Sekhar, “Reactive Power Contribution of Multiple STATCOM using PSO”,IJET,Vol.5,No.1,Feb-March 2013. [16] Y.Del Vallle, J.C.Harnandez, G.K.Venayagamoorthy,R.C.Harley, “Multiple STATCOM Allocation & Sizing Using PSO,IEEE 2006. [17] Y.Alinejad, M.Sedighizadeh,M.Sagidhi, “A Particle Swarm Optimization for Sitting & Sizing of Distributed Generation in Distributed Network to ImproveVoltage Profile, Reduce THD & Losses, IEEE 2007 [18] James Kennedy, Russell Eberhart, “Particle Swarm Optimization”, IEEE 1995.
Author Profile Noopur Sahu received the B.E. degree from Chhattisgarh Swami Vivekanand Technical University (Bhilai), Chhattisgarh in 2011 and pursuing M.tech degree in Electrical and Electronics Engineering from Disha Institute Of Management & Technology (Raipur), India. I am doing my M. Tech project under Mr. Ankit Dubey, Assistant Professor in EEE department, Disha Institute Of Management & Technology (Raipur). Presently I am working as a Lecturer in Electrical and Electronics Engineering department in Disha Institute Of Management and Technology, Raipur, (C.G). Her research interests include Neural Network, Analysis and Design Of Algorithms. Ankit Dubey is an Assistant Professor Electrical and Electronics Engineering Department, in Disha Institute Of Management &Technology, Raipur, (C.G.) . His research interests include Soft computing Neural Network, Algorithms Designing.
Volume 4 Issue 3, March 2015 www.ijsr.net Licensed Under Creative Commons Attribution CC BY
2601