Two further challenges in planning are that price reductions lead to ..... In addition to considering cash ow, our model includes a terminal value function.
Optimal Planning for Optical Transport Networks B y Steven G. Lanning, Debasis Mitra, Qiong Wang, and Margaret H. Wright
Bell Laboratories, Lucent Technologies, 600 Mountain Avenue, Murray Hill, NJ, USA
In optical transport networks, recent development of new technologies has led to highly accelerated (\disruptive") increases in the capacity associated with a given investment cost. As a result, there have been dramatic decreases in the cost per unit of transport. We describe a nonlinear mixed-integer planning model that assumes both the continuous emergence of new systems and a constant-elasticity demand function. Optimization of the model with respect to price and technology acquisitions over time suggests that, with high elasticity and steeply dropping technology costs, a carrier will maximize net present value by frequently deploying new systems. This conclusion is in sharp contrast to the analogous results for voice networks, where demand is much less elastic and the rate of technology change is much slower. Keywords: optical transport networks, network planning, optimization, economic modeling
1. Introduction
Planning for future network expansion is a complex problem for communications carriers today. Rapid technology innovations are constantly changing the costs of network expansion; not only are existing systems decreasing in price every year, but more advanced systems are introduced at frequent intervals. With a modest increase in investment costs, the newer systems provide capacity that is orders of magnitude larger than in earlier systems, thus dramatically reducing the cost per unit of capacity. These cost trends create a major tradeo� in making network deployment decisions: rapid deployment of current systems allows a carrier to collect revenue in the short term, but may rule out future opportunities to exploit cost savings. Two further challenges in planning are that price reductions lead to nonlinear increases in demand, and that past, current, and future deployment decisions are highly interdependent. All of these connections generate a labyrinth of alternatives that need to be evaluated to make good planning decisions. We examine these issues through a model that optimizes net present value over time for a carrier in long-haul transport networks, where innovations are currently driven primarily by the development of SONET ring and Wavelength Division Multiplexing (WDM) technologies. An important element in our model is its inclusion of the relationship between price and demand. If there is a highly elastic response of demand to price, the carrier's best strategy is to reduce price as technological Article submitted to Royal Society
TEX Paper
2 S. Lanning, D. Mitra, Q. Wang, and M. Wright progress provides larger and more cost-e�ective systems, in order to increase revenue. The more elastic is demand, the greater is the increase in revenue that results from price reductions a�orded by falling unit costs. These revenue opportunities in uence the carrier's incentive to invest in more capacity. Because of these interdependencies, we believe that the carrier's strategy should not be based on demand that is speci ed externally, but rather should be a coupled optimization of prices and capacity acquisition over time. Assuming what we believe to be reasonable demand elasticity, our conclusion is that carriers will maximize net present value by frequent network expansion. This paper is organized as follows. Section 2 discusses current technologies in optical transport networks, Section 3 describes and justi es a constant-elasticity demand curve, Section 4 presents our model, Section 5 analyzes results, and Section 6 summarizes conclusions and discusses directions for future work.
2. Optical Ring Transport Network Technologies
Optical transport networks are designed to carry communications tra�c between cities typically separated by hundreds or even thousands of miles. Cities are connected by ber cables into a ring architecture, and an optical transmission system is deployed at each city on that ring. Ampli ers and regenerators are needed along each ber route connecting adjacent cities, where the equipment spacing depends on the technology. Because the signal is transmitted along the ber in Synchronous Optical Network (SONET) format (Stern & Bala 1999), a connected ring of optical transmission systems is usually called a SONET ring. There are two major types of SONET rings: unidirectional path-switched rings (UPSR) and bidirectional line-switched rings (BLSR). With UPSR, transmission systems are connected by two bers, one each for clockwise and counterclockwise transmissions. With complete redundancy, the ring capacity of a UPSR system should equal the sum of tra�c between all city pairs. With BLSR, transmission systems are connected by four bers, two that transmit along clockwise and counterclockwise directions as with UPSR, and two that serve as backup. Although a BLSR system is more expensive because it requires more sophisticated add-drop multiplexers (ADMs) as well as an additional ber pair, it can carry more tra�c than UPSR by intelligent assignment of tra�c on di�erent segments of the ring. With the exception of routing, planning processes are the same for both UPSR and BLSR; hence, for simplicity, discussion in this paper is based on UPSR. It was formerly customary to deploy a SONET ADM in each city for each ber. ADM systems transform electronic to optical signals, and transmit the signals onto the ber; they also intercept optical signals from the ber and transform them into electronic form. The capacity of a given ring is determined by the ADM rates de ned in the SONET standard, with OC-1, the base rate, de ned as 51.84 megabits per second. The most commonly used capacity today is OC-48, which is equivalent to 2.5 gigabits per second (Gbps). However, the adoption of OC-192 (10 Gbps) has begun, and OC-768 (40 Gbps) is on the horizon. In recent years, optical transport networks have been revolutionized by the advent of Wavelength Division Multiplexing (WDM) systems, which allow optical Article submitted to Royal Society
Optimal Planning for Optical Transport Networks 3 signals to be transmitted on di�erent wavelengths within one ber. As a result, rather than dedicating a ber pair to each individual ADM, multiple ADMs may be attached to one WDM terminal, and several WDM terminals at di�erent sites can be connected by a single ber pair. With WDM, there are dramatic savings in the costs of ber, ampli ers, and regenerators, which are a major component of the capital expense. In addition, the amount of tra�c that can be carried on a single ber pair is no longer restricted by the ADM transmission rate. Instead, the maximum capacity can reach the product of the ADM rate and the maximum number of wavelengths accommodated by WDM. For example, an ADM-only OC-48 SONET ring can provide at most 2.5 Gbps on a pair of bers, but a SONET ring equipped with a 40-wavelength WDM system can carry 100 Gbps.
3. Estimation of Demand
(a ) Formulation of the demand function Realistic planning in an environment of rapid gains in technology depends on an appropriate representation of the relationship between demand and price. However, it is not easy to characterize this relationship. Because the communications industry is experiencing an unprecedented transformation, past experience with the service market becomes less convincing as an indicator of future demand. The most well known example of this di�culty is usage of the Internet (Cerf 1998), whose growth in capacity has led to the creation of many previously unpro table applications, in turn creating more demand for capacity. The most optimistic extrapolations have consistently underpredicted the continuing expansion of the World Wide Web, and there is no indication of any change in this trend. Similarly, the famous \Moore's Law", which dominates thinking about the microprocessor and DRAM industries, is sometimes stated for the former as a doubling in speed every 18 months for the same price. However, what actually happens is not that the same chips are available 18 months later for half the price, but that di�erent chips, with twice the speed, are available at the same price. The availability of more computing speed thus generates not only an \upgrade" in available speed, but also new markets, since applications that were formerly impractical are enabled by the faster chips. The net e�ect is that the demand for chips more than doubles every 18 months, i.e., remains ahead of the growth in processor speed. To capture these properties in modeling demand for optical network capacity, we begin with the concept of elasticity. Let D denote demand and p denote price, where by assumption p > 0. The demand elasticity E associated with a time interval is de ned as the negative ratio of the relative change in demand and the relative change in price during that interval, i.e. � �D �
D E=? � �; (3.1) �p p where �D denotes the change in demand and �p denotes the change in price. In the (usual) situation when demand increases as price decreases, the value of E de ned Article submitted to Royal Society
4 S. Lanning, D. Mitra, Q. Wang, and M. Wright by (3.1) is positive. Rearrangement of (3.1) gives �D = ?E � �p �;
D
p
(3.2)
which reveals the implications of di�erent ranges for E . If E > 1, it follows from (3.2) that any relative reduction in price leads to a larger relative increase in demand, i.e., if price is reduced by 1% (�p=p = ?:01), then demand increases by more than 1%, i.e., �D=D > :01. If, on the other hand, E < 1, a price reduction of 1% leads to an increase in demand of less than 1%. Taking the limit of (3.1) as the interval of change becomes in nitesimal, we obtain � D0 �
D E = ? � p0 � : (3.3) p Assuming that revenue, denoted by R, is the product of price and demand, i.e., R = pD, di�erentiation and and manipulation of (3.3) give an expression for the relative change in revenue,
R0 = � E ? 1 � D0 = ?(E ? 1) p0 ; R E D p
(3.4)
which shows that: (i) If E > 1, a reduction in price leads to an increase in revenue|for example, if E = 1:5 and price is reduced by 2%, revenue increases by 1%. (ii) If E = 1, revenue is una�ected by any changes in price. (iii) If E < 1, a reduction in price leads to a reduction in revenue|for example, if E = 0:5 and price is reduced by 2%, revenue decreases by 1%. We formulate a demand function with constant elasticity by assuming that (3.3) holds with the same value of E for all p and D of interest. Solving the associated di�erential equation gives the general form
D = Ap?E :
(3.5)
The scaling constant A is equal to the value of D when p = 1, so that A can be interpreted as a demand potential. Based on the analysis following (3.4), we assume that E > 1. It follows from (3.5) that
D2 = � p1 �E ; so that E = ln (D2 =D1) : D1 p2 ln (p1 =p2)
(3.6)
Two points need to be made: there is empirical support for the constantelasticity form (3.5), and the demand for capacity in industries analogous to communications is well tted by a high-elasticity constant-elasticity form. Article submitted to Royal Society
Optimal Planning for Optical Transport Networks
1965
Demand for DRAM
1933
5
Demand for Electricity
1926
E = 1:5
E = 2:2
1992
1970
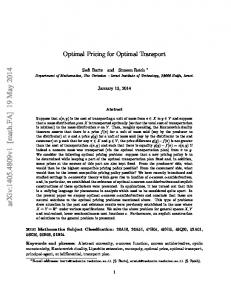
Figure 1. Demand for DRAM and electricity.
Figure 1 depicts constant-elasticity ts to historical data for demand, with log(units) on both axes: (1) in DRAM, price per bit is plotted against available units from 1965{1992 (R. Janow 1999, private communication); (2) for electricity, price per unit is plotted against generated electricity from 1926{1970 (O'Donnell 1973). In the DRAM market, a constant elasticity of 1:5 ts the data well. For electricity, the t with constant elasticity of 2:2 matches the quality of the t for DRAM in the years when the time series overlap. Both of these examples illustrate markets in which new applications arise as capacity increases. Rather than devalue the industry, innovations that allow steep drops in price increase the value of the market because the demand response is highly elastic; see (i) following (3.4). The demand curve shifts outward with new applications, each of which has its own product life that can be represented by an \S"-shaped \Bass curve" (Bass 1969, 1980). However, their composite is well described by a constant-elasticity curve, so that (3.5) represents a reasonable functional form for long-run demand. Because our intent is to model bandwidth capacity, the constant-elasticity form is both sensible and appropriate; however, our framework is su�ciently general to accommodate other functional forms as needed. (b ) Estimation of demand elasticity A suitable range of values for E in (3.5) can be estimated directly and indirectly. (i) Direct measurement. The Optical Network Business Unit of Lucent Technologies estimates (Optical Network Business Unit, Lucent Technologies 1999, private communication) that optical equipment is doubling in capacity for the same dollar cost every year, so that it is in e�ect possible to o�er the same capacity for half the price. Furthermore, tra�c (i.e., demand) is forecast to be between two and three times larger each year. Article submitted to Royal Society
6
S. Lanning, D. Mitra, Q. Wang, and M. Wright Table 1. Demand elasticity Equipment
Estimated elasticity Source
Digital circuit switch
1 28
1
WAN ATM core switch
2 84
2,3
LAN ATM backbone switch (ForeRunner ASX-200BX, small ASX-1000) WAN ATM edge switch
2 76
4
2 11
2,3
:
:
:
:
Original sources: 1 = NBI, 2 = In-Stat, 3 = IDC, 4 = Dell'Oro
Applying (3.6) with p1 =p2 = 2 and D2 =D1 = 3 gives E = 1:59; if p1 =p2 = 2 and D2 =D1 = 2, (3.6) shows that E = 1. The traditional elasticity estimate for voice tra�c is approximately 1:05, and France Telecom has recently estimated elasticity as 1:337 (Aldebert et al. 1999). (ii) Derived measure. The derived measure of elasticity is based on the notion that elasticity of demand is the same for both equipment and service providers if equipment providers have strong market power. A review of several studies has shown that more than four competitors are required to obtain competitive results (Scherer 1980), and the switching market in the United States is dominated by Lucent Technologies and Northern Telecom. Thus it is reasonable to assume price-taking behavior in the equipment market. Table 1 shows the values of demand elasticity for various classes of equipment. There is innovation in several equipment categories, including transmission (WDM and useable frequency windows in ber) and communications software to reduce support costs.
4. Assumptions and the Model
Our model is intended to maximize net present value by choosing optimal prices and technology purchases. (a ) The basic formulation Suppose that there are N cities, with a set I of indices of (distinct) city pairs, and that we are interested in time periods 1 through T . (i) Revenue. As discussed in Section 3a, demand between city pairs is assumed to satisfy (3.5) with a constant elasticity E so that, for any city pair (i; j ) 2 I in period t, Article submitted to Royal Society
Optimal Planning for Optical Transport Networks 7 demand and price satisfy ?E ; Dijt = Aijt pijt (4.1) where Dijt is demand (measured in OC-1 units) between cities i and j , pijt is the annual price per OC-1 between cities i and j , and Aijt is the scaling factor relating them; see (3.5). The total revenue in period t is then given by X
Rt =
2I
pijt Dijt :
(4.2)
(i;j )
(ii) Costs. In formulating the cost of operating the network, we ignore investment and expenses that have few direct e�ects on ring deployment and pricing decisions, and we assume that the costs of building conduits and laying ber cables are sunk. The two major cost components represented in the model are: � an initial one-time investment cost for the purchase and installation of hardware, such as Optical Transmission Units, WDM terminals, and regeneration and ampli cation equipment; � recurring maintenance costs for ber. The set K is de ned as the set of WDM technologies. For each technology k 2 K , �k denotes the time period in which this technology rst becomes available, and �k denotes the maximum capacity (in OC-1) of a single system in technology k. For each technology k and period t, Ikt denotes the acquisition cost of a WDM system and mkt denotes the per-mile cost of maintaining each ber route. For each two- ber UPSR ring of technology k purchased in period t, the investment cost is NIkt ; for each ring operated in period t, the recurring expense is 2Lmkt , where L denotes the total length of ber needed to connect all the cities. The number of WDM systems of technology k bought in period t is denoted by bkt (\b" for \bought"), and the number of such systems used is denoted by ukt (\u" for \used"). The expense in period t is then Expenset = N
X
2
k K
Ikt bkt + 2L
X
2
k K
mkt ukt :
(4.3)
(iii) Net present value. Combining (4.2) and (4.3), the cash ow Ct in period t is Ct = Rt ? Expenset : (4.4) In addition to considering cash ow, our model includes a terminal value function that depends on two parameters: a (perpetual) growth rate in cash ows, called g1 , and an integer f satisfying 0 � f � 1. (For details, see Lanning et al. 2000.) Letting � = � + g1 , where � is the discount rate, terminal value is de ned by f TV = 11??�� �CT ; (4.5) Article submitted to Royal Society
8 S. Lanning, D. Mitra, Q. Wang, and M. Wright where CT is the cash ow in the nal period; see (4.4). The net present value over periods 1 through T is given by NPV =
T X t=1
Ct �t + TV;
(4.6)
where � denotes the assumed discount rate (with � < 1). The objective of the model is to maximize NPV (i.e., discounted cash ow) as de ned by (4.6). (iv) Constraints. The following constraints are imposed in each time period: (i) Total demand between cities i and j cannot exceed the capacity provided by all available systems: X X i;j
2I
Dijt �
2
k K
�k ukt :
(ii) The number of systems used cannot exceed the number used in the previous time period plus the number bought in the current period: ukt � bkt + uk;t?1 : In e�ect, this constraint states that, once a system has been \retired", i.e., has ceased to be used, it cannot be used later. In addition, the number of systems used in period 1 must be equal to the number bought in that period, so that uk1 = bk1 for all technologies k. (iii) No system of technology k can be bought before that technology becomes available: bkt = 0; t < �k ; for all k: (iv) All prices and the numbers of systems bought and used must be nonnegative. (v) The optimization problem. The parameters to be optimized are the city-pair prices, pijt , and the numbers of systems of each technology bought and used, bkt and ukt . Putting together the objective and constraints, the problem is: maximize NPV (4.7) p;u;b subject to
X
i;j
2I
Dijt � ukt bkt pijt uk1 bkt ukt
where NPV is de ned by (4.6). Article submitted to Royal Society
X
2
k K
�k ukt ; t = 1; : : : T
� bkt + uk;t? ; k 2 K; t = 2; : : : T = 0; t < �k ; k 2 K; t = 1; : : : T � 0; (i; j ) 2 I ; t = 1; : : : T = bk ; k 2 K; � 0; k 2 K; t = 1; : : : T � 0; k 2 K; t = 1; : : : T 1
1
Optimal Planning for Optical Transport Networks 9 (b ) Representing technology innovations Optical transport networks are characterized by frequent, substantial increases in capacity. To parameterize this phenomenon in the model, we assume that each new WDM technology has capacity � times larger than that of its immediate predecessor, i.e.,
�k = ��k?1 ;
(4.8)
where � > 1. To characterize the e�ects of a new technology on costs, d (d for \disruptiveness") is de ned as the reduction in initial investment cost per unit of capacity in technology k compared to technology k ? 1, so that the per-unit investment costs satisfy
Ik�k = (1 ? d) Ik?1;�k?1 : �k �k?1
(4.9)
For example, d = 0:2 means that the per-unit cost of a new technology is 80% of the per-unit cost of the preceding technology. The larger the value of d, the greater reduction in the per-unit investment cost, i.e., the greater disruptiveness. For simplicity, d is assumed to be constant; in a more complex model, d could depend on time and/or technology. Finally, we assume that, once a technology has become available, its investment cost decreases by the (constant) factor �, i.e.,
Ik;t+1 = �Ikt for t � �k :
(4.10)
(c ) Optimizing the model Because the price variables pijt appear nonlinearly in the formulation of demand (see (4.1)), the optimization problem (4.7) has a nonlinear objective function and nonlinear constraints. Furthermore, the numbers of systems bought and used must be integers. Unfortunately, there are no currently available algorithms, let alone general-purpose software, for solving a general mixed-integer nonlinear optimization problem. Our approach to solving (4.7) is a sequential continuous relaxation technique, an approach widely used in optimization; see, for example, Fletcher 1987, Gill et al. 1981. For details of its application to our model, see Lanning et al. 2000.
5. Analysis and Results
The purpose of developing this model is to explore, to low order, the e�ects of both price elasticity and changes in per-unit technology costs. We give results for a speci c problem: a hypothetical ve-city ring network in which the distance between adjacent cities is 500 miles. Thus N is 5, there are 10 city pairs, and L, the length of ber needed to connect the cities, is 2500. Demand is scaled by assuming an initial demand of 10 OC-1 between each city pair, with an initial monthly price of $18,000 per OC-1; these values determine the coe�cients Aijt in (4.1). Article submitted to Royal Society
10
S. Lanning, D. Mitra, Q. Wang, and M. Wright Fiber maintenance costs are estimated using the Hat eld model (HAI Consulting Inc. 1998). The life of a conduit is assumed to be 30 years, with eight-year depreciation of the ber cables. Consequently, the amortized yearly investment cost of laying a conduit and installing a ber cable ranges from $172 to $516 per mile per ber, depending on cable size, which ranges between 24 and 96 bers per cable. It can also be derived from the Hat eld model that the ratio of amortized investment expense to recurring supporting expense is around 1=0:3 � 3:33. By applying this ratio, yearly ber maintenance expense is estimated to be between $52 and $155 per mile per ber. For simplicity, we use the constant value mkt = $100 per mile per ber in (4.3) for all technologies and time periods. The factor � de ning the growth in capacity in (4.8) is taken as 2, meaning that each new technology has double the capacity of the preceding one. The capacity of technology 1 is assumed to be 1920 OC-1. Thus the technologies considered in the rst six years could correspond to OC 48-40, OC 192-20, OC 192-40, OC 192-80, OC 768-40, and OC 768-80. The rst technology is assumed to become available in period 1, with a new technology entering in every subsequent time period. In period 1, the investment cost per OC-1 is assumed to be $2; 500, so that the per-system cost for technology 1, I11 , is $4; 800; 000. Thereafter, the per-system cost Ikt in (4.3) is de ned by (4.8), (4.9), and (4.10). The parameter � specifying the per-period reduction in investment cost for a xed technology in (4.10) is taken as 0:9, i.e., the investment cost for a xed technology decreases by 10% in each period. The discount rate �, used in (4.6), is 0:86. In computing terminal value (see (4.5)), we take g1 = 0:07 and f = 7. We show results for the rst six time periods. To avoid dependence on the de nition of terminal value, the variables have been optimized over a longer time horizon so that the results for periods 1 through 6 do not change as the time horizon increases; for the results given, this corresponds to T = 10. The generation and number of technology acquisitions in periods 1 through 6 are shown in Figure 1, where the integer inside the symbol for each technology indicates the number of such systems purchased in the given time period. The results shown correspond to three values of the disruptiveness factor, d = 0:2, d = 0:3, and d = 0:4; see (4.9). A larger value of d means more steeply dropping per-unit technology costs, so that (for example) d = 0:3 means a 30% per-unit cost reduction for each new technology. For each value of d, technology acquisitions are shown for three values of elasticity, ranging from mildly elastic (E = 1:3) to highly elastic (E = 2:1). For a xed disruptiveness, Figure 2 shows that � larger elasticity implies more innovative technology acquisitions, i.e., new technologies tend to be acquired sooner; � the number of systems acquired increases with larger elasticity; and � technology acquisitions occur more frequently as elasticity increases. With elasticity of 1:3, even with high disruptiveness (d = 0:4), only one system is acquired in any given period. Figure 2 also allows us to compare the e�ects of disruptiveness on technology acquisitions. For a xed elasticity, higher disruptiveness, which means a greater reduction in per-unit cost over time, leads to acquisition of less equipment in the Article submitted to Royal Society
Optimal Planning for Optical Transport Networks 11 early time periods and more in the later time periods. In period 1 with elasticity 2:1, 48 systems are acquired when d is 0:2, 31 systems when d is 0:3, and 22 systems when d is 0:4. In period 6, by contrast, eight systems (seven of technology 6, one of technology 3) are acquired when d is 0:2, 25 systems (all of technology 6) when d is 0:3, and 101 systems (all of technology 6) when d is 0:4.
E = 2:1 d = 0:2
d = 0:3
d = 0:4
1 14
12
2
1 1
1 9
1 7
1
1 1 1
48
18
E = 1:7
9
1 2
E = 1:3
2
E = 2:1
31
1 18
20
22
1 23
25
E = 1:7
6
3
1 2
3
2
2
E = 1:3
1
1
E = 2:1
22
1 21
30
46
68
101
E = 1:7
5
1 3
1 3
5
1 5
7
E = 1:3
1
1
1
1
T =1
T =2
T =4
T =5
Technologies:
1
= 1;
1
1
T =3
= 2; = 3;
T =6
= 4; = 5; = 6
Figure 2. Technology acquisitions over time.
Our model provides insight into the e�ects of elasticity and disruptiveness on the optimal pricing scenario. Figure 3 shows the prices over time for two values of disruptiveness (d = 0:2 and d = 0:4) and three values of elasticity (1:3, 1:7, and 2:1). Article submitted to Royal Society
12
S. Lanning, D. Mitra, Q. Wang, and M. Wright
2500
a
d = 0:2 d = 0:4
2000 Price per OC-1 1500 ($ per month) 1000
a
a : elasticity 1:3 b : elasticity 1:7 c : elasticity 2:1
b c b c
500 2
Period 1
3
4
5
6
Figure 3. Prices over time.
An obvious conclusion from Figure 3 is that, for a xed disruptiveness, prices are uniformly lower across all time periods as elasticity increases. This result re ects the observations of Section 3 that higher elasticity implies higher revenue from price reductions. A second implication of Figure 3 is that, for a given elasticity, a larger disruptiveness means a higher initial price but a lower price in later periods (period 3 and after). Finally, our model reveals the relationship between elasticity, disruptiveness, and the growth in capacity of the network over time. Figure 4 shows capacity (on a log scale) as a function of time for the same two values of disruptiveness (d = 0:2 and d = 0:4) and three values of elasticity (1:3, 1:7, and 2:1) shown in Figure 2. Observe that, for a given elasticity, the initial capacity is lower for larger disruptiveness, but that capacity thereafter grows much more rapidly for the larger disruptiveness. Similarly, for a given disruptiveness, a larger value of elasticity implies a larger capacity in every time period. For the largest values of elasticity (E = 2:1) and disruptiveness (d = 0:4), capacity increases by a factor of more than 200 during the six time periods shown.
6. Conclusions
We have developed a model to analyze the optimal growth of optical transport networks. Unlike previous planning models (Freidenfelds 1981) that view future demand as externally given, we allow demand to be determined by prices via a constant-elasticity demand function; prices are then optimized jointly with capacity investment decisions. The formulation of a constant-elasticity demand function Article submitted to Royal Society
13
Optimal Planning for Optical Transport Networks
c 2981
a : elasticity 1:3 b : elasticity 1:7 c : elasticity 2:1
d = 0:2 d = 0:4
1097
c b
403 148 ln(capacity) 54:5
b a
20:1 7:4
a
2:7 1 Period 1
2
3
4
5
6
Figure 4. Capacity (shown on a log scale) over time.
represents current communications technology trends reasonably well. Our results show that frequent deployment of newer systems is optimal in an environment of high elasticity and large reductions in the per-unit cost of technology. These results run counter to traditional voice network carrier practice, where expansion of networks is slow and the timing of investments is irregular. The difference can be attributed to inclusion of high elasticity and disruptiveness, which are positively correlated with aggressive deployment of newer systems. These results demonstrate the range over which frequent investments make sense and how the rate of investment may accelerate or decelerate depending on the level of technology disruptiveness. With appropriate assumptions, we can map forecasts of capacity growth to a combination of technology disruptiveness and elasticity. The average exponential capacity growth rates that we estimate range between 30{ 90% per year. While these average growth rates are high, they pale in comparison to the 200{300% growth rates sometimes reported by industry consultants and Article submitted to Royal Society
14 S. Lanning, D. Mitra, Q. Wang, and M. Wright analysts. Forecasts of higher rates of growth may be justi ed by other factors. One possible factor is that regulation has retarded investment. Less regulation or the entry of unregulated rms a�ords the industry a one-time adjustment to the optimal expansion path, which is re ected as a period of growth at the highest rate that rms can accommodate and that the market can absorb. Further work is needed to extend this method from a monopoly or cooperative solution to more competitive solutions. Future modeling work will move in several directions. First, random factors can be included to account for uncertainties in both future demand and technology environments. Another direction is to introduce competitive carriers for which a Cournot capacity choice model (Herk 1993) is used to replace the current maximization of net present value.
References
Aldebert, M., Ivaldi, M, & Roucolle, C. 1999 Telecommunication demand and pricing structure, in Proceedings of the 7th International Conference on Telecommunications Systems: Modeling and Analysis, 254{267. Bass, F. M. 1969 A new product growth model for consumer durables, Management Science 15 215{227. Bass, F.M. 1980 The relationship between di�usion rates, experience curves and demand elasticities for consumer durable technological innovations. Journal of Business 53, S51{ S67. Cerf, V. G. 1998 Interview, Technos Quarterly 7. (http://www.technos.net/journal/volume7/2cerf.htm.) Fletcher, R. 1987 Practical Methods of Optimization, 2nd edn. Chichester: John Wiley and Sons. Freidenfelds, J. 1981 Capacity Expansion: Analysis of Simple Methods with Applications. Amsterdam: North Holland. Gill, P. E., Murray, W. & Wright, M. H. 1981 Practical Optimization. New York: Academic Press. HAI Consulting Inc. 1998 HAI Model Description, Release 5.0. Distributed by FCC. Herk, L. F. 1993 Consumer choice and Cournot behavior in capacity-constrained duopoly competition. Rand Journal of Economics 24, 399{417. Lanning, S. G., Mitra, D., Wang, Q. & Wright, M. H. 2000 Modeling and optimization of large-scale networks. Research memorandum, Bell Laboratories, Murray Hill, NJ. O'Donnell, S. 1973 Historical Statistics of the Electric Utility Industry through 1970, tables 7 and 33. New York: Edison Electric Institute. Scherer, F. M. 1980 Industrial Market Structure and Economic Performance, pp. 280{1. New York: Rand McNally. Stern, T. E. & Bala, K. 1999 Multiwavelength Optical Networks|A Layered Approach. Reading: Addison Wesley Longman.
Article submitted to Royal Society