To design complex networks to minimize traffic congestion, it is necessary to understand how traffic flow depends on network structure. We study data packet ...
CHAOS 17, 043103 共2007兲
Optimal structure of complex networks for minimizing traffic congestion Liang Zhao and Thiago Henrique Cupertino Institute of Mathematics and Computer Science, University of São Paulo, São Carlos, SP, 13560-970, Brazil
Kwangho Park Department of Electrical Engineering, Arizona State University, Tempe, Arizona 85287, USA
Ying-Cheng Lai Department of Electrical Engineering, Arizona State University, Tempe, Arizona 85287, USA and Department of Physics and Astronomy, Arizona State University, Tempe, Arizona 85287, USA
Xiaogang Jin College of Computer Science, Zhejiang University, Hangzhou, Zhejiang Province, 310058, China
共Received 12 June 2007; accepted 6 September 2007; published online 17 October 2007兲 To design complex networks to minimize traffic congestion, it is necessary to understand how traffic flow depends on network structure. We study data packet flow on complex networks, where the packet delivery capacity of each node is not fixed. The optimal configuration of capacities to minimize traffic congestion is derived and the critical packet generating rate is determined, below which the network is at a free flow state but above which congestion occurs. Our analysis reveals a direct relation between network topology and traffic flow. Optimal network structure, free of traffic congestion, should have two features: uniform distribution of load over all nodes and small network diameter. This finding is confirmed by numerical simulations. Our analysis also makes it possible to theoretically compare the congestion conditions for different types of complex networks. In particular, we find that network with low critical generating rate is more susceptible to congestion. The comparison has been made on the following complex-network topologies: random, scale-free, and regular. © 2007 American Institute of Physics. 关DOI: 10.1063/1.2790367兴 Complex networks are essential for a modern society. Understanding of dynamics on complex networks with different topologies is not only interesting theoretically, but also can have impacts in real-world applications. Among various dynamics, traffic flow has been studied extensively due to the necessity of designing high efficiency, low cost networks. Examples include communication, computer, traffic, and power distribution networks. Because the amount of information and other physical quantities to be transmitted or transported over the network are ever increasing, congestion detection and optimization have become a topic of recent interest. One of the open questions, for which a relatively complete understanding is still lacking, is how the dynamical property of congestion depends on the network structure. In this work, we study traffic-flow dynamics on complex networks. Our approach is different from previous ones in that we focus on the optimal configuration of capacities to minimize traffic congestion. The critical packetgenerating rate is also determined, below which the network is at a free flow state and above which congestion occurs. Our analysis reveals a direct relationship between some controllable parameters of network topology and traffic-flow performance. Moreover, our results permit a theoretical comparison of the congestion conditions among different types of complex networks. Interestingly, we find that the congestion criticality decreases by the following order of network topology: random, scale-free, and regular. This result confirms previously obtained nu1054-1500/2007/17共4兲/043103/5/$23.00
merical results on phase transition of traffic-flow dynamics on complex networks. I. INTRODUCTION
In recent years, tremendous interest has been devoted to studying statistical and dynamical properties of large-scale networks with complex structures. This is motivated by the facts that complex networks occur commonly in nature and that they are essential for the infrastructure of a modern society. Examples of such networks include the Internet, worldwide web, telecommunication systems, power grid, social networks, traffic networks, biological networks, such as neural networks, gene regulatory networks, protein-protein interaction networks, etc. The first study on large networks was done by Erdös and Rényi,1 who analyzed rigorously randomly connected networks. In 1998, Watts and Strogatz2 discovered that the average shortest paths of a regular network can be drastically reduced and the local structure of the network as measured by clustering coefficient can be maintained by randomly changing only a small portion of links. The resulting networks are called small-world networks, which are representative of real networks such as social and linguistic networks. In 1999, Barabási and Albert3 discovered that the degree distribution of many complex networks obeys a power law P共k兲 ⬃ k−␥, where k is the number of links 共or the degree兲 of a randomly chosen node and ␥ is the scale exponent, henceforth the term scale-free networks. This means that the probability of finding a set of nodes with a
17, 043103-1
© 2007 American Institute of Physics
Downloaded 13 Dec 2007 to 129.219.51.205. Redistribution subject to AIP license or copyright; see http://chaos.aip.org/chaos/copyright.jsp
043103-2
Chaos 17, 043103 共2007兲
Zhao et al.
large number of links is not exponentially small, indicating that the degrees are highly heterogeneous, in contrast to random networks whose degree distributions are homogeneous. After those seminal works, extensive research has been carried out, for example, on the following topics: network growth and self-organization, degree and betweenness distribution, complex network resilience and cascading breakdown, epidemiological process, community structure, and network stability and synchronization 共see Refs. 4–6 and references therein兲. Complex networks have become an active field in nonlinear science. Traffic flow in networks has been extensively studied.7–20 However, earlier models assumed regular network topology, such as two-dimensional lattices or Cayley trees. Recently, there has been a growing interest in traffic flow on complex networks.21–27 This is motivated by the fact that the Internet and many other realistic networks are complex to a significant extent, leading to a pressing need to investigate the dynamics of traffic flow on these networks. In many real-world systems designed for information or data exchange, traffic congestion can lead to failures or delays of various system functions. Intuitively, traffic congestion could be largely reduced or completely avoided with a very large average degree of connectivity and/or node capacity for data packet delivery. However, this may not be feasible because of the requirement of potentially high cost. In a network, traffic congestion occurs as soon as the packetgenerating rate on each node of the network is greater than a critical value. Network with a smaller critical generating rate is more susceptible to congestion. A recent work23 has shown that, for two networks with the same average connectivity, node capacity, and total number of nodes, if their topological structures are different, the critical packet-generating rate can be significantly different, indicating that traffic congestion depends sensitively on network structure. It is found that scale-free networks and random networks are more tolerant of traffic congestion than regular networks and Cayley trees. However, between a scale-free and a random network, the former is more prone to congestion. These results imply the existence of some optimal network structure that minimizes traffic congestion. In order to better understand the problem of optimal network structure for minimal traffic congestion,18,28 in this paper we study traffic-flow dynamics on complex networks in a more general setting. In particular, our study differs from other works on the same topic18,23 in that we do not fix the packet-delivery capacity of each node. We shall determine the optimal configuration of capacities to minimize traffic congestion in the network. The critical packet-generating rate is also determined, below which the network is at a free flow state, and above which congestion occurs. Our analysis reveals a direct relationship between some controllable parameters characterizing the network topology and the traffic-flow performance. Specifically we find that, in order to avoid severe traffic congestion, network structure should have two features: uniform distribution of load over all nodes and small network diameter. Our theoretical analysis makes it possible to compare the critical packet-generating rate among different types of complex networks. We find that the
critical rate decreases by the following order of the network topology: random, scale-free, and regular. These confirm pertinent previous numerical results concerning traffic dynamics on complex networks.23 In Sec. II we present a theoretical analysis to determine the optimal configuration of delivery capacities. In Sec. III we provide computer simulation results to support our analysis. In Sec. IV we give a brief summary and draw conclusions. II. THEORETICAL ANALYSIS
We consider a general model for traffic flow on complex networks. Each node i generates a data packet with probability i at each time step, which is to be delivered to a randomly selected destination node, say j. The packet is delivered to its destination along the shortest path between nodes i and j. At each time step the data packet can be delivered from one to another if the nodes are connected, such as a pair of nearest-neighboring nodes. The maximum number of packets that node i can deliver at each time step is Ci, the delivery capacity. Although traffic-flow rules defined in this model are simple, they capture the essential characteristics of traffic flow in real networks. Our aim is to determine the relationship between the network structure and the critical packet-generating rate i,max.29 To achieve this, we use a recent finding on the critical packet generating rate of node i, i.e., i = Ci / 共Bi / N兲,23 where Ci, Bi, and N are the delivery capacity, the betweenness of node i, and the total number of N 2i nodes in the network, respectively. Let ˜ = 共1 / N兲兺i=1 2 2 N = N兺i=1Ci / Bi be the average critical packet-generating rate. In order to determine the optimal values of Ci and ˜max, we define the following Lagrangian:
冋兺 册 N
L = ˜ + ␦
Ci − S ,
共1兲
i=1
where ␦ is a Lagrange multiplier, S = N共1 + 具k典兲 is the total capacity of the network, and 具k典 is the average degree of the network. The total capacity of the network is proportional to the network size and 具k典. This constraint can be justified by the consideration that, in many network designs, network size and the degree of connectivity are usually the main factors determining the cost, and thus they should be limited. The set of Ci maximizes L under the following conditions:
L = 0, Ci
i = 1,2, . . . ,N.
共2兲
From Eqs. 共1兲 and 共2兲, we get Ci = −B2i ␦ / 2N and ␦ = N −2N2d具k典 / 兺i=1 B2i , which lead to the optimal delivery capacN B2i . Since i is a positive number, it is ity: Ci,optimal = B2i S / 兺i=1 2 maximized when i is maximized. Thus, we have i,max N = BiSN / 兺i=1 B2i , where i,max is the maximum generating rate of node i. The average maximum generating rate is ˜max N N = 共1 / N兲兺i=1 i,max, which becomes ˜max = SN2D / 兺i=1 B2i , N where the betweenness Bi satisfies 兺i=1Bi = N共N − 1兲D ⬇ N2D for large N 共D is the network diameter兲. To proceed, it is N B2i with respect to N and D. For a necessary to determine 兺i=1
Downloaded 13 Dec 2007 to 129.219.51.205. Redistribution subject to AIP license or copyright; see http://chaos.aip.org/chaos/copyright.jsp
043103-3
Chaos 17, 043103 共2007兲
Optimal structure of complex networks
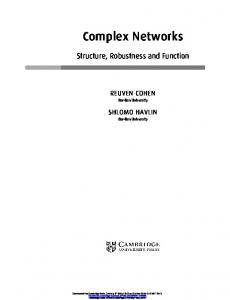
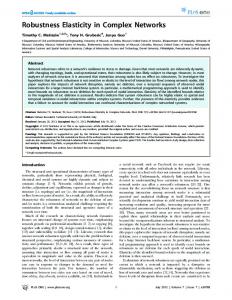
FIG. 1. 共Color online兲 Algebraic scaling of f共N兲 with network size N for random and scale-free networks. For both types of networks, we fix 具k典 = 4 and the simulation results are averaged over 200 realizations. For random networks, we find r ⬇ 0.17 and c ⬇ 0.74. For scale-free networks with degree exponent ␥ = 3 共see Refs. 1–5兲, we find r ⬇ 0.54 and c ⬇ 0.28.
regular network, all nodes have the same betweenness, 2 N Bi,reg = N3D2. For a general Bi,reg = DN. Thus, we have 兺i=1 N complex network, we can write 兺i=1B2i = N3D2 f共N兲, where f共N兲 is a function that depends on the network structure. For example, for a scale-free network, it is possible to calculate f共N兲 for different values of ␥. To illustrate this, we present our calculations for ␥ = 3.30 First consider the summation 兺iki = 2mN, where ki and 2m are the degree of node i and the average degree of the network, respectively. The summation can be replaced by an integration, i.e., 兺iki ⬇ a兰kkmaxP共k兲dk min ⬃ N, where we have used the degree distribution function P共k兲 = ak−␥ with constant a, and have assumed that the network diameter satisfies D Ⰶ N for large N. Since kmax ⬃ N1/共␥−1兲 共Ref. 31兲 and kmin is a small constant for scale-free networks, we have a ⬃ N for large N. Next, we focus on the summation 兺iBi ⬇ N2D. It can also be approximated by integration: 兺iBi ⬇ 兰kkmaxB共k兲P共k兲dk ⬃ N2. Using the scaling relamin tion B共k兲 = bk with ⬇ 1.5 for ␥ = 3,32,33 we find b ⬃ N for large N. The sum 兺iB2i can then be calculated, as follows:
兺 B2i ⬇ i
冕
kmax
B2共k兲P共k兲dk ⬃ N3N共2−␥+1兲/共␥−1兲 .
共3兲
kmin
We then get f共N兲 ⬃ N0.5. This result has been verified by numerical simulations, as shown in Fig. 1. As is apparent from the analysis, the function f共N兲 for different ␥ can be determined in a similar way. Numerically, we find the algebraic law f共N兲 = cNr holds even for random networks, as shown in Fig. 1. The average maximum rate over the whole network generally can be written as ˜ = 1 + 具k典 , max Df共N兲
共4兲
where the critical rate ˜max is inversely proportional to the network diameter D and the scaling function f共N兲. This means that, if two structurally distinct networks have the same average degree, the same node capacity, and the same system size, the one with smaller value of Df共N兲 is more
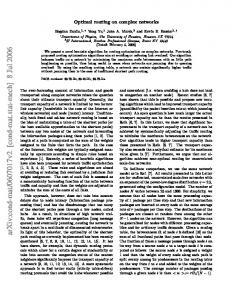
FIG. 2. 共Color online兲 For random and scale-free networks of degree exponent ␥ = 3, 共a兲 ˜max vs network size N for 具k典 = 4 and 共b兲 ˜max vs the average degree 具k典 for N = 5000.
robust against traffic congestion. As we will explain, f共N兲 has larger values when total load of the network is concentrated on a small number of nodes. Therefore, networks with small diameter and uniform load distribution are more robust against traffic congestion.
III. NUMERICAL SUPPORT
In order to characterize the transition from free traffic flow to congestion, we use the order parameter = limt→⬁具⌬⌰典 / ˜⌬t,15 where ⌬⌰ = ⌰共t + ⌬t兲 − ⌰共t兲, ⌰共t兲 is the total number of packets in the network at time t, and 具¯典 indicates average over a time window of length ⌬t. For ˜ ⬍ ˜max, the network is in a free flow state. In this case, we have ⌬⌰ ⬇ 0 and ⬇ 0. For ˜ ⬎ ˜max, traffic congestion occurs so that ⌬⌰ increases with ⌬t. In our simulations, scalefree and random networks are generated by using the general network model proposed in Ref. 34. Betweenness is calculated by using the algorithm introduced in Ref. 35. For all cases considered, is approximately zero when ˜ is small, but it suddenly increases when ˜ is larger than a critical value ˜max. Figure 2共a兲 shows ˜max versus network size N for random and scale-free networks, respectively. We see that ˜ max decreases with N, which means that larger networks are more susceptible to congestion than smaller networks. This is because packets take longer time to be delivered in a larger network, which in turn leads to higher chances for the network to be congested. In the extreme case, where network size is infinite, situations can arise where packets will never reach their respective destinations in finite time. Hence, the critical packet generating rate decreases with system size. This behavior is predicted by our theoretical result Eq. 共4兲, which says that ˜max is inversely proportional to Df共N兲 and therefore decreases with N. Figure 2共b兲 shows that for both scale-free and random networks, ˜max increases with the average degree. This is because an increase in the average degree usually reduces the lengths of shortest paths. Equation
Downloaded 13 Dec 2007 to 129.219.51.205. Redistribution subject to AIP license or copyright; see http://chaos.aip.org/chaos/copyright.jsp
043103-4
Chaos 17, 043103 共2007兲
Zhao et al.
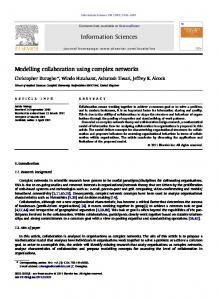
FIG. 3. 共Color online兲 Comparison of critical generating rate ˜max from theoretical prediction 共diamonds兲 and from direct numerical simulation 共squares兲 for 共a兲 random networks and 共b兲 scale-free networks with degree exponent ␥ = 3. For all networks considered, 具k典 = 4.
共4兲 predicts that the critical generating rate is proportional to the average degree. Again the simulation results are consistent with our theoretical analysis. To compare Eq. 共4兲 with numerical results in a more quantitative way, in Fig. 3 we show values of ˜max from direct numerical simulations and from Eq. 共4兲 for random 关Fig. 3共a兲兴 and scale-free networks 关Fig. 3共b兲兴. In both cases, a reasonably good agreement is observed, especially when N is large. Previous numerical simulations have shown that scalefree networks are more vulnerable to traffic congestion than random networks with the same number of nodes and average degree.33 Our result confirms this fact and provides a theoretical explanation. In particular, say we consider the R SF / ˜max , where r ⬎ 1 means that scale-free 共SF兲 ratio r = ˜max network is more easily congested than random 共R兲 network. Since DSF ⬃ ln N / ln ln N, f SF共N兲 ⬃ N0.54 共for scale-free network with degree exponent ␥ = 3; see Refs. 1–5兲 and DR ⬃ ln N, f R共N兲 ⬃ N0.17 for networks with size N and 具k典 = 4, the ratio r can be written as r ⬃ 共N0.54 ln N/ln ln N兲/共N0.17 ln N兲 = N0.37/ln ln N.
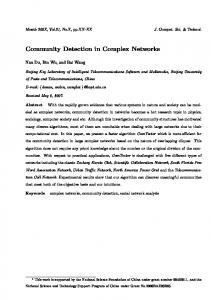
FIG. 4. 共Color online兲 Order parameter vs the packet-generating rate for networks of different diameters. Circles, squares, asterisks, and diamonds correspond to results for p = 0 共regular network兲, p = 0.01 共small-world network兲, p = 0.1 共partially random network兲, and p = 1 共random network兲, respectively. For each data point, the network size is N = 2000 and 50 realizations are averaged.
apparently more robust against congestion than regular networks. This can also be seen by considering the ratio r p=1 ˜ p=0 = ˜max / max. From Eq. 共4兲 and using D = N / 2 for p = 0, we see that the ratio becomes r ⬃ 共N / 2兲 / 共N0.17 ln N兲 ⬃ N0.83 / ln N ⬎ 1 for large N. As shown in Fig. 1, f共N兲 has relatively larger values when the total load of the network is concentrated on a small number of nodes, as for a scale-free network. In order to avoid severe traffic congestion, network structure should have the following two features: 共1兲 total load in the network should be distributed uniformly over all nodes as much as possible and 共2兲 network diameter should be small. One intuitive but efficient method to generate such a network from a network model with p = 1 in Fig. 4 is as follows. Instead of detaching a link from each node and connecting it to a randomly selected node without taking into consideration the degree of the newly connected node, we detach all links connected to next nearest neighbors and connect them to a randomly selected node which has less than k links. As a
共5兲
We see that r is always greater than 1 for large N. The same results hold for 具k典 ⬎ 4. This is because f共N兲 is larger in a scale-free network than in a random network. Although the network diameter D shows the opposite behavior, the difference of D between two types of networks is insignificant to affect the value of f共N兲. Figure 4 shows the order parameter versus the packetgenerating rate ˜ for networks of different diameters, as the networks are changed from regular to small-world and to random by a continuous rewiring process with rewiring probability p.2 When p is small, the network is small-world. For p = 1, all links are randomly changed and the network becomes completely random. As p is increased, N and 具k典 are fixed, but D is reduced. We thus expect ˜max to decrease with p, as confirmed by Fig. 4. We see that random networks are
FIG. 5. 共Color online兲 Order parameter vs the packet-generating rate for classical random networks 共circles兲, and for the new random networks proposed in this paper 共asterisks兲. Network parameters are p = 1, N = 3000, and 具k典 = 4. For each data point, 30 realizations are averaged.
Downloaded 13 Dec 2007 to 129.219.51.205. Redistribution subject to AIP license or copyright; see http://chaos.aip.org/chaos/copyright.jsp
043103-5
result, each node in the network will have exactly k links, and thus the load of the network is distributed uniformly. We expect this network to be less congested than the random network with p = 1 in Fig. 4. This has indeed been observed, as shown in Fig. 5, where the onset of traffic congestion occurs for larger value of for our uniform random network. IV. DISCUSSION
In conclusion, we have presented a theoretical analysis and simulation results for traffic flow processes on complex networks. Our motivation comes from the desire to understand the influence of network structure on the traffic dynamics. We have obtained the optimal configuration of node capacity for data delivery in complex networks and the maximum packet-generating rate above which traffic congestion occurs. Our analysis reveals that traffic congestion depends on factors such as network size, network diameter, average degree, and load distribution. Our finding suggests that, in order to mitigate or avoid traffic congestion, load should be uniformly distributed in the network and the network diameter should be small. Our results have practical implications for designing computer networks and other communication networks where minimizing traffic congestion is a central goal. ACKNOWLEDGMENTS
Z.L. and T.H.C. were supported by CNPq and FAPESP. K.P. and Y.C.L. were supported by AFOSR under Grant No. FA9550-07-1-0045 and by ONR through the WVHTC Foundation. P. Erdös and A. Rényi, Acta Math. Acad. Sci. Hung. 12, 261 共1961兲. D. J. Watts and S. H. Strogatz, Nature 共London兲 393, 440 共1998兲. 3 A.-L. Barabási and R. Albert, Science 286, 509 共1999兲. 4 R. Albert and A.-L. Barabási, Rev. Mod. Phys. 74, 47 共2002兲. 5 M. E. J. Newman, SIAM Rev. 45, 167 共2003兲. 6 S. Boccaletti, V. Latora, Y. Moreno, M. Chavez, and D.-U. Hwang, Phys. Rep. 424, 175 共2006兲. 7 H. Li and M. Maresca, IEEE Trans. Comput. 38, 1345 共1989兲. 1 2
Chaos 17, 043103 共2007兲
Optimal structure of complex networks 8
W. E. Leland, M. S. Taqqu, W. Willinger, and D. V. Wilson, Comput. Commun. Rev. 23, 183 共1993兲. 9 M. S. Taqqu, W. Willinger, and R. Sherman, Comput. Commun. Rev. 27, 5 共1997兲. 10 M. E. Crovella and A. Bestavros, IEEE/ACM Trans. Netw. 5, 835 共1997兲. 11 T. Ohira and R. Sawatari, Phys. Rev. E 58, 193 共1998兲. 12 M. Faloutsos, P. Faloutsos, and C. Faloutsos, Comput. Commun. Rev. 29, 251 共1999兲. 13 H. Fukś and A. T. Lawniczak, Math. Comput. 51, 101 共1999兲. 14 R. V. Solé and S. Valverde, Physica A 289, 595 共2001兲. 15 A. Arenas, A. Díaz-Guilera, and R. Guimerà, Phys. Rev. Lett. 86, 3196 共2001兲. 16 R. Guimerà, A. Arenas, and A. Díaz-Guilera, Physica A 299, 247 共2001兲. 17 R. Guimerà, A. Arenas, A. Díaz-Guilera, and F. Giralt, Phys. Rev. E 66, 026704 共2002兲. 18 R. Guimerà, A. Díaz-Guilera, F. Vega-Redondo, A. Cabrales, and A. Arenas, Phys. Rev. Lett. 89, 248701 共2002兲. 19 M. Woolf, D. K. Arrowsmith, R. J. Mondragón-C, and J. M. Pitts, Phys. Rev. E 66, 046106 共2002兲. 20 S. Valverde and R. V. Solé, Physica A 312, 636 共2002兲. 21 E. J. Lee, K.-I. Goh, B. Kahng, and D. Kim, Phys. Rev. E 71, 056108 共2005兲. 22 B. Danila, Y. Yu, J. A. Marsh, and K. E. Bassler, Phys. Rev. E 74, 046106 共2006兲. 23 L. Zhao, Y.-C. Lai, K. Park, and N. Ye, Phys. Rev. E 71, 026125 共2005兲. 24 R. Germano and A. P. S. de Moura, Phys. Rev. E 74, 036117 共2006兲. 25 M.-B. Hu, W.-X. Wang, R. Jiang, Q.-S. Wu, and Y.-H. Wu, Phys. Rev. E 75, 036102 共2007兲. 26 W.-X. Wang, C.-Y. Yin, G. Yan, and B.-H. Wang, Phys. Rev. E 74, 016101 共2006兲. 27 Y. Xia, C. K. Tse, W. M. Tam, F. C. M. Lau, and M. Small, Phys. Rev. E 72, 026116 共2005兲. 28 L. Donetti, P. I. Hurtado, and M. A. Muñoz, Phys. Rev. Lett. 95, 188701 共2005兲. 29 Recently, Duch et al. have obtained a theoretical formula relating the critical packet-generating rate max to the probability of node removal 共Ref. 36兲. In their study, all nodes have the same packet-generating rate . In our work, each node has a different packet-generating rate. We have obtained the average critical packet-generating rate without requiring any node failure. 30 M. Barthelemy, Eur. Phys. J. B 38, 163 共2004兲. 31 P. L. Krapivsky, S. Redner, and F. Leyvraz, Phys. Rev. Lett. 85, 4629 共2000兲. 32 K. Park, Y.-C. Lai, and N. Ye, Phys. Rev. E 70, 026109 共2004兲. 33 L. Zhao, K. Park, Y.-C. Lai, and N. Ye, Phys. Rev. E 72, 025104 共2005兲. 34 Z. Liu, Y.-C. Lai, N. Ye, and P. Dasgupta, Phys. Lett. A 303, 337 共2002兲. 35 M. E. J. Newman, Phys. Rev. E 64, 016132 共2001兲. 36 J. Duch and A. Aranas, Proc. SPIE 6601, 66010O 共2007兲.
Downloaded 13 Dec 2007 to 129.219.51.205. Redistribution subject to AIP license or copyright; see http://chaos.aip.org/chaos/copyright.jsp