Available online at www.sciencedirect.com
Procedia
Engineering Procedia Engineering 00 (2011) 000–000 Procedia Engineering 28 (2012) 813 – 819 www.elsevier.com/locate/procedia
2012 International Conference on Modern Hydraulic Engineering
Optimization Calculation on Maneuverability Index of Small Scale Ship Model CAI Chuanga, ZHAO Chuan-bo, CAI Xin-yong, a* Chongqing JiaoTong University, Chongqing, 400041, China
Abstract The small-scale self-propelled ship model plays an important role in studying the navigability of a waterway. The model is usually calibrated with Z-type tests. In order to improve traditional Z-type tests, this paper developed new methods for estimating ship model maneuverability indexes. Based on momentum theorem, all parameters such as rudder angle, drift angle, heading angle associate with turning quality index, K, and turning lag index, T, were simplified to be related to the time parameters associated with ship movement. The methods were verified with observed data based on real ships.
© © 2012 2011Published Publishedby byElsevier ElsevierLtd. Ltd.Selection and/or peer-review under responsibility of Society for Resources, Environment and Engineering Open access under CC BY-NC-ND license. Keywords: Small scale ship model; ship maneuverability; maneuverability index; Z type test;rudder angle
1. Introduction Using small scale self-propelled ship model to research the problem of navigation was a widely used Nomenclature A
small scale ship model
B
ship maneuverability
C
Z type test
*
Corresponding author. Tel.: +86-23-62652770; fax: +86-23-62650204
E-mail address:
[email protected]
1877-7058 © 2012 Published by Elsevier Ltd. Selection and/or peer-review under responsibility of Society for Resources, Environment and Engineering Open access under CC BY-NC-ND license. doi:10.1016/j.proeng.2012.01.815
814 2
CAI Chuang al. / Procedia Engineering 28 (2012) 813 – 819 Author name / et Procedia Engineering 00 (2011) 000–000
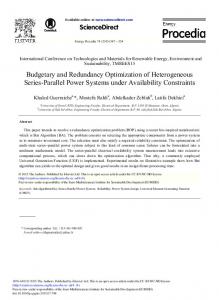
technology in developed countries[1]. Compared with the normal hydraulic model, physical ship model test could reflect the comprehensive effect authentically on the ship's navigation effected by the channel flow and boundary conditions and it could also reflect the interaction of ship and the flow conditions which was difficult to be described by hydraulic model test. Therefore, small scale ship model technology was deemed to be useful and used widely on the navigation and the design of channel regulation. The ship model maneuverability was the important indexes on ship model design and its parameters directly affected the design of model even the navigation structures[2]. Thus, the purpose of this paper was to optimize the maneuverability index and drew relevant empirical formula combining theory and ship model test[3]. 2. Traditional Z type test and other related questions 2.1. Analysis of the test results Traditional Z type test steps (1). To be maintaining constant voyage with stated speed[4]. (2). Turn the rudder right for angle10oand maintained. (3). Turn the rudder right for angle 10o and maintained when the angle of ship head turn left to maximum angle 10o. (4). So again and again. In the process of the test, the time of the rudder angle reached the designated location, the characteristics time of turning head and the angle of inertia exceed should be accurated record. Drew the curve —t, ψ—t with these data as Fig2.1 max
20 10
te e
r(0)
t1 t2
head angle
t5
r(0)
t6
r(0)
0 -10
max t''e e''
ta
t rudder angle
t3
-20 Fig.1. the test curve of —t and
t4 r(0)
t7
t8
t'e e' max
—t
In the chart above, ta was the initial rotary time of the rudder , that was the time needed for the ship turning certain angle after turning the rudder for the angle .The greater ta the worse of the initial turning function and vice versa. The angle of inertia exceed and the lag time of turning head could be used for evaluating the ability of ship inhibitory deflection[5].The angle of inertia exceed refer to the difference between the instantaneous angle steering opposite rudder and the maximum heading angle . As shown in figure ψ1, ψ2, ψ3. The lag time of turning head T refer to the time intervals between the instantaneous time of the rudder passing the position of zero angle to the maximum turning angle as shown in figure TL, TL2, T.
815 3
CAI Author Chuangname et al./ /Procedia ProcediaEngineering Engineering00 28(2011) (2012)000–000 813 – 819
2.2. Calculation the K and T index Analysed the results of Z type test with the method of K—T, that was the standard method of K—T .If considering the fixed rudder of rudder angle r , the approximation equation of the movement of ship
maneuverability should be
T r r
K ( r )
Parameters: r —angle acceleration velocity of rotation r —angle velocity of rotation The integral style
The results
t
0
t
T r r 0
t
0
K ( r )
t T r t r 0 t 0 K r t 0 0 dt (1) Integrated 0→ t e , 0→ t e the results would be t te K 0e dt K r te t te K 0e dt K r te
(1)
(2) (3)
(4)
(2) Calculated the two equations and the results K and r would be record as K6,8。 (3) Integrated t from 0→tethe results would be
te
te K dt K r te 0
(5)
Took the r to above equation and we could get the results K recorded as K4 , then take the average results K6,8 and K4 to this test as the final K.
K= The result T of this test would be
T
1 K6,8 +K 4 2
1 1 T4 T6 T8 2 2
(6)
(7)
2.3. Related problems of theoretical calculation (1) The model must met the Reynolds number similar at the same time met the gravity similar conditions .The Reynolds number always be smaller than that was for the real ship[6]. (2)As known by the above figure, the initial rotary time of the ship ta was influenced by inertia, the time of the initial turning must greater than the ship model .So the index of K, T calculated through the ship model must be less than the real ship. (3)The test conditions of Z style test demanded rigorous and the real wind and waves conditions were considered more complicated than the test which was affected the actual value of K, T index[7].
816 4
CAI Chuang al. / Procedia Engineering 28 (2012) 813 – 819 Author name / et Procedia Engineering 00 (2011) 000–000
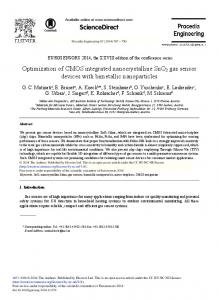
3. Optimization calculation of K and T index This theory based on momentum theorem[8] and simplified all relevant parameters of K, T index to time parameter which was concise, clear and significance. The momentum theorem of real ship would be
Fig.2. the coordinate system of ship motion
d dVi V F , Fi dt dt
(8)
MVx -MVx cos FxT x 2 2 , T = T x T y MVy -MVy sin FyT y MVx -MVx cos FxT x 2 2 , T = T x T y MVy -MVy sin FyT y
K=
T +T T
1+
(9)
(10)
T T
(11)
MVx -MVx cos FxT x 2 2 (12) , T = T x T y MVy -MVy sin FyT y T T= (13) T Here , mean the ship heading angle, means the rudder angle, mean ship drift angle, V mean the velocity vector of ship of gravity, T mean the time for ship head turning the angle , T mean the time for rudder turning the angle
, T
mean the time for drifting the angle
. Simulated K and T
index of real ship and fleet using the above formula was shown in Table1. Compared with the test data of West branch and the model simulation as shown the following diagram[17-19]. The model and test data
8175
CAI Chuang et al. // Procedia Procedia Engineering 28 (2011) (2012) 000–000 813 – 819 Author name Engineering 00
obtained very well fitting and this method is feasible [9]. /
/
with 15 ° rudder of the real ship and the model of three gorges project
Table 1. Simulation of the parameters K and T Fleet Real ship 1/100Ship model
Nine barges Six barges Threebarges Nine barges Threebarges Nine barges
1/110Ship Model
Six barges
Threebarges
Rudder area
Weight(kg)
Velocity(m/s)
Head angle
Rudder angle
Drift angle
K′
T′
100 % 100 % 100 % 100 % 80 %* 100 % 80 %* 100 %
3000 2000 1000 30 30 10 10 27
3.155 3.567 4.289 0.3155 0.3155 0.4289 0.4289 0. 3008
15 15 15 15 15 15 15 15
15 15 15 15 15 15 15 15
10 10 10 10 10 10 10 10
1.482 1.574 1.626 1.390 1.358 1.475 1.420 1.425
0.635 0.650 0.677 0.552 0.598 0.620 0.699 0.520
80 %* 60 % 100 % 80 %* 60 % 100 % 80 %* 60 %
27 27 18 18 18 9 9 9
0.3008 0.3008 0.3401 0.3401 0.3401 0.4089 0.4089 0.4089
15 15 15 15 15 15 15 15
15 15 15 15 15 15 15 15
10 10 10 10 10 10 10 10
1.414 1.398 1.466 1.445 1.430 1.485 1.466 1.450
0.635 0.688 0.570 0.666 0.700 0.625 0.715 0.765
/
/
Table 2. Comparison of the parameters K and T Rudder area
K′ Val ue
Deviation
Nine barges
100 %
1.540
――
0.640
――
0.761
――
3.155
Sixbarges
100 %
1.640
――
0.653
――
0.801
――
3.567
Threebarges
100 %
1.680
――
0.695
――
0.789
――
4.289
Nine barges
100 %
1.408
- 8.57
0.564
-11.88
0.749
- 1.57
0.3155
80 %*
1.371
-10.97
0.646
+ 0.94
0.674
-11.40
0.3155
100 %
1.498
-10.83
0.638
- 8.20
0.742
- 5.96
0.4289
\
Realship
1/100Ship model
with 15 ° rudder of the real ship and the model of three gorges project
Three barges Nine barges
1/110Ship Six barges mode Three barges
T′ Value
P Deviation
Value
Velocity(m/s)
Deviation
80 %*
1.451
-13.63
0.716
+ 3.02
0.699
-15.20
0.4289
100 %
1.453
-5.65
0.531
- 16.90
0.797
+4.73
0.3008
80 %*
1.430
-7.14
0.644
+0.40
0.704
-7.49
0.3008
60 %
1.404
-8.33
0.694
+8.40
0.660
-13.27
0.3008
100 %
1.478
-9.90
0.580
-11.17
0.774
-3.37
0.3401
80 %*
1.451
-11.52
0.670
+2.63
0.697
-12.98
0.3401
60 %
1.439
-12.36
0.726
+11.23
0.658
-17.88
0.3401
100 %
1.494
-11.07
0.635
-8.70
0.742
-5.99
0.4089
80 %*
1.471
-12.42
0.721
+3.76
0.675
-14.48
0.4089
60 %
1.451
-13.67
0.789
+14.82
0.628
-20.34
0.4089
818 6
CAI Chuang al. / Procedia Engineering 28 (2012) 813 – 819 Author name / et Procedia Engineering 00 (2011) 000–000
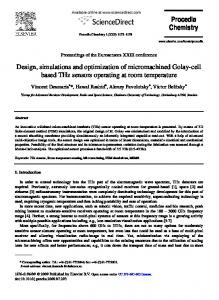
Fig. 3. The simulation curves of K
/
/
Fig. 4. The simulation curves of T
The error analysis The error equation would be
y —experimental value
xi —simulation value
y f x1 , x2 ,...xn
(14)
819 7
CAI Author Chuangname et al./ /Procedia ProcediaEngineering Engineering00 28(2011) (2012)000–000 813 – 819
Taylor series
y
f f f x1 x2 ... xn x1 x2 xn
(15)
The relative error
y f x1 f x2 f xn f f f ... = 1 2 ... n y x1 y x2 y xn y x1 x2 xn
(16)
Take the experimental value and the simulation value to above equation
y f xk1 f xk 2 f xkn ... = = 2% y xk1 y xk 2 y xkn y y f xt1 f xt 2 f xtn ... t max = = 4% y xt1 y xt 2 y xtn y k max
(17) (18)
As known above the K, T index simulated through the model was approximate and the model test was feasible [10]. 4. Conclusion K, T index was an important index to express the quality of ship maneuverability and became common international method as its physical meaning. However, the test value usually had certain deviation to that of the real ship because of the test conditions and the influence of scale. Therefore, the method through theoretical calculation and model modification was necessary. In this paper, the author obtain K, T index using mathematical modification methods based on the theoretical calculation and Z type test. The simplified ship model corresponded with the real ship through the comparison of model and real data. References [1]ZhaoYueLin .Ship maneuvering. [M].Dalian:Dalian maritime publishing company, 2000. [2] Wu Xiuheng .Ship maneuvering and wave resistance[M]. Beijing: people's traffic publishing company 1999. [3] Garthune R S, etc. The Performance of Model Ships in Restricted Channels In Relation to the Design of a Ship [4] LiYing. Research and application on the capacity of Inland channel[D]. Nanjing: Hehai university, 2006 [5] Li Xiaobiao. Simulation of the test data of the velocity of ship model [J]. Journal of the Yangtze river academy, 2003, 16 (3) : 7 ~ 9. [6] Li Yibing,.Wang YuLin. The application of the model ship test technology in the research of port engineering [J]. Port, 2004, 3: channel 8 to 13. [7] International Towing Tank Conference. Uncertainty analysis for experimental fluid dynamics [8] Hong Biguang,YuYang. Statistical analysis on K、T index on ship maneuvering[J]. Journal of dalian maritime, 2000, 26 (4) : 29 ~ 33. [9] CAI Chuang ,CaiRuZhe. Experimental study on navigation of ship model of regulating the risks Beaches of Yangtze river [J]. Journal of Chongqing jiaotong University , 2005, (5) : 135 ~139 [10] ShenH C .Uncertainty analysis of resistance test[J].Journal of Ship Mechanics1999,3(6)