Sep 10, 2012 - AbstractâThis paper considers the analysis and optimization of a frequency-hopping ad hoc network with a finite number of mobiles and finite ...
Optimization of a Finite Frequency-Hopping Ad Hoc Network in Nakagami Fading Matthew C. Valenti,∗ Don Torrieri,† and Salvatore Talarico∗ ∗ West
arXiv:1207.4083v3 [cs.IT] 10 Sep 2012
† U.S.
Virginia University, Morgantown, WV, USA. Army Research Laboratory, Adelphi, MD, USA.
Abstract—This paper considers the analysis and optimization of a frequency-hopping ad hoc network with a finite number of mobiles and finite spatial extent. The mobiles communicate using coded continuous-phase frequency-shift keying (CPFSK) modulation. The performance of the system is a function of the number of hopping channels, the rate of the error-correction code, and the modulation index used by the CPFSK modulation. For a given channel model and density of mobiles, these parameters are jointly optimized by maximizing the (modulation-constrained) transmission capacity, which is a measure of the spatial spectral efficiency of the system. The transmission capacity of the finite network is found by using a recent expression for the spatially averaged outage probability in the presence of Nakagami fading, which is found in closed form in the absence of shadowing and can be solved using numerical integration in the presence of shadowing.
I. I NTRODUCTION An ad hoc network or peer-to-peer network comprises autonomous systems that communicate without a centralized control or assistance. Ad hoc networks include mobile communication networks that possess no supporting infrastructure, fixed or mobile; usually each mobile has identical signal processing capability. The preferred channel access for ad hoc networks is direct-sequence or frequency-hopping (FH) spread spectrum. This paper focuses specifically on frequencyhopping spread spectrum ad hoc networks. Such networks are characterized by independent, identical, FH radios that share the same carriers and frequency channels, and are nearly stationary in location over a single hop duration. The use of spread spectrum in ad hoc networks provides the many advantages of code-division multiple-access communications [1]. Two major advantages of FH are that it can be implemented over a much larger frequency band than is possible with direct-sequence spreading, and that the band can be divided into noncontiguous segments. Another major advantage is that FH provides resistance to multiple-access interference while not requiring power control to prevent the near-far problem. Since direct-sequence and narrowband systems cannot escape the near-far problem by hopping, accurate power control is crucial in limiting the impact of the nearfar problem in cellular networks [2]. However, power control is not viable for ad hoc networks because of the lack of a centralized architecture. Therefore, direct-sequence networks require a guard zone imposed by some type of carrier-sense The authors were sponsored by the National Science Foundation under Award No. CNS-0750821 and by the United States Army Research Laboratory under Contract W911NF-10-0109.
multiple access with collision detection [3]. In contrast, FH networks can use an ALOHA-type multiple-access protocol. For FH systems, continuous-phase frequency-shift keying (CPFSK) is the preferred modulation. Frequency hopping with CPFSK offers a constant-envelope signal, a compact signal spectrum, and robustness against both partial-band and multiple-access interference [2]. CPFSK modulation is characterized by its modulation order, which is the number of possible tones, and by its modulation index h, which is the normalized tone spacing (assumed here to be constant). For a fixed modulation order, the selection of h involves a tradeoff between bandwidth and performance [4]. The resistance to frequency-hopping multiple-access interference generally increases with decreasing h while the error-rate generally decreases with increasing h. When the ad hoc network uses channel-coded CPFSK modulation, the performance is a function of not only the modulation index, but also the rate of the error-control code and the number of frequency-hopping channels. As each of these parameters influences bandwidth and energy efficiency, there is a tradeoff among them, and the main goal of this paper is to gain some insight into this tradeoff. An appropriate objective for the optimization of the network’s operational parameters is to maximize the transmission capacity [5], [6], which is a measure of the spatial spectral efficiency and is constrained in this paper to explicitly take into account the CPFSK modulation format. In contrast with the recent literature (e.g., [7], [8]), which assumes an infinite number of mobiles spread over an infinite area, in this paper the spatial extent of the network and number of mobiles are finite. Each mobile has a uniform location distribution with an allowance for the mobile’s duty factor and shadowing. The analysis uses a recent expression [9] for the exact outage probability in the presence of Nakagami fading conditioned on the network topology, which is determined by both the mobile locations and the shadowing factors. The modulationconstrained transmission capacity is found by averaging the outage probability over the network topoloty, which is possible in closed form in certain cases (i.e., no shadowing, and interfering mobiles uniformly distributed within an annulus centered at the reference receiver) and through numerical integration in other cases (e.g., networks with shadowing). By maximizing the modulation-constrained transmission capacity, the optimal set of operating parameters (code rate, modulation index, and number of frequency channels) is found for a given channel model and density of mobiles.
The remainder of the paper is organized as follows. Section II presents a system model, which culminates in an expression for the instantaneous SINR at the reference receiver. Section III reviews a new expression [9] for the conditional outage probability; i.e., the probability that the SINR is below a threshold, given a particular set of mobile locations and shadowing factors. Section IV discusses how to remove the conditioning by averaging over the spatial and shadowing distributions. Section V discusses the modulation-constrained transmission capacity, which is the area spectral efficiency of the network and the metric used for the optimization. Section VI describes the procedure used for determining the combination of parameters that maximize the transmission capacity and gives optimization results for several channel and network models. II. N ETWORK M ODEL The network comprises M + 2 mobiles that include a receiver, a reference (source) transmitter X0 , and M interfering transmitters X1 , ..., XM . The coordinate system is selected such that the receiver is at the origin. The variable Xi represents both the ith transmitter and its location, and ||Xi || is the distance from Xi to the receiver. While the interferers can be located in any arbitrary region, we assume they are located in an annular region with inner radius rex and outer radius rnet . A nonzero rex may be used to model the effects of interference-avoidance protocols [3]. Xi transmits a signal whose average received power in the absence of fading and shadowing is Pi at a reference distance d0 . At the receiver, Xi ’s power is ρi
=
ξi /10
Pi gi 10
f (||Xi ||)
(1)
where gi is the power gain due to fading, ξi is a shadowing coefficient, and f (||Xi ||) is a path-loss function. Each gi = a2i , where ai is Nakagami with parameter mi , and E[gi ] = 1. In Rayleigh fading, mi = 1 and gi is exponential. In the presence of log-normal shadowing, the {ξi } are i.i.d. zeromean Gaussian with standard deviation σs dB. In the absence of shadowing, ξi = 0. For d ≥ d0 , the path-loss function is expressed as the attenuation power law � �−α d (2) f (d) = d0 where α > 2 is the attenuation power-law exponent, and d0 is sufficiently large that the signals are in the far field. Channel access is through a synchronous frequency-hopping protocol. The hopping is slow, with multiple symbols per hop, which is a more suitable strategy for ad hoc networks than fast hopping [2]. An overall frequency band of B Hz is divided into L frequency channels, each of bandwidth B/L Hz. The transmitters independently select their transmit frequencies with equal probability. Let pi denote the probability that interferer Xi uses the same frequency as the source. Let Di ≤ 1 be the duty factor of the interferer. It follows that pi = Di /L and that using a duty factor less than unity is equivalent to hopping over more than L frequencies [2].
Assuming that Di = D for all interferers, L0 = L/D denotes the equivalent number of frequency channels. It is assumed that the {gi } remain fixed for the duration of a hop, but vary independently from hop to hop (block fading). While the {gi } are independent, they are not necessarily identically distributed. The channel from each transmitting mobile to the reference receiver can have a distinct Nakagami parameter mi . The instantaneous SINR at the receiver is ρ0 (3) γ = M X N+ Ii ρi i=1
where N is the noise power and Ii is a variable that indicates the presence and type of interference (i.e. co-channel interference or adjacent-channel interference). When adjacent-channel interference is neglected, Ii = 1 when Xi selects the same frequency as X0 , and Ii = 0 otherwise. It follows that Ii is Bernoulli with probability P [Ii = 1] = pi . Substituting (1) and (2) into (3), the SINR is γ
=
g0 Ω0 M X Ii gi Ωi Γ−1 +
(4)
i=1
r0α P0 /N
where Γ = is the signal-to-noise ratio (SNR) when the transmitter is at unit distance and fading and shadowing are absent, Ωi = (Pi /P0 )10ξi /10 ||Xi ||−α is the normalized power of Xi , and Ω0 = 10ξ0 /10 ||X0 ||−α . III. C ONDITIONAL O UTAGE P ROBABILITY Let β denote the minimum SINR required for reliable reception and Ω = {Ω0 , ..., ΩM } represent the set of normalized powers. An outage occurs when the SINR falls below β. Conditioning on Ω, the outage probability is � � (5) �o = P γ ≤ β Ω . Because it is conditioned on Ω, the outage probability depends on the locations of the mobiles and the shadowing factors, which have dynamics over timescales that are much slower than the fading. By defining a variable M X Z = β −1 g0 Ω0 − Ii gi Ωi (6) i=1
the conditional outage probability may be expressed as � � � �o = P Z ≤ Γ−1 Ω = FZ Γ−1 Ω
(7)
which is the cumulative distribution function (cdf) of Z conditioned on Ω and evaluated at Γ−1 . Under the restriction that the Nakagami parameter m0 of the source’s channel is integer-valued, the complementary cdf of Z conditioned on Ω is shown in [9] to be � F¯Z z Ω
= e−β0 z
m 0 −1 X j=0
j
(β0 z)
j X z −k Hk (Ψ) k=0
(j − k)!
(8)
0
where β0 = m0 β/Ω0 , =
Hk (Ψ)
=
� �−1 Ωi β0 +1 mi M X Y G`i (Ψi ),
(9) (10)
i=1 `i ≥0 PM i=0 `i =k
the summation in (10) is over all sets of positive indices that sum to k, and i 1 − pi (1 − Ψm ) for ` = 0 � i �` (11) G` (Ψi ) = i +` pi Γ(`+mi ) Ωi Ψm for ` > 0. i `!Γ(mi )
mi
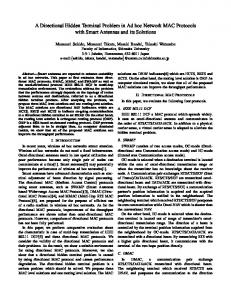
A. Examples In the following examples, the source transmitter was placed at unit distance from the receiver; i.e., ||X0 || = 1, and fifty interferers were independently placed according to a uniform distribution in an annular region with inner dimension rex = 0.25 and outer dimension rnet = 4. The resulting network is shown in the inset of Fig. 1. The Ω was determined by assuming a path-loss exponent α = 3, a common transmit power Pi = P0 , and the absence of shadowing. The equivalent number of frequency channels was set to L0 = 200, and the SINR threshold set to β = 3.7 dB. Example #1. Suppose that all signals undergo Rayleigh fading. Then mi = 1 for all i, and (8)-(11) specialize to M Y 1 + β0 (1 − pi )Ωi F¯Z (z|Ω) = e−β0 z . (12) 1 + β 0 Ωi i=1 The outage probability was found by evaluating (12) at z = Γ−1 and is shown in Fig. 1. Also shown is a curve generated by simulation, which involved randomly generating the exponentially-distributed {gi } and drawing each interferer’s hopping frequency from a uniform distribution. The analytical and simulation results coincide, which is to be expected because (12) is exact. Any discrepancy between the curves can be attributed to the finite number of Monte Carlo trials (one million trials were executed per SNR point). Example #2. Now suppose that the link between the source and receiver undergoes Nakagami fading with parameter m0 = 4. In this case, (8)-(11) must be used to find the conditional outage probability. Using the same β, L0 , and Ω as Example #1, the outage probability was found and plotted in Fig. 1. Two cases were considered for the interferer’s Nakagami coefficient: mi = 1 and mi = 4. The mi = 4 case represents the situation where the source and interferer are equally visible to the receiver, while the mi = 1 case represents a more typical situation where the interferers are not in the line-of-sight. As with the previous example, the analytical curves are verified by simulations involving one million Monte Carlo trials per SNR point.
F¯Z (z) = e
m 0 −1 X −β0 z s=0
s
(β0 z)
s X t=0
Conditional outage probability, ¡
Ψi
0
10
ï1
10
Rayleigh Nakagami Mixed
ï2
10
ï5
0
5
10 K (in dB)
15
20
Fig. 1. Conditional outage probability �o of Examples #1 and #2 as a function of SNR Γ. Analytical curves are solid while dots represent simulated values. Top curve: all channels Rayleigh. Middle curve: all channels m = 4. Bottom curve: m = 4 from source, and m = 1 from interferers. The network topology is shown in the inset. The receiver is represented by the star at the center of the radius-4 circle while the 50 interferers are shown as dots.
IV. S PATIALLY AVERAGED O UTAGE P ROBABILITY Because it is conditioned on Ω, the outage probability �o presented in the last section depends on the location of the interferers and the values of the shadowing factors. The conditioning on Ω can be removed by averaging FZ (z|Ω) with respect to Ω, which results in the average outage probability �� � � � = EΩ [�o ] = E FZ Γ−1 Ω = FZ Γ−1 . (13) Finding F¯Z (z) = 1−FZ (z) requires the following integration: ! Z Y M ¯ (14) FZ (z) = fΩi (ωi ) F¯Z (z ω)dω i=0
where fΩi (ωi ) is the pdf of Ωi and the {Ωi } are assumed to be independent. In [9], it is shown that F¯Z (z) in the absence of shadowing is given by (15) at the bottom of the page, where ci = P0 /Pi , �� � � 2 2 mi y mi + 2 α J(y) = 2 F1 mi +`i , mi + ; mi + +1; − y α α β0 (16) and 2 F1 is the Gauss hypergeometric function, which has the integral representation 2 F1 ([a, b]; c; x)
=
Γ(c) Γ(b)Γ(c − b)
Z
1
ν b−1 (1 − ν)c−b−1 (1 − xν)−a dν.
0
" # M α α i z −t X Y 2pi Γ(`i + mi )mm [J (c r ) − J (c r )] i i net ex i (1 − pi )δ`i + 2/α � 2 − r 2 )(` !)Γ(m )β (mi +`i ) m + 2 (s − t)! αc (r i i i net ex 0 `i ≥0 i=1 i α PM
i=0
`i =t
25
(17)
(15)
0
for 0 ≤ ω ≤ ∞, and zero elsewhere, where � 2 2 � 2 2 σs ln (10) σs ln (10) − 50α ln (z) √ ζ(z) = erf e 50α2 5 2ασs ln(10)
(19)
Because ||X0 || is deterministic, Ω0 = 10ξ0 /10 ||X0 ||−α is a log-normal variable with pdf �− 1 � � 10 2πσs2 2 102 log210 (||X0 ||α ω) (20) exp − fΩ0 (ω) = ln(10)ω 2σs2 for 0 ≤ ω ≤ ∞, and zero elsewhere. By substituting (20) and (18) into (14) and using the definition of β0 , the complementary outage probability is found to be (22), given at the bottom of the page, where α α ϕ(ω) = ζ (ci ωrnet ) − ζ (ci ωrex )
pi Γ(`i + mi )x−(
(23)
κ(x, t) = 2/α 2 αci (rnet
−
)
�
�
xt mi
2+α α
2 )(` !)Γ(m ) rex i i
x mi
�`i
+1
�(mi +`i ) . (24)
In order to compute the outage probability, the integral inside the product in (22) can be evaluated numerically by Simpson’s method, which provides a good tradeoff between accuracy and speed, while the second integral can be evaluated through Monte Carlo simulation. Example #3. The average outage probability is shown as a function of M for two L0 in Fig. 2. The M interferers are uniformly located within the annulus bounded by rex = 0.25 and rnet = 4. The results assume a path-loss exponent α = 3, a common transmit power Pi = P0 , and that the source is at unit distance. A mixed-fading model is assumed, i.e. m0 = 4 and mi = 1 for i ≥ 1, the SNR is Γ = 10 dB, and the SINR threshold is β = 3.7 dB. For each value of L0 , four curves are shown, one without shadowing and three with shadowing. To model log-normal shadowing, each ξi drawn from a zero-mean Gaussian distribution with standard deviation σs that varies among the set σs = {2, 4, 8} dB. From Fig. 2, it is observed that the outage probability degrades with increasing M and decreasing L0 , and that shadowing increases the average � increasing σs for the given parameters.
F¯ZM (z) =
m s 0 −1X X s=0 t=0
10
L’ =10
Average outage probability, ε
While the hypergeometric function is itself an integral, it is widely known and is implemented as a single function call in most mathematical programming languages, including Matlab. ξi /10 When shadowing is present, Ωi = c−1 ||Xi ||−α , i ≥ i 10 1, which has pdf α α 2+α [ζ (ci ωr net ) − ζ (ci ωrex )] (18) fΩi (ω) = ω − α 2/α 2 − r2 ) αci (rnet ex
L’=100
−1
10
σs = 8 dB σs = 4 dB σs = 2 dB No Shadowing −2
10
0
10
20
30 M
40
50
60
Fig. 2. Average outage probability as a function of the number of interferers M for two values L0 . For each L0 , curves are shown for the case of no shadowing, and for shadowing with three values of σs .
V. T RANSMISSION C APACITY Often, networks are constrained to ensure that the outage probability � does not exceed a maximum outage probability ζ ∈ [0, 1]; i.e., �(λ) ≤ ζ with the dependence of � on the density of transmissions λ made explicit. Under such a constraint, the maximum density of transmissions is of interest, which is quantified by the transmission capacity (TC) [5], [6]. With outage constraint ζ, the TC is τc (ζ)
= �−1 (ζ)(1 − ζ)
(25)
where �−1 (ζ) is the density of the underlying process whose spatially averaged outage probability satisfies the constraint �(λ) ≤ ζ with equality, and (1−ζ) ensures that only successful transmissions are counted. The TC is a measure of the spatial intensity of transmissions and has the units of number of (successful) transmissions per unit area. As originally defined in [5], the transmission capacity is a function of the SINR threshold β and is found without making any assumptions about the existence of any particular type of modulation or channel coding. In practice, the SINR threshold is a function of the modulation and coding that is used. Let C(γ) denote the maximum achievable rate that can be supported by the chosen modulation at an instantaneous SINR of γ assuming equally likely input symbols; i.e., it is the modulation-constrained capacity or symmetric-information rate. If a rate R code is used, then an outage will occur when C(γ) ≤ R. Since C(γ) is monotonic, it follows that β is the value for which C(β) = R, and therefore we can write β = C −1 (R). If it is assumed that each codeword is
� �� �s Y � � Z Z ∞ � M � z −t X ∞ βm0 z βm0 z βm0 exp − (1 − pi )δ`i + κ ω, ϕ(ω)dω fΩ0 (y)dy. (s − t)! y y y 0 0 i=1 `i ≥0 PM i=0 `i =t
(22)
transmitted using one hop, then the outage probability with SINR threshold β = C −1 (R) provides a good prediction of the codeword error rate. Frequency-hopping systems often use noncoherent CPFSK modulation [4], [2]. The maximum achievable rate of noncoherent CPFSK is given in [4] for various modulation indices h, where it is called the symmetric information rate. In particular, Fig. 1 of [4] shows the symmetric information rate of binary CPFSK as a function of γ for various h. To emphasize the dependence of the capacity on h, we use C(h, γ) in the sequel to denote the rate of CPFSK with modulation index h. For any value of h, the value of the SINR threshold β can be found from the corresponding curve by finding the value of γ for which C(h, γ) = R. For instance, when R = 1/2 and h = 1, the required β = 3.7 dB. In [10], it was found that in practice, and over a wide range of code rates, turbocoded noncoherent CPFSK is consistently about 1 dB away from the corresponding modulation-constrained capacity limit. Thus, the β required in practice will generally be higher than the value obtained from the capacity limit by a small margin. For instance, if a 1 dB margin is used, then the SINR threshold for noncoherent binary CPFSK with R = 1/2 and h = 1 should be set to β = 4.7 dB. When accounting for modulation and coding, the maximum data transmission rate is determined by the bandwidth B/L of a frequency channel, the spectral efficiency of the modulation, and the code rate. Let η be the spectral efficiency of the modulation, given in symbols per second per Hz, and defined by the symbol rate divided by the 99 percent-power bandwidth of the modulation1 . The spectral efficiency of CPFSK can be found by numerically integrating the normalized powerspectral densities given in [2], or since we assume many symbols per hop, by Equation (3.4-61) of [11] and then inverting the result. To emphasize the dependence of η on h, we denote the spectral efficiency of CPFSK as η(h) in the sequel. When combined with a rate-R code, the spectral efficiency of CPFSK becomes Rη(h) (information) bits per second per Hz, where R is the ratio of information bits to code symbols. The data rate supported by the channel is Rη(h)B/L bits per second. The average data rate, or throughput, must account for the duty factor D and only count correct transmissions. Hence, the throughput is Rη(h)B(1 − �) Rη(h)BD(1 − �) = . (26) L L0 The modulation-constrained transmission capacity is the throughput multiplied by the node density, T
=
τ (λ)
= λT =
λRη(h)B(1 − �) . L0
(27)
2 2 where λ = M/(π(rnet − rex )) is the number of interferers per unit area. In contrast with (25), this form of transmission capacity explicitly takes into account the code rate R, as well as the spectral efficiency of the modulation η(h). It 1 Percent-power bandwidths other than 99 can be used, but will influence the amount of adjacent-channel interference.
furthermore accounts for the hopping bandwidth B/L0 . Rather than constraining outage probability, τ (λ) and the outage probability vary with the node density λ. Since it accounts for the actual system bandwidth B, (27) assumes units of bps/m2 . By dividing by bandwidth, the normalized modulation-constrained transmission capacity τ 0 (λ)
=
λRη(h)(1 − �) τ . = B L0
(28)
takes on units of bps/Hz/m2 . However, unlike (25), τ 0 (λ) is in terms of information bits rather than channel bits. VI. N ETWORK O PTIMIZATION For a particular spatial distribution and channel model, there will be a set of (L0 , R, h) that maximizes the normalized TC τ 0 (λ). Finding the optimal set of parameters is challenging because the search space is large. However, in [12], we found that the optimization surface is convex in the case of unshadowed Rayleigh fading, and further experiments have confirmed that the surface is still convex in the presence of shadowing and Nakagami fading. When the search space is convex, the optimal set of (L0 , R, h) can be found as follows: 1) For each L0 , R, and h select the endpoints for the search interval. Initially, the endpoints are widely separated to ensure that the optimal point lies in the search interval. 2) Compute τ 0 (λ) for the endpoints and the midpoint of the interval of one of the parameters in the set (L0 , R, h). 3) For the same parameter of the set (L0 , R, h) used in step 2, move the midpoint of the interval towards the endpoint that gives higher τ 0 (λ). Reduce the size of the interval by moving the endpoints closer. 4) Repeat step 2 and 3 recursively for all the parameter in the set (L0 , R, h), until the following conditions are both satisfied: a) The midpoints of all three intervals are the same as in the previous iteration; b) The difference between the endpoints and the midpoint of the interval is equal to a given tolerance. Optimization results were obtained for M = 50 interferers at a fixed SNR of Γ = 10 dB. The networks had an inner radius of rex = 0.25 and one of two maximum radii: rnet = 2, which creates a dense network, or rnet = 4, which creates a sparser network. Three sets of fading coefficients were considered: mi = 1 for all transmitters (universal Rayleigh fading), mi = 4 for all transmitters (universal Nakagami fading), and a combination of m0 = 4 for the source and mi = 1 for the interferers (mixed fading). Unshadowed (σs = 0 dB) and shadowed (σs = 8 dB) environments were examined. The results of the optimization are shown in Table I. For each set of parameters, the (L0 , R, h) that maximize the TC are listed, along with the corresponding normalized TC 0 τopt . In addition to showing the TC when using the optimal 0 is shown for a typical parameters, the normalized TC τsub 0 choice of parameters: (L , R, h) = (200, 1/2, 1).
TABLE I R ESULTS OF THE O PTIMIZATION FOR M = 50 INTERFERERS . T HE NORMALIZED TC τ 0 IS IN UNITS OF BPS / K H Z -m2 . rnet 2
σs 0 8
4
0 8
m0 1 4 4 1 4 4 1 4 4 1 4 4
mi 1 4 1 1 4 1 1 4 1 1 4 1
L0 32 42 36 23 28 24 12 15 13 9 10 9
R 0.62 0.66 0.65 0.72 0.76 0.68 0.54 0.50 0.50 0.66 0.62 0.65
h 0.59 0.59 0.59 0.59 0.59 0.59 0.59 0.59 0.59 0.59 0.59 0.59
0 τopt 15.90 17.37 20.15 19.39 19.74 22.15 9.83 10.83 12.03 10.62 11.05 12.35
τ10 13.57 14.67 16.96 16.68 16.98 19.23 7.98 8.63 9.57 8.94 9.10 10.41
0 τsub 3.34 4.12 4.19 3.00 3.43 3.46 0.90 1.13 1.13 0.78 0.91 0.91
When R is related to β through the modulation-constrained AWGN capacity, the optimization assumes Gaussian interference and capacity-achieving codes. However, as mentioned in Section V, actual systems require a threshold that is higher than this ideal value by some margin. The column labeled τ10 gives the normalized TC when a 1 dB margin is used with the listed values of (L0 , R, h). A modest loss in TC is observed when this margin is used. The results shown in Table I highlight the importance of parameter optimization. The TC is improved by a factor of 5-10 by selecting optimal, rather than arbitrary parameters. The influence of the fading distribution can be observed. Performance is worst under the assumption that all channels undergo Rayleigh fading, but this is a pessimistic assumption. Performance improves when all channels have a common mi = 4, but it is unrealistic to assume that all interferers are in the line-of-sight. Performance is further improved when the interferers undergo Rayleigh fading while the source undergoes better than Rayleigh fading (m0 = 4). The optimal modulation index is h = 0.59 for all network configurations, which coincides with the optimal value found in [4] for Rayleigh fading. The optimal L0 is larger for denser networks and when the signals become more line-of-sight. The denser network requires a higher R than the sparser network. At first inspection, the last result may seem counter-intuitive. One would ordinarily expect a denser network to require the error-protection of a lower-rate code. However, the sparser network uses a lower value of L0 , and hence, has a higher probability of collision pi = 1/L0 . The lower-rate code used by the sparse network helps to offset this higher collision probability. Table I shows that performance actually improves in the presence of shadowing. This is because with shadowing, the outage probability is less sensitive to the choice of code rate R and the number of hopping channels L0 . While the outage probability is worse with shadowing than without for a wide range of R and L0 , when the value of R is sufficiently high and/or the value of L0 sufficiently low, the outage probability is improved with shadowing. As can be seen in Table I, the optimal values of R and L0 are larger and smaller, respectively, with shadowing than without. As indicated by (27), increasing R or decreasing L0 will increase the transmission capacity for
a given outage probability and modulation index. VII. C ONCLUSION Frequency-hopping ad hoc networks play an important role in modern communications. When used with coded CPFSK, which is the typical choice of modulation, the performance depends on the modulation index, the code rate, and the number of frequency-hopping channels. These parameters are often chosen arbitrarily. The procedure disclosed in this paper enables the optimization of the parameters for a fixed network with a fixed number of users in the presence of shadowing and Nakagami fading. The key innovation facilitating the optimization is a new closed-form expression for the outage probability in the presence of Nakagami fading. The results presented in this paper are just a sample of what is possible using this methodology. For instance, other types of modulation and reception could be considered, such as nonbinary CPFSK or multi-symbol noncoherenet reception [13]. The influence of the spatial model may be studied, as can the use of directional antennas. The role of adjacent-channel interference can be studied by considering the effect of spectral splatter. The influence of receiver position can be studied by allowing it to move radially from the center of the network to the outer perimeter. REFERENCES [1] J. Andrews, S. Weber, and M. Haenggi, “Ad hoc networks: To spread or not to spread?,” IEEE Commun. Magazine, vol. 45, pp. 84–91, December 2007. [2] D. Torrieri, Principles of Spread-Spectrum Communication Systems, 2nd ed. New York: Springer, 2011. [3] D. Torrieri and M. C. Valenti, “Guard zones and the near-far problem in DS-CDMA ad hoc networks,” in Proc. IEEE Military Commun. Conf. (MILCOM), (Orlando, FL), Oct, 2012. [4] S. Cheng, R. I. Seshadri, M. Valenti, and D. Torrieri, “The capacity of noncoherent continuous-phase frequency shift keying,” in Proc. Conf. on Information Sciences and Systems (CISS), (Baltimore, MD), March 2007. [5] S. Weber, X. Yang, J. Andrews, and G. de Veciana, “Transmission capacity of wireless ad hoc networks with outage constraints,” IEEE Trans. Inform. Theory, vol. 51, pp. 4091–4102, December 2005. [6] S. Weber, J. G. Andrews, and N. Jindal, “An overview of the transmission capacity of wireless networks,” IEEE Trans. Commun., vol. 58, pp. 3593–3604, December 2010. [7] J. G. Andrews, R. K. Ganti, M. Haenggi, N. Jindal, and S. Weber, “A primer on spatial modeling and analysis in wireless networks,” IEEE Commun. Magazine, pp. 156–163, November 2010. [8] M. Win, P. Pinto, and L. Shepp, “A mathematical theory of network interference and its applications,” Proc. IEEE, vol. 97, pp. 205–230, February 2009. [9] D. Torrieri and M. C. Valenti, “The outage probability of a finite ad hoc network in Nakagami fading,” IEEE Trans. Commun., vol. 60, Nov. 2012. Preprint available at arXiv:1207.2711.. [10] D. Torrieri, S. Cheng, and M. Valenti, “Robust frequency hopping for interference and fading channels,” IEEE Trans. Commun., vol. 56, pp. 1343–1351, August 2008. [11] J. G. Proakis and M. Salehi, Digital Communications. New York, NY: McGraw-Hill, Inc., fifth ed., 2008. [12] S. Talarico, M. Valenti, and D. Torrieri, “Analysis and optimization of a frequency hopping ad hoc network in Rayleigh fading,” in Proc. Virginia Tech Symp. on Wireless Personal Commun., (Blacksburg, VA), June 2012. arXiv:1207.3451. [13] M. Valenti, S. Cheng, and D. Torrieri, “Iterative multisymbol noncoherent reception of coded CPFSK,” IEEE Trans. Commun., vol. 58, pp. 2046–2054, July 2010.