Genomics Data 7 (2016) 303–306
Contents lists available at ScienceDirect
Genomics Data journal homepage: www.elsevier.com/locate/gdata
Optimization of gene expression microarray protocol for formalin-fixed paraffin-embedded tissues Nevin Belder a,⁎, Öznur Coşkun b, Beyza Doğanay Erdoğan c, Berna Savaş b, Arzu Ensari b, Hilal Özdağ a a b c
Ankara University, Biotechnology Institute, Ankara, Turkey Ankara University, School of Medicine Department of Pathology, Ankara, Turkey Ankara University, School of Medicine, Department of Biostatistics, Ankara, Turkey
a r t i c l e
i n f o
Article history: Received 2 February 2016 Accepted 5 February 2016 Available online 6 February 2016 Keywords: Microarray Gene expression FFPE Optimization
a b s t r a c t Formalin-fixed paraffin-embedded (FFPE) tissue is a widely available clinical specimen for retrospective studies. The possibility of long-term clinical follow-up of FFPE samples makes them a valuable source to evaluate links between molecular and clinical information. Working with FFPE samples in the molecular research area, especially using high-throughput molecular techniques such as microarray gene expression profiling, has come into prominence. Because of the harmful effects of formalin fixation process such as degradation of nucleic acids, cross-linking with proteins, and chemical modifications on DNA and RNA, there are some limitations in gene expression profiling studies using FFPE samples. To date many studies have been conducted to evaluate gene expression profiling using microarrays (Thomas et al., Thomas et al. (2013) [1]; Scicchitano et al., Scicchitano et al. (2006) [2]; Frank et al., Frank et al. (2007) [3]; Fedorowicz et al., Fedorowicz et al. (2009) [4]). However, there is still no generally accepted, efficient and standardized procedure for microarray analysis of FFPE samples. This paper describes the microarray data presented in our recently accepted to be published article showing a standard protocol from deparaffinization of FFPE tissue sections and RNA extraction to microarray gene expression analysis. Here we represent our data in detail, deposited in the gene expression omnibus (GEO) database with the accession number GSE73883. Four combinations of two different cRNA/cDNA preparation and labeling protocols with two different array platforms (Affymetrix Human Genome U133 Plus 2.0 and U133_X3P) were evaluated to determine which combination gives the best percentage of present call. The study presents a dataset for comparative analysis which has a potential in terms of providing a robust protocol for gene expression profiling with FFPE tissue samples. © 2016 The Authors. Published by Elsevier Inc. This is an open access article under the CC BY-NC-ND license (http://creativecommons.org/licenses/by-nc-nd/4.0/). (continued)
Specifications Organism/cell line/tissue Sex Sequencer or array type Data format Experimental factors
Experimental features
Specifications Homo sapiens/colon FFPE tissue Female Affymetrix Human Genome U133 Plus 2.0, Affymetrix U133_X3P Array Raw microarray data (.CEL files) and analyzed data (.CHP files) HGU133 Plus 2.0+3′ IVT kit, X3P Array+3′ IVT kit, HGU133 Plus 2.0+Nugen Ovation FFPE WTA System Kit, X3P Array+ Nugen Ovation FFPE WTA System Kit and tumor vs. normal for X3P Array+Nugen Ovation FFPE WTA System Kit Four 8-μm-thick colon paraffin-embedded tissue sections were used for RNA extractions. Four different hybridization combinations were performed on four labeled samples using two different kits (Affymetrix 3′ IVT kit and the NuGEN Ovation FFPE WTA system) and two different arrays (Human
⁎ Corresponding author at: Ankara University, Biotechnology Institute, 06100, Tandogan, Ankara, Turkey. E-mail addresses:
[email protected] (N. Belder),
[email protected] (Ö. Coşkun),
[email protected] (B.D. Erdoğan),
[email protected] (B. Savaş),
[email protected] (A. Ensari),
[email protected] (H. Özdağ).
Consent Sample source location
Genome U133 Plus 2.0 and U133_X3P arrays). Three of these four samples have matched control samples. Gene expression data analysis was also performed for these three matched samples. Totally, this dataset includes 19 arrays. Informed consent was obtained from all patients. Ankara University, Faculty of Medicine, Department of Pathology, Ankara, Turkey
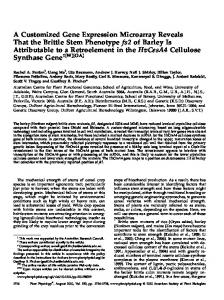
1. Direct link to deposited data http://www.ncbi.nlm.nih.gov/geo/query/acc.cgi?acc=GSE73883 2. Experimental design, materials and methods 2.1. Experimental design A comparison study was conducted assessing two different microarray chips and amplification kits for performance comparison. All steps are represented in Fig. 1.
http://dx.doi.org/10.1016/j.gdata.2016.02.006 2213-5960/© 2016 The Authors. Published by Elsevier Inc. This is an open access article under the CC BY-NC-ND license (http://creativecommons.org/licenses/by-nc-nd/4.0/).
304
N. Belder et al. / Genomics Data 7 (2016) 303–306
RNA was extracted from four sporadic colorectal cancer FFPE samples using Qiagen RNeasy extraction kit with modified deparaffinization step. The yield and quality of RNA samples were evaluated using a Nanodrop Spectrophotometer and a Agilent 2100 Bioanalyzer. We assessed microarray performance by comparing four combinations of two different cDNA preparation & labeling protocols and microarray chips. Finally, gene expression data analysis was performed for three matched samples using U133 X3+ NuGEN Ovation FFPE WTA System combination. 2.2. FFPE tissue materials FFPE tissue samples were obtained from four colon adenocarcinoma patients. Local ethical approval was obtained for using the human material (Research Ethics Committee of Medical Faculty of Ankara University, Ankara Ref: 153-4854). Four different 6–10 year old FFPE blocks were used in this study (08/40 T(TT01), 08/95 T(TT08), 09/137 T(TT24) and 10/12 T(TT31) were collected in 2007, 2005, 2009, and 2006 respectively). Three of these four samples have matched control samples (08/40 T(NT01), 08/95 T(NT08) and 10/12 T(NT31)).
disposable blade. Two of the sections were placed on per microscope slide. The tumor area containing ~ 90% tumor cells was used for macrodissection. Four sections were used for RNA extraction. Total RNA was isolated using Qiagen RNeasy FFPE kit (Qiagen, Hilden, Germany) according to the manufacturers' instructions except deparaffinization step. The deparaffinization step was optimized by comparing our laboratory deparaffinization protocol with Qiagen RNeasy FFPE kit's deparaffinization step. These comparisons and their results were given in detail in our manuscript accepted to be published in Pathology Research and Practice [5]. RNA samples extracted from FFPE tissues were analyzed in terms of RNA concentration and purity using NanoDrop ND-1000 Spectrophotometer (NanoDrop Technologies, Wilmington, DE, USA). The quality of RNA samples was assessed with RNA 6000 Nano Assay on Agilent Bioanalyzer 2100 (Agilent Technologies, Santa Clara, CA). RNA degradation degree assessment was also checked with PCR which was performed by amplifying seven different amplicon sets that produced fragments ranging from 101 to 246 bp (B2M-101 bp, HPRT113 bp, VEGFA-168 bp, MAPK14-198 bp, TCF19-201 bp, TGFB1240 bp, NCAPG-246 bp). 2.5. In vitro transcription, amplification, labeling and hybridization for gene expression analysis
2.3. Characteristics of patients Four tumor samples and three matched controls of these four samples were used for microarray analysis. All cases were sporadic colorectal cancers from female patients within the age of 27 to 48 years. The histotype of the tumors was conventional adenocarcinoma. The patients had stage III disease and 75% of the patients have left colon sided. All clinico-pathological parameters of the patients are given in Table 1. 2.4. Preparation of FFPE tissue samples and RNA extraction All steps were performed under RNase-free conditions. Four of 8 μmthick sections were cut from FFPE blocks, on a microtome with a
The RNA samples extracted from FFPE samples were amplified and labeled using the 3′ IVT kit (Affymetrix, Santa Clara, CA) and the Ovation FFPE WTA System (NuGEN San Carlos, CA, USA). Human Genome U133 Plus 2.0 and U133_X3P arrays were used for hybridization. Four combinations were used to determine which pairwise combination gives the best result in terms of percentage of present call. Four combinations depicted in Table 2 were applied on the four tumor samples. One of these four combinations was applied on the matched normal samples of three of the four samples. In the combinations where 3′ IVT kit (Affymetrix, USA) is used manufacturer's protocol
Fig. 1. A schematic representation of entire experimental workflow.
N. Belder et al. / Genomics Data 7 (2016) 303–306
305
Table 1 Clinicopathological features of four colorectal cancer patients. Sample name
Tissue
Age
Gender
Histology
Tumor location
Grade
Stage
TT01 tumor_08/40 TT08 tumor_08/95 TT24 tumor_09/137 TT31 tumor_10/12
Colorectal FFPE Colorectal FFPE Colorectal FFPE Colorectal FFPE
26 46 32 48
Female Female Female Female
Adenocarcinoma Adenocarcinoma Adenocarcinoma Adenocarcinoma
Right sided colon Left sided colon Left sided colon Left sided colon
Grade III Grade II Grade I Grade II
Stage IIIB Stage IIIB Stage IIIB Stage IIIB
was followed for all steps. Secondly we assessed NugenRibo-SPIA method for amplification process. In the combinations where Ovation FFPE WTA System (NuGEN San Carlos, CA, USA) is used manufacturer's protocol was followed for the amplification and labeling steps except for the fragmentation performed from 3.5 μg of input cDNA instead of 4– 5 μg recommended in Nugen Ovation FFPE WTA System user guide. The starting RNA amount for cDNA synthesis, the hybridized cRNA (Affymetrix) and cDNA (Nugen) amount and hybridization conditions are given in Table 2. For all four combinations the arrays were washed and stained using user-prepared wash and stain reagents as specified in the Affymetrix GeneChip® Expression Wash, Stain and Scan User Guide (P/N 702731 Rev. 4, pp. 14–20). Gene Chips Fluidics Station 450 is used for the wash and stain step. The hybridized arrays were scanned by a GeneChip Scanner 3000 7G and images were generated using Affymetrix GeneChip Command Console (AGCC) program. 2.6. Statistical data analysis Two different amplification kits and two different Affymetrix microarray platforms were combined separately for four samples and performance comparison was performed for each pairwise comparison. In
addition, we had three samples that were the matched controls of four samples. These three matched normal controls were independently isolated with Qiagen RNeasy FFPE kit, amplified, fragmented and labeled using Nugen Ovation FFPE WTA System for another larger microarray gene expression study. These samples were also hybridized to U133_X3P Array. Gene expression microarray analysis was carried out for three matched tumor and control samples. Totally, our GEO entry has raw data for 19 arrays and 11 of them are for U133_X3P Array and 8 of them are for U133 Plus 2.0. The entire microarray data set has been deposited at the Gene Expression Omnibus (GEO) database with Accession Number GSE73883. All of the raw data (CEL files) were preprocessed using AffymetrixGeneChip Command Console software (version 3.0.1). The percentage present calls were generated with Affymetrix MAS 5.0 expression algorithm. Group comparisons were performed using Student's t test and one-way ANOVA. All analyses were implemented using IBM SPSS Statistics version 20. A p b 0.005 was considered as statistically significant. Partek Genomic Suite 6.6 software (Partek Inc., St. Louis, MO, USA) was used for paired three tumor and control sample gene expression data analysis. Array data files with a .CEL extension were preprocessed
Table 2 Data file names and combinations of four colorectal cancer patients and three matched control samples.
306
N. Belder et al. / Genomics Data 7 (2016) 303–306
for background correction and quantile normalization using Robust multiarray averaging (RMA). Paired t test was performed to identify differentially expressed genes. Fold-change values of −2 to 2 at a false discovery rate of ≤5% and p-value cutoff of 0.001 were used as a filtering criteria to find statistically significantly expressed genes. We then performed unsupervised hierarchical cluster analysis for significant 504 differentially expressed genes to visualize patterns of expression in tumor and control samples. Euclidean distance and average linkage algorithm were used for clustering in the Partek Genomic Suite. 3. Discussion Here, we provide detailed description of methods for our microarray optimization and comparison study to help reusing of microarray data obtained from FFPE extracted RNA. We believe that our conducted workflow is useful and generally applicable to produce reliable gene expression data from FFPE extracted RNA. These results highlight that FFPE samples can be used as an alternative material to FF tissues for microarray gene expression studies. The entire results were also published in our recent accepted manuscript [5]. Conflict of interest The authors declare that there are no conflicts of interest.
Acknowledgments This study is supported with grant no. 109S477 from TUBITAK. Nevin Belder is supported by TUBITAK during this study. The authors thank A. Emre Akpınar for his contribution to figures and tables.
References [1] M. Thomas, M. Poignée-Heger, M. Weisser, S. Wessner, A. Belousov, An optimized workflow for improved gene expression profiling for formalin-fixed, paraffinembedded tumor samples. J. Clin. Bioinf. 3 (2013) 10. [2] M.S. Scicchitano, D.A. Dalmas, M.A. Bertiaux, S.M. Anderson, L.R. Turner, R.A. Thomas, et al., Preliminary comparison of quantity, quality, and microarray performance of RNA extracted from formalin-fixed, paraffin-embedded, and unfixed frozen tissue samples. J. Histochem. Cytochem. 54 (2006) 1229–1237. [3] M. Frank, C. Döring, D. Metzler, S. Eckerle, M.L. Hansmann, Global gene expression profiling of formalin-fixed paraffin-embedded tumor samples: a comparison to snap-frozen material using oligonucleotide microarrays. Virchows Arch. 450 (2007) 699–711. [4] G. Fedorowicz, S. Guerrero, T.D. Wu, Z. Modrusan, Microarray analysis of RNA extracted from formalin-fixed, paraffin-embedded and matched fresh-frozen ovarian adenocarcinomas. BMC Med. Genet. 2 (2009) 23. [5] N. Belder, Ö. Coskun, B.D. Erdogan, B. Savas, A. Ensari, H. Özdag, From RNA Isolation to microarray analysis: comparison of methods in FFPE tissues. Pathol. Res. Pract. (2015), http://dx.doi.org/10.1016/j.prp.2015.11.008.