Available online at www.sciencedirect.com
ScienceDirect Materials Today: Proceedings 5 (2018) 4971–4985
www.materialstoday.com/proceedings
ICMPC 2017
Optimization of Milling Operations Using Artificial Neural Networks (ANN) and Simulated Annealing Algorithm (SAA) Venkatesh Mundadaa*, Suresh Kumar Reddy Naralab*
a
Software Engineer, Netcracker Technology, Alumni of BITS Pilani 2015 BE Mechanical batch, Hyderabad-500084, India b Department of Mechanical Engineering, BITS Pilani Hyderabad-500078, India
Abstract
Process modelling and optimization are among the two important main issues in manufacturing. Optimization of process parameters not only increases the efficacy for machining economics, but also the product quality to a great extent. In this context, an effort has been made in the current research work to optimize the surface roughness value using Simulated Annealing and Neural Networks taking cutting speed, feed rate, tool rake angle and nose radius as input machining parameters. With the experimental data, objective function in the form of mathematical model is formulated by Response surface methodology. The response model of the system with independent variables is developed in the form of second order equation using regression analysis with the available experimental data and the statistical validation is done. Simulated Annealing and Artificial Neural Network Algorithms are used to optimize the response. The predicted values using genetic algorithm [10], simulated annealing and neural network algorithm are compared and analysed. The predicted values are in good agreement with the experimental values. It can be concluded that the artificial neural network, with the optimum structure, is a helpful approach to predict a target specially the surface roughness of the work piece for different cutting conditions and tool geometry. © 2017 Elsevier Ltd. All rights reserved. Selection and/or Peer-review under responsibility of 7th International Conference of Materials Processing and Characterization. Keywords:End milling; Tool geometry; Artificial neural network; Simulated annealing; Artificial intelligence; Optimization; Prediction
* Corresponding author. Tel.: +91-40-66303565; +91-9603642928 E-mail address:
[email protected] 2214-7853© 2017 Elsevier Ltd. All rights reserved. Selection and/or Peer-review under responsibility of 7th International Conference of Materials Processing and Characterization.
4972
Venkatesh et al., NSK Reddy et al./ Materials Today: Proceedings 5 (2018) 4971–4985
Nomenclature a cutting speed exponent in mathematical model ANN Artificial neural network b feed rate exponent in mathematical model c radial rake angle exponent in mathematical model C constant in mathematical model D nose radius exponent in mathematical model dof degree of freedom F feed rate, mm/min R nose radius, mm Ra measured value of surface roughness, mm Rae estimated value of surface roughness, mm S cutting speed, m/min SA Simulated annealing x1 logarithmic transformation of cutting speed x2 logarithmic transformation of feed rate x3 logarithmic transformation of radial rake angle x4 logarithmic transformation of nose radius Y machining response, mm Y2 estimated response based on second order model, mm Response function ∝ Radial rake angle, degree ∈ Experimental error
1. Introduction Machining is one of the important aspects of any production activity. Among various machining processes, milling is widely used process to produce complex geometries in various applications of molds and dies, turbine rotors etc., [1]. The important outcome parameter of any machined component is surface roughness, whose value is essential to be determined before the component being used. Different values of surface finish are required based on the type of application. The same may vary with the type of machine tool used. All the surfaces may not have functional requirements and need not be equally finished. Surface roughness has a considerable effect on the functional characteristics of products such as friction, wearing, lubrication, heat transmission, light reflection, resistant fatigue; the product quality is required to be at high level [2]. The achievement of good quality of a surface is significantly a key factor in evaluating the productivity of machine tool and machined parts [3, 4]. The cutting parameters (cutting speed, feed rate, depth of cut) will have a major effect on final surface finish of the machined component. There are several other input cutting parameters on which surface roughness is greatly affected such as cutting phenomena, which includes friction in the cutting zone, cutting force variation, cutting chip formation, accelerations. The metallurgical properties of the materials, geometry of the work piece and the cutting tool will also influences the output parameter under cutting consideration [5, 6, 7, 8, 9]. The operating parameters are cutting speed, feed rate, depth of cut etc., that do not violate any of the constraints that may apply to the process and satisfy objective criteria such as minimum machining time or minimum machining cost or the combined objective function of machining time and cost. Using the available resources at minimum cost and producing maximum output is optimization. It is the complex process, where analytical models cannot give the desired results in modeling. To optimize the cutting parameters in the machining process, many researchers have used Response Surface Methodology (RMS) and Statistical Regression techniques. Using these methods cannot overcome the nonlinearity of relationship between cutting conditions and output parameters. Simulated annealing and Artificial Neural Networks are among the alternative methods to overcome above difficulties.
Venkatesh et al., NSK Reddy et al / Materials Today: Proceedings 5 (2018) 4971–4985
4973
Various researchers have studied the influence of the different input parameters under dry conditions machining process [5, 6, 7, 8, 9]. To obtain the best possible tool geometry and cutting conditions in dry milling Reddy et al have used Genetic Algorithm (GA) technique using the surface roughness models. To predict the surface roughness of the machined part, mathematical models have been developed using response surface methodology S. Rajakarunakaran et al. [11, 12] investigated the operating parameters for milling operations and optimized the process using Nelder Mead Simplex and Simulated Annealing algorithms. N.V. Lakal et al. [13] has developed the surface roughness prediction model using regression modeling and optimization by simulated annealing and the predicted values obtained from surface roughness model are compared with experimental results. In certain metal cutting operations, the effectiveness of cost, quality and time altogether largely depends upon optimum selection of cutting parameters [14]. The process model in conventional optimization techniques sometimes may not correspond to the machine specific conditions. Hence, they have overcome this conflict by using Artificial Neural Networks (ANN). ANN predicts values for a particular set of network parameters, obtained from a set of process variables. There are many applications of machine learning where Neural Networks (NN) algorithm [15, 16] has been implemented. In order to find the capability of ANN for the optimization of machining process, several studies related to the modeling and optimizing issues are reviewed. Ilhan Asilturk and Mehmet Cunkas [17] predicted the surface roughness value in turning operation using scaled conjugate gradient (SCG), Levenberg–Marquardt (LM) network algorithms with 3-5-1 and 3-4-1 network structures. S. Ayukt et al [18] used BP, SCG network algorithm with 3-35-3 network structure for face milling operation. Sanjay and Jyoti [19] utilized feed forward back propagation algorithm to predict the surface roughness during drilling operation and the same algorithm was used by Durmus Karayel [19] for turning. Benardos P. G. et al [20] made use of back propagation algorithm for face milling operation to anticipate the surface finish. Based on the literature review, it can be concluded here that, the optimization of process parameters for minimum surface roughness is one of the pressing challenges for modern science and technology. Moreover, predictive capability of the surface roughness model will be improvedby incorporating the tool geometry in the modelling. In view of this, the current research work presents theoptimization of end milling parameters including process parameters (cutting speed, feed) and tool geometry (radial rake angle and nose radius) to obtain required conditions for achievingthe best possible surface quality under the given constraints. First, the experimental data are fed into a multi-perceptron artificial neural network where it’s trained in order to predict the unexperienced cases. Finally, a simulated annealing algorithm is used to anticipate the optimal values of the parameters. The values achieved by both the techniques along with genetic algorithms values [10] are verified experimentally. 2. Methodology And Procedure From the experimental data mathematical models have been developed using Response Surface Methodology (RSM).Using the above generated mathematical models as objective function and process constraints, the optimization can be carried out by Simulated Annealing and Neural Networks. 2.1. Postulates of Mathematical Models: RSM (response surface methodology) is a collection of mathematical and statistical techniques for empirical model building and optimization. In RSM, the initial step is to obtain asuitable approximation for the functional relationship between response and the independent input variables. The relationship between surface roughness and other independent variables can be represented by: [10]: = ∝ (1) The constants and exponents C, a, b, c, and d can be determined by the method of least squares. By experimentation and by applying regression analysis, a model of the response with independent variables is obtained. Using that second order polynomial response is developed:
4974
Venkatesh et al., NSK Reddy et al./ Materials Today: Proceedings 5 (2018) 4971–4985
=
− = +
+
+
+ +
+ +
+
+
+
+
+
+
+ (2)
Where is the estimated response based on second-order equation, ‘Y’ represents the measured surface roughness, ), , , , are the coded values of cutting speed, feed rate, rake angle, and nose =1( , , , ., are to radius, respectively, ∈ is the experimental error. The constants , , , , , be estimated by the method of least square. Validity of the model have to be tested using of statistical tests, such as the F-test, Chi-square test and so on [14] before being used in the optimization process. 2.2. Optimization using simulated annealing Simulated Annealing is a probabilistic method proposed by Kirkpatrick, Gelett and Vecchi (1983) and Cerny (1985) for finding the global minimum of a function that may possess several local minima (15). Simulated Annealing imitates the process of annealing (slow cooling of molten metal) in order to achieve minimum function value in a minimization problem. The cooling phenomenon is carried out by controlling a temperature like parameter introduced with the concept of theBoltzmann probability distribution. According to this distribution a system in thermal equilibrium at temperature T has its energy probabilistically distributed as per Equation (3). ( ) = exp(−∆ /
)
(3)
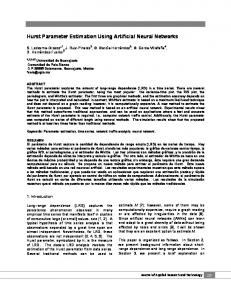
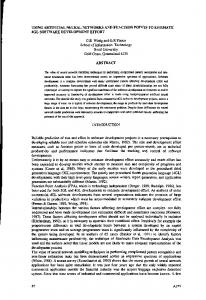
The exponential term being the Boltzmann coefficient and k is the Boltzmann constant. As per the above equation, a system at high temperature has almost uniform probability of being in any energy state, but at low temperatures it has a lower probability of being in higher energy state, as can be seen from the Figure 1. This controls the convergence of the algorithm to the global minimum.
Fig. 1.Probability distribution of being in energy state at different temperatures
As the temperature is lowered Boltzmann distribution focuses on the lowest energy state and finally converges to the only possible state as the temperature reaches close to zero. The system might switch to a new energy state with probability P, irrespective of whether it is higher or lower. This helps to escape from a local minimum in order to find a global minimum. But as the temperature is lower, it is less likely to come across a local minimum 2.3. Optimization using Neural Networks The basic structure of artificial neural network consists of multiple layers, of units: a layer of inputunits which are interconnected to a layer of hiddenunits, which are further connected to consecutive hidden layers if it exists or else to the layer of outputunits. Weight and bias between each input neuron and its next hidden layer neuron is initially assigned randomly. The activity of each hidden neuron is determined by the output of the input units and the weights between the input and the hidden units. The behaviour of the output units depends on the activity of the hidden units and the weights between the hidden and output units. In the present study Neural Network Toolbox contains the MATLAB tools are used to design the optimum neural network. Principally, obtaining the successful model of ANN totallydepends upon the process of trial and error with some factors to consider. In spite of the extensive application of the ANN model for the modelling purpose, until now there have been no clear rules for the formulation of the required ANN structure according to need.
Venkatesh et al., NSK Reddy et al / Materials Today: Proceedings 5 (2018) 4971–4985
4975
3. Experimental Design Full factorial designs of experiments are employed to perform the experiments in a planned manner. Four factors of each 3 levels were set to perform machining operation as given in table 1 and the definitions for parameter values are given in table 2. The three levels of control factors were selected based on present day manufacturing requirement. The experimental data is collected [10] and objective function is formulated in the form of mathematical model by response surface methodology. The model of response with independent variables is developed in the form of second order equation using regression analysis with the available experimental data. To optimize the response, simulated annealing algorithm and artificial neural network algorithm are used. The predicted values using genetic algorithm, simulated annealing and neural network algorithm are compared and analysed. Table 1. Experimental results Tes t
S
F
γ r
No 1 2 3 4 5 6 7 8 9 10 11 12 13 14 15 16 17 18 19 20 21 22 23 24 25 26 27
15 15 15 20 20 20 25 25 25 15 15 15 20 20 20 25 25 25 15 15 15 20 20 20 25 25 25
200 300 400 200 300 400 200 300 400 200 300 400 200 300 400 200 300 400 200 300 400 200 300 400 200 300 400
4 4 4 4 4 4 4 4 4 4 4 4 4 4 4 4 4 4 4 4 4 4 4 4 4 4 4
0.4 0.4 0.4 0.4 0.4 0.4 0.4 0.4 0.4 0.8 0.8 0.8 0.8 0.8 0.8 0.8 0.8 0.8 1.2 1.2 1.2 1.2 1.2 1.2 1.2 1.2 1.2
Resp
Tes
onse
t
(Ra)
No
0.54 0.68 0.78 0.49 0.64 0.85 0.41 0.58 0.71 0.53 0.62 0.76 0.43 0.6 0.8 0.39 0.5 0.61 0.78 0.97 1.09 0.69 0.78 0.98 0.62 0.77 0.82
28 29 30 31 32 33 34 35 36 37 38 39 40 41 42 43 44 45 46 47 48 49 50 51 52 53 54
S 150 150 150 200 200 200 250 250 250 150 150 150 200 200 200 250 250 250 150 150 150 200 200 200 250 250 250
f 200 300 400 200 300 400 200 300 400 200 300 400 200 300 400 200 300 400 200 300 400 200 300 400 200 300 400
γ 10 10 10 10 10 10 10 10 10 10 10 10 10 10 10 10 10 10 10 10 10 10 10 10 10 10 10
r 0.4 0.4 0.4 0.4 0.4 0.4 0.4 0.4 0.4 0.8 0.8 0.8 0.8 0.8 0.8 0.8 0.8 0.8 1.2 1.2 1.2 1.2 1.2 1.2 1.2 1.2 1.2
Resp
Te
onse
st
(Ra)
N
0.49 0.61 0.71 0.43 0.68 0.8 0.4 0.57 0.68 0.47 0.6 0.69 0.4 0.58 0.75 0.37 0.43 0.5 0.67 0.82 0.89 0.63 0.8 0.91 0.48 0.7 0.8
55 56 57 58 59 60 61 62 63 64 65 66 67 68 69 70 71 72 73 74 75 76 77 78 79 80 81
Resp S
f
γ
r
onse (Ra)
150 150 150 200 200 200 250 250 250 150 150 150 200 200 200 250 250 250 150 150 150 200 200 200 250 250 250
200 300 400 200 300 400 200 300 400 200 300 400 200 300 400 200 300 400 200 300 400 200 300 400 200 300 400
16 16 16 16 16 16 16 16 16 16 16 16 16 16 16 16 16 16 16 16 16 16 16 16 16 16 16
0.4 0.4 0.4 0.4 0.4 0.4 0.4 0.4 0.4 0.8 0.8 0.8 0.8 0.8 0.8 0.8 0.8 0.8 1.2 1.2 1.2 1.2 1.2 1.2 1.2 1.2 1.2
0.75 0.82 1.1 0.74 0.8 0.9 0.69 0.75 0.8 0.7 0.78 0.89 0.68 0.69 0.88 0.65 0.62 0.71 0.85 1.1 1.23 0.81 1.08 1.19 0.8 0.91 0.9
4976
Venkatesh et al., NSK Reddy et al./ Materials Today: Proceedings 5 (2018) 4971–4985
The range of values of each factor was set at three different levels, namely low, medium, and high as shown in Table 2, selected on the basis of present day manufacturing requirements. A full factorial design was employed so that all the interactions between the independent variables could be investigated. Based on this, a total number of 81 experiments in wet machining and 81 experiments in dry machining, each having a combination of different levels of factors were carried out. Table 2. Process variables and their levels S.No
Parameter
Symbol
Unit
1 2 3 4
Speed Feed Radial rake angle Nose radius
S F
m/min mm/min Degree Mm
α R
Level-I (Low) 150 200 4 0.4
Level-II (Medium) 200 300 10 0.8
Level-III (High) 250 400 16 1.2
The details of the end milling cutter same as the one used in [10]. The specimen used, their geometry and material, the cutting fluid composition and the response measurement details are derived from [10]. 4. Results and Discussion The selection of optimal cutting conditions for influencing the machining parameters is very important for the manufacturing industry to achieve low cost and high precision outputs. With the experimental data obtained at various parameters serve as input parameters for the analysis using ANN and SA methods. By using ANN and SA algorithms optimization parameters were read from the input parameters values such that it covers all the levels of input parameters. The obtained results were compared with experimental results; the resultspresented were obtained with the best parameters found for each classifier. Sensitivity analyses were performed using ANN method to find out the parameters effect the most output response. Simulated annealing method has been used for evaluating optimization constraints and objective functions. The multiple regression analysis results were obtained from ref [10]. The variability in surface roughness (Y2) has been validated using ANOVA and Chi-square test methods. It has been observed that the most dominating parameter is feed rate followed by speed, radial rake angle and nose radius.For optimizing using Simulated Annealing the following objective function and constrains have been used. = 0.20924 − 0.0574( + 0.793536) + 0.0215( + 0.2746( + 0.394756) Subjected to, −1 ≤ ≤ 0.7756 ≤ 0.7095 −1 ≤ ≤ 0.5129 −1 ≤ ≤ 0.5849 −1 ≤ ≤ ≤
+ 3.5907) + 0.350(
the lower and upper bounds of process variables are Where speed, feed, rake angle and nose radius [10]. Coded value is calculated using Equation (5) = (ln Where in range.
− ln
)/ (ln
− ln
+ 0.4066) (4)
,
,
,
are the coded values of
)
the lower and upper bounds of process variables are
(5) ,
,
,
and
is random value
Venkatesh et al., NSK Reddy et al / Materials Today: Proceedings 5 (2018) 4971–4985
4977
The algorithm has been developed using ‘C’ language. The corresponding variables with initial parameters were fed into the program. From the developed code a series of random points will be generated using Gaussian distribution. In order to simulate the thermal equilibrium at every temperature, a number of points are usually tested particular temperature [15]. The algorithm ends when the temperature obtained is less than or equal to one. It was observed fromthe simulated annealing algorithm that it covers almost whole range of values as input parameters because, lot of iterations gives global minimum output for roughness and the corresponding input parameters. 4.1. Neural Networks The advantages of the ANN when compared with multiple regression analyses is high compactness and simplicity which makes it a powerful tool in predicting the surface roughness. The optimal neural network architecture built in this present study is designed using Matlab Neural Network Toolbox. For prediction using NN the first step is to create the network architecture. Different layer configuration is statistically tested to find out the most efficient predictor configuration. The network is initially trained and validated with 90% of total 81 experimental data and is tested for the remaining. The obtained results were analysed using statistical methods. The performance criteria are the ‘R’ (Correlation coefficient) and RMSE (Root mean square error). Different configurations with their ‘R’ value and RMSE are enlisted in the following Table 3. Table 3. Layer Configuration with R and RMSE values Layer Configuration 4-8-1 4-4-1 4-9-1 4-10-1 4-15-1 4-20-1 4-8-8-1 4-10-10-1 4-4-4-1
R 0.987 0.9752 0.9822 0.9881 0.9935 0.9973 0.9812 0.9802 0.8465
RMSE 0.00068 0.00143 0.00145 0.00073 0.000529 0.000305 0.001127 0.00141 0.004806
The configuration with least Mean Square Error (MSE) and high ‘R’ value is chosen. Here in this study 4-20-1 is selected. In this study after performing initial trials, the following parameters of NN were finalized for further prediction of surface roughness which is given in following Table 4. Table 4. Neural Network parameters Structure Algorithm Training: testing Transfer Function for hidden layer Transfer function for output layer Αlpha Performance function Training Adaptive learning function Min gradient Epochs
4-20-1 (4 neurons in input layer), (20 neurons in hidden layer) and (1 neuron in output layer) Feed forward back propagation in MATLAB 90:10 Tansigmoid Purelin 0.1 MSE around 10e-4 Levenberg-Marquardt Learngdm 1e-010 1000
4978
Venkatesh et al., NSK Reddy et al./ Materials Today: Proceedings 5 (2018) 4971–4985
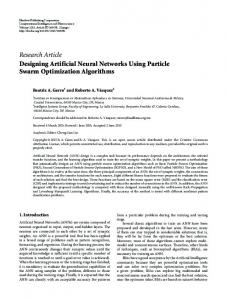
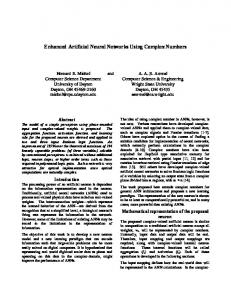
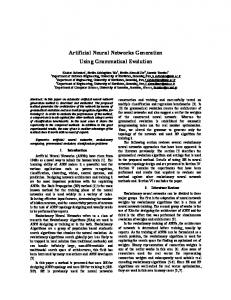
The correlation coefficient in the following graph of output and predicted value for 4-20-1 structure is close to one, as shown in Figure 2 where R is correlation coefficient and output is the predicted roughness value while Target is the actual roughness value, and it’s also verified that the MSE are nearly to zero (Figure3).
Fig. 2. Correlation coefficient training-testing which measures the comparison of modelling result and measured output
Consequently this trained ANN can be thus used for simulation purpose. It was observed from Figure 2 that there is a strong relationship between the predictor variables and surface roughness.
Venkatesh et al., NSK Reddy et al / Materials Today: Proceedings 5 (2018) 4971–4985
4979
Fig. 3. MSE is close to zerowhich indicates the resultant neural network structure is correctly trained
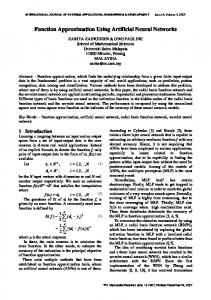
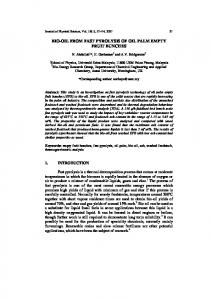
To study the effect of each parameter, the tested ANN model have been used by varying one parameter at a time from its minimum to maximum values whereas the other parameters arekept constant at their mean values as shown in Figure 4. The sensitivity analysis determined the impact of input parameters at their high, low and moderate values on the roughness. The graphs are plotted with the normalized value of input parameters. This paper gives an idea on how each parameter is affecting the output surface roughness predicted by ANN. From Figure 4 it was observed that the sensitivity analysis of each parameter as shown below • The use of higher value of speeds with yielding surface is suitable with lower roughness. • Feed value should be kept at lower magnitude. The increase in roughness value with the increase in feed value is quite high. Thus feed value is one of the significant parameter. • The rake angle value should be kept at moderate level. Higher rake angle can cause higher roughness. • The roughness is not that sensitive to the nose radius in the lower range value of nose radius and attains minimum roughness around its moderate value.
4980
Venkatesh et al., NSK Reddy et al./ Materials Today: Proceedings 5 (2018) 4971–4985
Fig. 4. Sensitivity Analysis which signifies the impact of individual factor independent of other factors on the output roughness
In the present study NN is used for prediction of the roughness in 16 different ranges of the inputs. In each range the prediction is done for certain combinations of input parameters and the minimum roughness is approximately calculated. Thus in each range a total of 2310 different combinations of inputs were predicted for roughness. Although this roughness is not exactly the minimum value of roughness in a particular range, but with the application of NN at least one is assisted with the various possibilities of lower roughness in a particular range. The comparison of surface roughness values for different ranges of input parameters generated shown in the Table 5.For corresponding ranges like 1,9,12 etc. experiments were done to verify the minimum roughness value which is in sync with the computation results.
Venkatesh et al., NSK Reddy et al / Materials Today: Proceedings 5 (2018) 4971–4985
4981
Table 5. Comparison of different range of input parameters generated for each technique (GA- Genetic Algorithm [10], SA-Simulated Annealing, and NN- Neural Networks) S No 1
2
3
4
5
6
7
8
9
10
11
12
13
T
Speed
Feed
Rake Angle
Nose radiu s
Min roughn ess
G S N G S N G S N G S N G S N G S N G S N G S N G S A N G S N G S N G S N G S N
150150150150150150150150150150150150150150150150150150150150150150150150200200250 200200200200200200200200200200200200200-
200200200200200200200200200200200200300300300300300300300300300300300300200200300 200200200200200200200200200200300300300-
4to 10 4 to 10 4 to 10 5 to 10 4 to 10 4 to 10 10 to 10 to 10 to 10 to 10 to 10 to 4 to 10 4 to 10 4 to 10 4 to 10 4 to 10 4 to 10 10 to 10 to 10 to 10 to 10 to 10 to 4 to 10 4 to 10 4 to 10 4 to 10 4 to 10 4 to 10 10 to 10 to 10 to 10 to 10 to 10 to 4 to 10 4 to 10 4 to 10
0.40.40.40.80.80.80.40.40.40.80.80.80.40.40.40.80.80.80.40.40.40.80.80.80.40.400.48 0.80.80.80.40.40.40.80.80.80.40.40.4-
0.3444 0.41176 0.3816 0.4054 0.4987 0.3821 0.4731 0.51731 0.43151 0.528 0.58317 0.4262 0.4896 0.53859 0.5043 0.5614 0.63874 0.5936 0.5797 0.76690 0.53 0.6482 0.84882 0.5976 0.2875 0.34900 80.3533 0.3348 0.44475 0.39 0.3658 0.45479 0.3594 0.4282 0.44962 0.39622 0.4341 0.46226 0.3825
Opt. Rake Angle
Opt. Speed
Opt Feed
194.23 162.4267 200 189.53 155.0455 200 187.05 163.364 195 196.46 165.889 195 197.35 173.4544 200 183.75 151.5906 200 195.95 184.8758 200 186.74 176.1362 185 241.77 236.5233 5240
200.33 200 200 211.77 209.5465 200 202.76 225.564 200 250.48 230.495 200 309.38 346.9088 300 307.23 303.1812 300 336.1 369.7516 300 324 352.2724 320 219.69 271.2638 5200
8.16 5.15414 8 6.13 4.44450 8.55 11.73 11.4962 10 10.21 11.788 10.5 8.67 6.35359 9 8.09 4.13667 9 10.61 14.0710 10 10.33 13.0007 10 7.66 7.96486 29
235.18 209.2057 240 233.4 208.5841 245 249.95 205.1224 250 236.6 224.2730 250
212.3 217.0409 200 204.68 215.8707 200 213.54 209.4049 200 303.53 347.7414 300
6.68 4.81184 7 11.33 10.9255 10 11.04 10.5471 10 9.63 6.40229 9
Opt Nose radius 0.67 0.484557 0.7 0.82 0.838186 0.8 0.71 0.4913 0.6 0.86 0.921981 0.8 0.58 0.567649 0.6 0.86 0.811982 0.8 0.61 0.661924 0.7 0.88 1.003246 0.8 0.49 0.673495 0.6 0.86 0.868164 0.8 0.66 0.455779 0.6 0.93 0.83762 0.8 0.66 0.570938 0.6
4982
Venkatesh et al., NSK Reddy et al./ Materials Today: Proceedings 5 (2018) 4971–4985
Simulated Annealing uses generation of random numbers to obtain surface roughness values for the same range. This is because of the fact that a new set of random numbers is generated every time. This causes an error of 1020% of average roughness value. Similarly in ANN, because of random allocation of initial weights, every time the same value of roughnessvalues does not produce for the same range. Bar graphs have been plotted for each of the sixteen cases for comparison purposes and are shown in Figure 5, 6, and 7. The Genetic Algorithm results are taken from [10]. In order to reduce machining time and to achieve a better surface roughness and metal removal rate, a combination of high speed and low feed, with moderate rake angle and nose radius must be selected for machining processes.
Fig. 5. Comparison of Roughness value obtained by the three Optimization Technique
Venkatesh et al., NSK Reddy et al / Materials Today: Proceedings 5 (2018) 4971–4985
Fig. 6. Comparison of Roughness value obtained by the three Optimization Technique
4983
4984
Venkatesh et al., NSK Reddy et al./ Materials Today: Proceedings 5 (2018) 4971–4985
Fig. 7. Comparison of Roughness value obtained by the three Optimization Technique
The approaches presented here provide optimum machining conditions for corresponding given maximum and minimum values of surface roughness. For a certain range of input machining parameters, all the approaches are quite advantageous in order to have the range of surface roughness values, and their corresponding optimum machining conditions. This would be helpful for an engineer to choose machining conditions for desired machining performance of a product. The Neural network and simulated annealing approaches used to optimize using the mathematical model, was found to be the most useful technique for research. With the known values and boundaries of surface roughness and machining conditions, machining could be performed with a relatively high rate of success, with selected process parameters and tool geometry. 5. Conclusions The prediction of different cutting conditions at various cutting conditions (cutting speed, feed) and tool geometry (rake angle and nose radius) on the surface roughness of the work pieces is conducted using simulated annealing networks and artificial neural networks. There were good agreements between the experimental values and the predicted results. Furthermore, simulated annealing networks, which is an optimization algorithm was applied to find the best cutting conditions leading to minimum surface roughness. The results indicate that in order to obtain good surface finish, high cutting speed, lower feed rate and medium values for the other twovariables (rake angle and nose radius), gives optimized results according to problem condition. It was also observed that the cutting speeds and depths of cut have a tendency to approach the upper bounds. From the optimization results, it’s possible to select a particular combination of input parameters to obtain minimum roughness. The methodology of prediction of optimum cutting conditions and tool geometry using surface roughness model can be made use of in Computer Aided Process Planning (CAPP) stage of Computer Aided Manufacturing (CAM). Also with reference to [10], the study supports the advantage of dry machining over the wet machining. The study has justified the findings of use of artificial intelligence via ANN to optimize the cutting conditions. The study also has effectively implemented the simulated annealing technique to optimize. The study has also given
Venkatesh et al., NSK Reddy et al / Materials Today: Proceedings 5 (2018) 4971–4985
4985
comparative analysis of the results from Artificial Neural Network, Simulated Annealing and Genetic Algorithm [10] and validated the minimum roughness obtained from the optimized set of values of input parameters. 6. References [1] [2] [3] [4] [5] [6] [7] [8] [9] [10] [11] [12] [13] [14] [15] [16] [17] [18] [19] [20]
Robert S. Woodbury (1972) Studies in the History of Machine Tools, Cambridge, Massachusetts, USA, and London, England. Luis Perez, C.J (2002) Surface Roughness Modelling Considering Uncertainty in Measurements, International Journal of Production Research, 40(10): 2245–2268 H. Dagnall (1986) Exploring Surface Texture, Rank Taylor Hobson Limited, Leicester, England. Wang M.Y. and Chang H.Y. (2004) Experimental study of surface roughness in slot end milling in slot end milling AL2014-T6, International Journal of Machine Tools and Manufacture; 44:51–57. Diniz, A.E. and Micaroni, R. (2002) Cutting Conditions for Finish Turning Process Aiming: the use of Dry Cutting, International Journal of Machine Tools and Manufacture, 42: 899–904. Kuang-Hua Fuht and Chin-Fu Wu (1995) A Proposed Statistical Model for Surface Quality Prediction in End Milling of Al Alloy, International Journal of Machine Tools and Manufacture, 35: 1187–1200. Vieira, J.M., Machado, A.R., and Ezugwu, E.O. (2001), Performance of Cutting Fluids During Face Milling of Steels, Journal of Materials Processing Technology, 116: 244–251. Rahman, M., Senthil Kumar, A., and Manzoor-Ul-Salem (2001), Evaluation of Minimal of Lubricant in End Milling, International Journal of Advanced Manufacturing Technology, 18: 235–241. Mansour, A. and Abdalla, H. (2002), Surface Roughness Model for End Milling: A Semi-Free Cutting Carbon Case Hardening Steel (EN32) in Dry Condition, Journal of Materials Processing Technology, 124: 183–191. Suresh Kumar Reddy N. and Venkateswara Rao P. (2005), A Genetic Algorithmic Approach for Optimization of Surface Roughness Prediction Model in Dry Milling, Machining Science and Technology – An International Journal 9(1) pages 63-84. Rajakarunakaran, S., Janakiraman, V., Saravanan, R. and Chockalingam, K.N.K.S.K. Optimization of Milling Operations Using Nelder Mead Simplex and Simulated Annealing Algorithms, IT based Manufacturingtechnical paper collection book. Lakal N. V. and Mohite S.S., Optimization of Turning Process Parameters Using Artificial Neural Network, Manufacturing IT based technical paper collection book. Ilhan Asiltürk, and Mehmet Çunkas (2011), Modelling and prediction of surface roughness in turning operation using artificial neural network and multiple regression method, Expert Systems with Applications, 38(5): 5826-5832. Aykut, S., Golcu M., Semiz, S., Ergur, H.S. (2007), Modelling of cutting forces as function of cutting parameters for face milling of satellite 6 using an artificial neural network, Journal of Materials Processing Technology 190(1-3): 199–203. Sanjay C. and Jyothi C. (2006), A study of surface roughness in drilling using mathematical analysis and neural networks, International Journal of Advanced Manufacturing Technology 29(9-10): 846–852. Benardos, P.G. and Vosniakos, G.C. (2002), Prediction of surface roughness in CNC face milling using neural networks and Taguchi’s design of experiments, Robotics and Computer Integrated Manufacturing 18(5-6): 343–354. Jain, R.K. and Jain, V.K. (2000) Optimum Selection of Machining Conditions in Abrasive Flow using Neural networks, Journal of Materials Processing Technology, 108: 62–67. Thiele, J.D. and Melkote, S.N. (1999) Effect of Cutting Edge Geometry and Workpiece Surface Hardness on Surface Generation in Finish Hard Turning of AISI52100 Steel, Journal of Materials Processing Technology, 94: 216–226. Azlan Mohd Zain, Habibollah Haron, Safian Sharif (2010), Prediction of surface roughness in the end milling machining using Artificial Neural Network, Expert Systems with Applications37(2): 1755–1768. Benardos P.G. and Vosniakos G.C. (2003), Predicting surface roughness in machining: a review, International Journal of Machine Tools Manufacturing, Vol.43, pp. 833 – 844.