V Sangeetha et al. / International Journal of Engineering and Technology (IJET)
Optimization of process parameters for COD removal by Coagulation Treatment using Box–Behnken design V Sangeetha1, V Sivakumar2, A Sudha3, KS Priyenka Devi4 Department of Food Technology, Kongu Engineering College, Perundurai, Tamil Nadu, India 1
[email protected] 2
[email protected] 3
[email protected] 4
[email protected] Abstract –Coagulation treatment of sago wastewater was studied and laboratory studies were carried out using alum as coagulant. Coagulation treatment conditions were optimised through response surface methodology (RSM). Operational parameters namely dosage of alum (Al 2 (SO 4 ) 3 ) (mg/l), pH and wastewater concentration (g/l) were varied between 50-150mg/l, 3–5 and 10-30g/l respectively. The results were analysed using Pareto analysis of variance (ANOVA). Optimum condition at 100mg/l of alum dosage, 4.5 pH and 23.5 g/l concentration, COD removal efficiency was found to be 67.86%. These results reveal the applicability of coagulation treatment to the sago wastewater as an alternative approach. Keyword-Coagulation, Alum, Sago wastewater, COD removal I.INTRODUCTION Modernisation and increasing industrial activities have accelerated water pollution in the environment as well as making water a limited resource. Sago processing requires large amount of water and wastewater treatment is problem to the industry. In Southern part of India, in Tamilnadu more than 800 small scale units of sago industries discharging about 40,000 to 50,000 L of effluent [1,2]. Sago industries require water for washing and peeling of cassava in a rotary drum with low chemical oxygen demand (COD) and the extraction process which own a high contaminating load of COD and biochemical oxygen demand (BOD). Sago wastewater does not have any toxic substances, but high organic matter which cause increase in COD level. Owing to the industrial growth, purification and recycling of industrial waste waters have become imperative. The most common physico-chemical treatment method includes coagulation [3]. Coagulation has been defined as the addition of a positively charged ion of metal salt or catalytic polyelectrolyte which results in particle destabilization and charge neutralization. The colloid particles exhibit Brownian movement through the water [4]; it is cost effective to remove colloidal and slowly settleable small particles [5]. Most widely used coagulant in wastewater treatment is aluminium sulphate (Al 2 (SO 4 ) 3 ) or alum and Ferrous sulphate ((FeSO 4 ) 3 ). Treatment of wastewater concerned with production of potato chips and other food processing industry and dairy industry uses the alum and ferrous sulphate as coagulant [6-8]. The conventional coagulation process with alum as the single coagulant is capable of achieving significant organic removal. The pH of the water during coagulation has intense influences on effectiveness of coagulation for organic removal and it is much better in slightly acidic condition. The optimum pH for alum dosage is subjected by the concentration of organic matter in the wastewater [4]. Both advantages and disadvantages are concerned with coagulation process used in wastewater treatment: alum reacts to form precipitation of sulphur compounds, easier sludge dewatering, increased efficiency in elimination of pollutants and the addition of treatment chemicals may increase the total volume of sludge [8]. The objective of the present study is to optimise the removal efficiency of COD for coagulation process with minimum cost and time. RSM is statistical tool used to evaluate, analyse and optimise the process parameters. RSM has important application in the improvement of existing design. It defines the effect of the independent variables alone or in combination and also it generates a mathematical model which describes the processes interaction [9, 10]. Hence this study focussed on optimisation of three factors at three levels using Box Behnken design approach. II. MATERIALS AND METHODS A. Wastewater preparation. The synthetic sago wastewater was prepared by mixing a finely ground sago powder (-500 + 400 μm DIN Standard sieve size) with tap water along trace elements including sulphide were added to represent the typical composition of industrial sago wastewater having initial COD ranges from 950mg/l to 1700mg/l [11,12].
ISSN : 0975-4024
Vol 6 No 2 Apr-May 2014
1053
V Sangeetha et al. / International Journal of Engineering and Technology (IJET)
B. Experimental Procedure. The wastewater samples were prepared for 10, 20, 30 g/l concentration as per above mentioned procedure. 50, 100, 150 mg/l of alum (Al 2 SO 4 ) 3 .18H 2 O was added to the wastewater samples as per the design matrix calculation. The coagulant was added to 1L beakers containing wastewater sample, pH was adjusted using 0.1N H 2 SO 4 or 0.1N NaOH. The solution was mixed rapidly using magnetic stirrers at 200rpm for 2 min and stirring period was adjusted to 60rpm for 30min, the liquid was clarified for 1 h, then the supernatant was collected and analysed for COD using standard methods [13]. After collecting the supernatant, wet sludge volume of cake settled was also calculated. C. Box-Benhken Design (BBD). First, single factor experiment has been employed as a traditional method by changing one variable at a time. By this method it is difficult to study the optimised and interaction effect among the variables [14]. Therefore, the Box-Behnken statistical design combined with RSM was used to optimise the study. RSM is a group of empirical techniques relating a controlled experimental factors and measured responses agreeing to one or more selected criteria [15, 16]. The advantages of Box–Behnken designs comprise the fact that they are all spherical designs and require factors to be run at only three levels. The designs are also rotatable and provide orthogonal blocking. In these designs the block effects are orthogonal to the other factor effects [17]. Instead of complete factorial design, this design provides minimum effort and accurate result. Mostly, this optimization process involves three major steps 1) performing the statistically designed experiments: ANOVA is a statistical technique that subdivides the total variation in a set of data into component parts related with specific sources of variation for the purpose of testing hypotheses on the parameters of the model 2) estimating the coefficients in a mathematical model 3) predicting the response and checking the adequacy of the model [18, 19]. Three factors at 3 levels were varied in the present study to study the optimisation of coagulation parameters such as alum dosage (X 1 ), pH (X 2 ) and wastewater concentration (X 3 ) respectively. Independent variables were coded as -1(low), 0(centre point) and +1(high) in the ranges determined by preliminary work. Table 1 gives the experimental range and levels of independent variables considered in this study. A total number of 17 experiments were carried out in a randomized order with five centre points and the corresponding response % COD removal (Y) are presented in Table 2. The experimental design consists of a set of points lying at the midpoint of each edge and the replicated centre point of the multidimensional cube. It defines the region of interest used to evaluate the main effects, interaction effects, and quadratic effects and to optimize the process. The regression model was used to fit the second-order polynomial equation, to identify the relevant model terms. The performance of the system is explained by the following quadratic equation (1) 𝑘
𝑌 = 𝛽𝑜 + � 𝛽𝑖 𝑥𝑖 + 𝑖=1
𝑘
� 𝛽𝑖𝑖 𝑥𝑖2 𝑖=1
𝑘
𝑘
+ � � 𝛽𝑖𝑗 𝑥𝑖 𝑥𝑗 + 𝜀 𝑖=1 𝑗=1
where Y is the process response or output (dependent variable), k is the number of the patterns, i and j are the index numbers for pattern, β o is the free or offset term called intercept term, x1, x2,. . ., xk are the coded independent variables, β i is the first-order (linear) main effect, β ii is the quadratic (squared) effect, β ij is the interaction effect, and ε is the random error between predicted and measured values [17]. Table 1 Coagulation parameter and their levels
Level Variables Alum Dosage (mg/l) Cd pH Concentration (g/l) C
Factors X1 X2 X3
-1
0
1
50 3 10
100 4 20
150 5 30
Each experiment was repeated three times to observe the reproducibility and the result were subjected to three step process. The statistical significance of the ratio of mean square variation due to regression and mean square residual error was tested using ANOVA. The adequacy of model was performed by three different tests, viz., Sequential model Sum of Squares, Lack of Fit Tests and Model Summary Statistics were carried out in the present study. The response plots such as 3D and contour plot was used to found an optimum condition. The quality of the fit of polynomial model was expressed by coefficient of determination R2, adjusted R2 and adequate precision. Fischer’s F-Test was used to evaluate the statistical significance and optimise the desired goals fixed for maximum COD removal.
ISSN : 0975-4024
Vol 6 No 2 Apr-May 2014
1054
V Sangeetha et al. / International Journal of Engineering and Technology (IJET)
Table 2 Experimental and predicted values of Y for %COD removal
Run 1 2 3 4 5 6 7 8 9 10 11 12 13 14 15 16 17
Cd
pH
C
X1 150 100 100 50 100 100 100 100 50 150 50 150 50 100 100 100 150
X2 3 3 5 4 4 4 4 5 5 5 3 4 4 4 3 4 4
X3 20 30 10 10 20 20 20 30 20 20 20 10 30 20 10 20 30
%COD removal Y exp 18.21 28.64 37.9 31.57 65.24 66.58 68.14 73.81 38.62 50.27 20.41 17.59 24.65 67.43 25.67 65.28 52.52
Y pre 18.12 27.92 38.62 30.77 66.53 66.53 66.53 71.31 38.71 51.97 18.71 17.18 27.06 66.53 28.17 66.53 53.32
Error -0.48 -2.57 1.86 -2.61 1.94 -0.07 -2.41 -3.51 0.22 3.26 -9.06 -1.05 8.92 -1.35 8.87 1.88 1.51
III.RESULTS AND DISCUSSION A. BBD Statistical analysis. The ANOVA results for % COD removal was shown in Table 3, the F values for all regressions were higher. The large value of F indicates that most of the variation in the response can be explained by the regression equation. The associated p value is used to estimate whether F is large enough to indicate statistical significance. The values of p > F, less than 0.05 indicates that the model is considered to be statistically significant [20]. The p values for all the regressions were lower than 0.01. This means that at least one of the terms in the regression equation has a significant correlation with the response variable. The ANOVA table also shows a term for residual error, which measures the amount of variation in the response data left unexplained by the model. The form of the model chosen to explain the relationship between the factors and the response is correct [21, 22]. The ANOVA result for the % removal of COD for coagulation process, shows that the model F-value is 129.83, implying that the model is significant. There is < 0.01% probability that a model F-value this could be large occurs due to noise.
ISSN : 0975-4024
Vol 6 No 2 Apr-May 2014
1055
V Sangeetha et al. / International Journal of Engineering and Technology (IJET)
Table 3 ANOVA for % COD removal
Source
Sum of Squares
df
Model X1 X2 X3 X1 X2 X1 X3 X2 X3 X12 X22 X32 Residual Lack of Fit Pure Error Cor Total
6489.15 80.26 1449.10 526.34 47.96 397.01 271.26 2045.22 670.27 648.66 38.87 32.24 6.63 6528.03
9 1 1 1 1 1 1 1 1 1 7 3 4 16
Mean Square
F Value
p-value Prob > F
721.017 80.264 1449.104 526.339 47.956 397.006 271.261 2045.219 670.268 648.664 5.554 10.748 1.658
129.83 14.45 260.93 94.78 8.64 71.49 48.84 368.28 120.69 116.80
< 0.0001 0.0067 < 0.0001 < 0.0001 0.0218 < 0.0001 0.0002 < 0.0001 < 0.0001 < 0.0001
6.48
0.0513
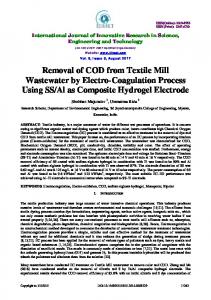
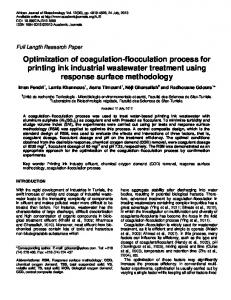
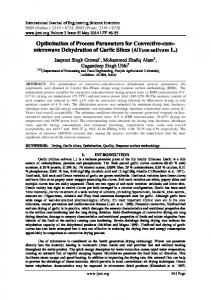
R2=0.9940, Adj R2=0.9864, Pred R2=0.9194, Adeq Precision=29.951 B. Fitting of Second order polynomial equation. The ANOVA analysis indicates a linear relationship between the main effects, quadratic effect and interaction effect of X 1 , X 2 , and X 3 respectively. The final mathematical equation in terms of actual factors (confidence level above 95%) as determined by Design-expert software is given below % 𝐶𝑂𝐷 𝑅𝑒𝑚𝑜𝑣𝑎𝑙 (𝑌1) = −216.107 + 1.15 𝑋1 − 90.99 𝑋2 + 0.48943 𝑋3 + 0.06925 𝑋1 𝑋2 + 0.0199𝑋1 𝑋3 + 0.8235 𝑋2 𝑋3 − (2) 0.0088𝑋12 − 12.61 𝑋22 − 0.124 𝑋32 In the present study X 2 , X 3 , X 1 X 3 , X 1 2, X 2 2 and X 3 2 are highly significant parameters, while X 1 , X 1 X 2 and X 2 X 3 are significant parameters. A lack-of-fit value of 6.48 also supports the fitness of the model. There is a 5.13% possibility of this deviation being mostly due to noise. Quadratic model was chosen for further analysis because predicted value of (R2 = 0. 9194) and the adjusted value of (R2 = 0.9864) were found to be maximum respectively. The high value of adequate precision at 29.951, which measures a signal-to-noise ratio greater than 4, is desirable in support of the fitness of the model [23]. C. Effect of independent variable on COD removal. After studying the effect of the independent variables on the response, the levels of the variables that give the optimum response were determined. 3D and contour plots of the relationship between concentrations, pH and their effect on the percentage removal of COD at 50,100,150mg/l dosages is shown in Fig. 1, 2 and 3 respectively. At pH of 4.5 COD removal was increased to 67.86% with a desirability of 0.92 respectively. Alum was found to be very effective in reducing solids and organics [8]. The figures clearly indicate that the percentage removal of COD increases with increasing alum concentration of 50 to 100mg/l, whereas 150mg/l of alum dosage cause the COD removal in slightly diminishing fashion [24]. The point prediction is used for the optimization of the process parameters.
ISSN : 0975-4024
Vol 6 No 2 Apr-May 2014
1056
V Sangeetha et al. / International Journal of Engineering and Technology (IJET)
Fig.1 Effect of pH and concentration on % COD removal at 50mg/l
Fig.2 Effect of pH and concentration on % COD removal at 100mg/l
Fig.3 Effect of pH and concentration on % COD removal at 150mg/l
ISSN : 0975-4024
Vol 6 No 2 Apr-May 2014
1057
V Sangeetha et al. / International Journal of Engineering and Technology (IJET)
IV. CONCLUSION The results of RSM showed good correspondence between experimental and predicted values. This shows that the sago behaves as negatively charge polymer, which enhances the coagulation process. The optimum condition at which organic matter reduction is obtained for sago wastewater was at pH 4.5, alum dosage of 100mg/l for concentration of 23.5g/l. The analysis of variance showed high coefficient of determination (R2) of 0.9194 and desirability of 0.92 for % removal of COD and thus ensuring the satisfactory fit for the regression model. REFERENCES [1] [2] [3] [4] [5] [6] [7] [8] [9] [10] [11] [12] [13] [14] [15] [16] [17]
[18] [19] [20] [21] [22] [23] [24]
Saravanane. R, Murthy. D.V. S and Krishnaiah. K. “Anaerobic fluidized bed degradation and the development of a kinetic model for a particulate organic matter enriched wastewater sludge,” Water Air Soil Pollut, Vol.127, pp.15–30 (2001). Savitha. S, Sadhasivam. S, Swaminathan.K and Feng Huei Lin. “A prototype of proposed treatment plant for sago factory effluent,” J Cleaner Prod, Vol. 17, pp.1363–1372 (2009). Pernitsky.D. J and Edzwald. J.K. “Selection of alum and Polyaluminium coagulants: principles and applications,” Journal of Water Supply Research and Technology – AQUA, Vol.55(2), pp.121- 141 (2006). Sahu.O. P and P. K. Chaudhari. "Review on Chemical treatment of Industrial Waste Water," Journal of Applied Sciences and Environmental Management, Vol.17(2), pp. 241-257 (2013). Song. Z, C. J. Williams and R. G. J. Edyvean. "Treatment of tannery wastewater by chemical coagulation," Desalination, Vol.164(3),pp.249-259 (2004). Bansode.R. R, J. N. Losso, W. E. Marshall, R. M. Rao, and R. J. Portier. "Pecan shell-based granular activated carbon for treatment of chemical oxygen demand (COD) in municipal wastewater," Bioresource technology.Vol.94 (2),pp. 129-135 (2004). Konieczny. P, Ekner. E, Uchman. W.and Kufel. B. “Effective Use Of Ferric Sulfate In Treatment Of Different Food Industry Wastewater,” Acta Sci. Pol., Technol. Aliment Vol.4(1), pp.123-132 (2005). Kokila. A, Parmar, Sarju Prajapati, Rinku Patel and Yogesh Dabhi. “Effective use of ferrous sulfate and alum as a coagulant in treatment of dairy industry wastewater,” Journal of Engineering and Applied Sciences.Vol.6(9),pp.42-45 (2011). Myers. R. H and Montgomery. D. C.. “Response Surface Methodology: Process and Product Optimization Using Design Experiments,” (2nd edn). New York, NY, USA: John Wiley and Sons (2002). Bas, Deniz, and İsmail H. Boyac. "Modeling and optimization I: Usability of response surface methodology," Journal of Food Engineering, Vol. 78(3),pp.836-845 (2007). Rao. D G, Senthilkumar. R, Anthony Byrne. J and Feroz S. “Wastewater Treatment: Advanced Processes and Technologies,” IWA publishing, CRC press Taylor and Fancis Group, pp.220-221 (2013). Parthiban, Rangasamy, and Latha Parthiban. "Back propagation Neural network modeling approach in the anaerobic digestion of wastewater treatment," International Journal of Environmental Sciences, Vol. 2(4), pp.1944-1951 (2012). APHA, “Standard Methods for the Examination of Water and Wastewater”, American Public Health Association, New York, NY, USA, 21st edition, (2005). Ajay. B, Solanki, Jolly R. Parikh, and Rajesh H. Parikh. “Formulation and Optimization of Piroxicam Proniosomes by 3-Factor, 3-LevelBox-Behnken Design,” Pharm Sci Tech, Vol. 8 (4),(2007) Article 86 (http://www.aapspharmscitech.org). Bayraktar, Emine. "Response surface optimization of the separation of DL-tryptophan using an emulsion liquid membrane," Process Biochemistry, Vol. 37(2) pp.169-175 (2001). M.Y. Can, Y. Kaya and O.F. Algur. “Response surface optimization of the removal of nickel from aqueous solution by cone biomass of Pinus sylvestris,” Bioresource Technology, Vol.97,pp.1761–1765 (2006). Yetilmezsoy, Kaan, Sevgi Demirel, and Robert J. Vanderbei. "Response surface modeling of Pb (II) removal from aqueous solution by< i> Pistacia vera L.: Box–Behnken experimental design," Journal of Hazardous Materials, Vol. 171(1),pp. 551562 (2009). Annadurai, G., and R. Y. Sheeja. "Use of Box-Behnken design of experiments for the adsorption of verofix red using biopolymer," Bioprocess engineering, Vol. 18(6),pp. 463-466 (1998). Segurola J, Allen NS, Edge M, Mahon AM .“Design of eutectic photo initiator blends for UV/curable acrylated printing inks and coatings,” Prog Org Coat, Vol.37,pp.23–37 (1999). Kumar, Arvind, B. Prasad, and I. M. Mishra. "Process Parametric Study for Ethene Carboxylic Acid Removal onto Powder Activated Carbon using Box‐Behnken Design," Chemical engineering & technology, Vol. 30(7),pp. 932-937 (2007). Ravikumar, K., S. Ramalingam, S. Krishnan, and K. Balu. "Application of response surface methodology to optimize the process variables for reactive red and acid brown dye removal using a novel adsorbent," Dyes and pigments, Vol.70(1),pp. 18-26 (2006). H.M. Kim, J.G. Kim, J.D. Cho and J.W. Hong. “Optimization and characterization of UV-curable adhesives for optical communication by response surface methodology,” Polym. Test, Vol 22,pp. 899–906 (2003). Muthukumar, M., D. Mohan, and M. Rajendran. "Optimization of mix proportions of mineral aggregates using Box Behnken design of experiments," Cement and Concrete Composites, Vol.25(7), pp.751-758 (2003). Kumar, Pradeep, B. Prasad, I. M. Mishra, and Shri Chand. "Decolorization and COD reduction of dyeing wastewater from a cotton textile mill using thermolysis and coagulation," Journal of hazardous materials, Vol. 153(1), pp. 635-645(2008).
ISSN : 0975-4024
Vol 6 No 2 Apr-May 2014
1058