Journal of MECHANICAL ENGINEERING – Strojnícky časopis, VOL 68 (2018), NO 3, 195 - 224
OPTIMIZATION OF PROCESS PARAMETERS FOR FSW OF Al-Mg-Mn-Sc-Zr ALLOY USING CCD AND RSM SRINIVASA RAO Mallipudi1, RAMANAIAH Nallu2 1 Research Scholar of Mechanical Engineering, Andhra University College of Engineering (A), Andhra University, Visakhapatnam, Andhra Pradesh, India-530 003, email:
[email protected] 2 Professor of Mechanical Engineering, Andhra University College of Engineering (A), Andhra University, Visakhapatnam, Andhra Pradesh, India-530 003, email:
[email protected]
Abstract: Al-Mg-Mn-Sc-Zr alloy plates of 5mm thick were welded successfully using Friction stir welding (FSW). Three-factor five-level central composite design was adopted for experimentation. Response surface methodology (RSM) was employed to construct a mathematical regression model. Optimization of FSW process parameters obtained by using response surface plots for maximize hardness, tensile strength, %elongation, impact strength and bending strength, the results were validated with confirmation tests at identified optimum conditions. KEYWORDS: Al-Mg-Mn-Sc-Zr alloy, friction stir welding, central composite design, Response surface methodology, mechanical properties
1
Introduction
In the development of technology, more and more challenging problems are faced by the scientists and technologies in the research field of metal joining. The difficulty in adopting the traditional welding processes can be attributed mainly, new materials with low weld strength. Researchers in the area of material science are developing materials having a high strength, hardness, toughness and other diverse properties. The welding of metals in such materials by traditional methods is still more difficult. So to meet such demands a different class of welding process has been developed [1]. In the recent years, a new solid-state joining technique popularly known as Friction stir welding (FSW) was invented and patented by The Welding Institute (TWI) in United Kingdom in the year 1991[2]. The need of FSW was brought-out in the first paragraph for the reason that FSW was eco-friendly [3] and applicable for high strength to weight ratio materials and does not exhibit welding defects like porosity and hot cracks [4]. Some of the researchers were successfully applied FSW to all classes of aluminium alloysAA6063 [5]; AA7010 [6]; AA5083 [7-8]; AA2219 [9]; AA 1050, AA 6061-T6, AA 22024T3, AA 7039-T4 and AA 7039-T6 [10]; AA2024 and AA6351 [11]. They reported that the sound and defect free welds were produced using FSW. The optimization process of FSW parameters studied by some of the researchers on Response surface methodology (RSM) [12]; RSM and ANN models [13]; Taguchi technique [14, 29]; RSM and ANOVA [15]; Genetic algorithm [16-17, 30] and Neural network [18]. The present work focuses on the optimization of FSW (bead on plate welding) process parameters of Al-Mg-Mn-Sc-Zr alloy plates of 5mm thick using central composite design
DOI: 10.2478/scjme-2018-0035, Print ISSN 0039-2472, On-line ISSN 2450-5471 2018 SjF STU Bratislava
(CCD) and RSM. These alloys have not yet reported previously for optimization of FSW process parameters with additions of Scandium (Sc)-Zirconium (Zr) to Al-Mg-Mn alloy. 2
Materials and Methods
In the present study the four aluminum alloys were produced by melting in an electrical resistance furnace. These alloys were prepared by stir casting, using Al-4.2Mg-0.6Mn alloy and three master alloys (Al–10wt. %Mg, Al–2wt.%Sc and Al–5wt.% Zr) that were melted in alumina crucible and then poured into a metal mould. The final temperature of the melt was always maintained at 1000±15oC with the help of the electronic controller. Then the melt was homogenized under stirring at 900oC. Casting was done in mild steel metal mould with graphite paste (die coat) as mould releasing agent preheated to 200oC [20]. After casting, then cold-rolled to 5 mm thick sheets, these plates were machined into 120 x 120 x 5 mm3 using wire-cut electric discharge machine. All these alloys were analyzed by spectro-chemical methods simultaneously to know the chemical compositions of the alloys is shown in Table 1. Table 1. Chemical composition of the aluminium alloys (wt. %) Alloy type Al-4.2Mg-0.6Mn Al-4.2Mg-0.6Mn0.2Sc-0.1Zr Al-4.2Mg-0.6Mn0.4Sc-0.1Zr Al-4.2Mg-0.6Mn0.6Sc-0.1Zr
Mg Mn Si Cr Zn Ni Li 4.2 0.6 0.17 0.10 0.06 0.006 0.001
Sc -
Zr -
Bal. Al
4.2
0.6 0.17 0.10 0.06 0.006 0.001 0.2 0.1
Al
4.2
0.6 0.17 0.10 0.06 0.006 0.001 0.4 0.1
Al
4.2
0.6 0.17 0.10 0.06 0.006 0.001 0.6 0.1
Al
All these four alloy plates were processed for testing of mechanical properties for evaluating hardness (H), tensile strength (UTS), %elongation (%E), bending strength (BS) and impact strength (IS) as per standards discussed in the experimental methods section. The alloy with improved mechanical properties was further treated with bead on plate friction stir welding for optimization of FSW process parameters. 2.1
Design of Experiments
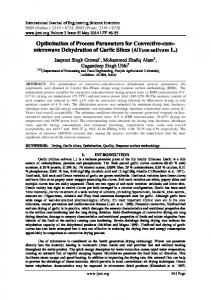
Before the experimentation is taken-up, the design of experiments, which is an important aspect to decide the number of experiments. Design of Experiments (DOE) is a structured, organized method for determining the relationship between factors affecting a process and the output of that process. For the present experimental plan, the central composite design method [19] allowed the prediction of the second order experimental model with individual and interactive effects of the variables on the H, UTS, %E, BS, and IS of the FS welded joints. In the present investigation, from the available literature, three process parameters applied load (AL), tool rotational speed (RS), and tool traverse speed (TS) were selected. Based on the trials, when applied load was below 4 kN, and above 12 kN a wormhole defect was observed due to insufficient load and heat generation and due to high frictional heat respectively as shown in Figure 1(a). When the rotational speed was lower than 800 rpm, tunnel defect at the retreating side of stirred zone was observed and it may be due to insufficient heat generation and insufficient metal transportation; when the rotational speed was higher than 1600 rpm, tunnel defect shown in Fig. 1(b). Similarly, when the tool traverse speed was lower than 20 mm/min, pin holes shown in Figure 1(c) this type of defect was observed due to excessive heat input per unit length of the weld and no vertical movement of the metal. 196
2018 SjF STU Bratislava
Volume 68, No. 3, (2018)
(a)
(b)
(c)
(d)
Fig. 1 (a) Worm hole (b) Tunnel defect (c) Pin hole defect (d) No defect When tool traverse speed was higher than 40 mm/min, tunnel at the bottom in retreating side was observed due to insufficient heat. Fig. 1(d) shows the no defect was observed. Table 2 indicates the factors to be studied and the assignment of corresponding levels on the output of that process. Table 3 shows the selected design of experiments matrix of CCD with three factors and five levels [13]. Table 2. Process parameters with their values at corresponding levels S. No Parameters Notation Unit Levels -α -1 0 01 Applied Load AL kN 4 6 8 02 Tool Rotational speed RS rpm 800 1000 1200 03 Tool Traverse speed TS mm/min 20 25 30 Table 3. Selected experimental design matrix Experiment AL RS TS Experiment 1 +1 +1 +1 11 2 -1 +1 -1 12 3 0 0 0 13 4 0 0 +2 14 5 +1 -1 -1 15 6 0 0 0 16 7 -1 -1 +1 17 8 +2 0 0 18 9 0 0 0 19 10 -1 -1 -1 20 2.2
AL 0 +1 0 -2 -1 0 0 0 +1 0
RS +2 -1 0 0 +1 0 -2 0 +1 0
+1 10 1400 35
+α 12 1600 40 TS 0 +1 0 0 +1 0 0 -2 -1 0
Experimental Methods
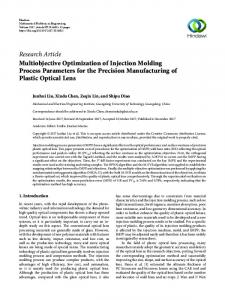
Friction stir welding of Al-4.2Mg-0.6Mn-0.4Sc-0.1Zr alloy plate size 120 x 120 x 5 mm3 was carried out perpendicular to rolling direction of the plate. The welded plate was shown in Volume 68, No. 3, (2018)
2018 SjF STU Bratislava
197
Fig. 2. Fig. 3 (a) and (b) shows the dimensions of the FSW tool and FSW tool (H13 tool steel) respectively.
Fig. 2. Friction stir welded Al-4.2Mg-0.6Mn-0.4Sc-0.1Zr alloy plate
Fig. 3. (a) Tool dimensions (b) H13 Tool steel Vickers micro hardness of the specimens before and after welding, was measured with micro hardness tester on the surface of the specimens by applied load of 200gf for 15s dwell time. The Hardness values of each specimen were calculated by averaging five data points. Uniaxial tensile tests at room temperature were conducted using computerised universal testing machine. Tensile Tests were done according to the standards of ASTM E8 with constant cross head speed by using TUE-C-600 model universal testing machine to achieve ultimate strength was recorded after averaging of three data points [21-22]. The tensile specimens of before and after welding were intercepted to standard sub specimens of 50 mm gauge length and 12.5 x 5 mm2 cross-sectional area as shown in the Fig. 4 along the transverse direction of plates as per ASTM E8. The three point bend test was performed to evaluate the bending strength of the test specimens with mandrel size 4t (t is thickness of the specimen) and the size of the specimen was 100 x 10 x 5 mm3. Three specimens for each alloy were tested and averaged [23]. The Charpy V-notch impact tests were performed using Krystal Elmec, model KI 300, range-168J to know the actual energy observed by the specimens. The standard specimen size (ASTM E23) for charpy impact testing is 10×5×55 mm3 contains 45o V notch, 2 mm deep with a 0.25 mm root radius. Three specimens for each composition were tested and averaged [24]. 198
2018 SjF STU Bratislava
Volume 68, No. 3, (2018)
Figure 4. Tensile test specimens after FSW 3.
Results and discussion
3.1
Mechanical Properties of Al-Mg-Mn-Sc-Zr Alloys
The experimental output results relating to H, UTS, E, BS and IS of the fabricated four alloys were shown in Table 4. The values indicated were the average of three readings. The UTS of Al-4.2Mg-0.6Mn to Al-4.2Mg-0.6Mn-0.6Sc-0.1Zr were 188.8 MPa, 229.6 MPa, 260.4 MPa, and 236 MPa respectively; however, the bending strength of these alloys increases slightly from Al-4.2Mg-0.6Mn to Al-4.2Mg-0.6Mn-0.4Sc-0.1Zr without any unnoticeable values. The impact strength (IS) were 2.5 MPa, 2.5 MPa, 2.8 MPa, and 2.5 MPa respectively, The UTS of Al-4.2Mg-0.6Mn-0.4Sc-0.1Zr alloy increased by 72 MPa while the bending strength of alloys decreases from Al-4.2Mg-0.6Mn-0.4Sc-0.1Zr to Al-4.2Mg-0.6Mn0.6Sc-0.1Zr. Table 4 Mechanical Properties of Alloys H UTS BS IS Specimen type %E (VHN) (MPa) (MPa) (MPa) Al-4.2Mg-0.6Mn 94 188.8 8.7 3240 2.5 Al-4.2Mg-0.6Mn-0.2Sc-0.1Zr 118 229.6 7.5 3240 2.5 Al-4.2Mg-0.6Mn-0.4Sc-0.1Zr 139 260.4 7.4 3480 2.8 Al-4.2Mg-0.6Mn-0.6Sc-0.1Zr 109 236.0 8.2 3240 2.5 The CCD experimental output results relating to H, UTS, %E, BS and IS for Friction stir welded specimens were shown in Table 5. The values indicated are the average of three readings (trials). 3.2
Development of Mathematical Models
The mathematical model developed by response surface methodology technique was used to predict maximum H, UTS,%E, IS and BS in terms of the FSW process parameters for Al4.2Mg-0.6Mn-0.4Sc-0.1Zr alloy. The general second order regression equation “Eq. (1)” to represent response “Y” is given by
Y = bo+ ∑ bi xi+∑ bii xi2+∑ bij xixj + er
Volume 68, No. 3, (2018)
2018 SjF STU Bratislava
(1)
199
Table 5. CCD Experimental design matrix and the responses for experiments Experimental AL RS TS H UTS BS IS Expt. %E (kN) (rpm) (mm/min) (VHN) (MPa) (MPa) (MPa) 1 10 1400 35 92.51 199.30 4.61 2473.93 6.30 2 6 1400 25 96.26 209.05 6.61 2801.93 7.86 3 8 1200 30 103.93 240.27 4.46 3263.27 10.5 4 8 1200 40 103.42 199.81 7.67 2470.82 6.66 5 10 1000 25 126.01 178.80 4.28 2161.43 4.11 6 8 1200 30 103.93 240.27 4.46 3263.27 10.5 7 6 1000 35 106.51 220.55 7.21 2864.43 8.80 8 12 1200 30 108.92 153.56 4.39 1786.82 1.97 9 8 1200 30 103.93 240.27 4.46 3263.27 10.5 10 6 1000 25 98.89 216.05 4.72 2808.43 7.86 11 8 1600 30 98.67 197.31 6.07 2446.32 6.34 12 10 1000 35 97.14 187.30 7.82 2442.43 5.68 13 8 1200 30 103.93 240.27 4.46 3263.27 10.5 14 4 1200 30 112.67 214.06 3.57 2842.82 8.84 15 6 1400 35 123.39 222.55 3.34 2882.93 9.43 16 8 1200 30 103.93 240.27 4.46 3263.27 10.5 17 8 800 30 105.92 192.31 7.39 2421.32 5.72 18 8 1200 20 105.17 177.81 7.39 2108.82 3.53 19 10 1400 25 101.89 181.80 6.82 2167.93 4.11 20 8 1200 30 103.93 240.27 4.46 3263.27 10.5 The experimental results are fitted to the second order quadratic equation. The predicted equation “Eq. (2)”, including three factors obtained from the CCD experiments was as follows:
H or UTS or %E or IS or BS = f (AL, RS, TS)
(2)
H = -315+ 21.3 AL+ 0.324 RS+ 11.05 TS- 1.389 AL*AL- 0.000136 RS*RS0.2273 TS*TS- 0.00031 AL*RS+ 0.088 AL*TS+ 0.00037 RS*TS
(3)
UTS = 653+ 44.5 AL+ 0.568 RS+ 27.05 TS- 3.216 AL*AL-0.000284 RS*RS 0.5645 TS*TS+ 0.00563 AL*RS+ 0.100 AL*TS+ 0.00250 RS*TS
(4)
%E = 44.0-1.33 AL-0.0207 RS-1.154 TS+ 0.0249 AL*AL+0.000009 RS*RS + 0.00898 TS*TS+ 0.000078 AL*RS+ 0.0381 AL*TS-0.000031 RS*TS
(5)
BS = -13830.2+831.205AL +12.2506RS + 467.373TS -60.8409AL*AL -0.00518409RS*RS-9.48455TS*TS+ 0.0156250AL*RS+ 5.62500AL*TS +0.00325000RS*TS IS = -84.4460+ 4.90767 AL + 0.0654119 RS + 2.61648 TS-0.340909AL*AL -2.82315E-05RS*RS -0.0514205TS*TS + 0.000390625AL*RS +0.0156250 AL*TS +4.64281E-19 RS*TS
(6)
(7)
The minitab17 statistical software was used to obtain the regression coefficients by applying CCD to determine the relationships between response and the process parameters 200
2018 SjF STU Bratislava
Volume 68, No. 3, (2018)
and it was given in the Eqs. (3), (4), (5), (6) and (7) for H, UTS, %E, BS and IS respectively. The CCD predicted output results were shown in Table 6. Table 6. CCD Experimental design matrix and the predicted responses Predicted Expt. AL RS TS H UTS BS %E No. (kN) (rpm) (mm/min) (VHN) (MPa) (MPa) 1 10 1400 35 92.51 199.30 4.61 2473.93 2 6 1400 25 96.26 209.05 6.61 2801.93 3 8 1200 30 103.93 240.27 4.46 3263.27 4 12 1200 30 103.42 199.81 7.67 2470.82 5 6 1000 35 126.01 178.80 4.28 2161.43 6 8 1200 30 103.93 240.27 4.46 3263.27 7 10 1000 25 106.51 220.55 7.21 2864.43 8 8 1200 40 108.92 153.56 4.39 1786.82 9 8 1200 30 103.93 240.27 4.46 3263.27 10 6 1000 25 98.89 216.05 4.72 2808.43 11 8 1600 30 98.67 197.31 6.07 2446.32 12 10 1000 35 97.14 187.30 7.82 2442.43 13 8 1200 30 103.93 240.27 4.46 3263.27 14 8 1200 20 112.67 214.06 3.57 2842.82 15 10 1400 25 123.39 222.55 3.34 2882.93 16 8 1200 30 103.93 240.27 4.46 3263.27 17 8 800 30 105.92 192.31 7.39 2421.32 18 4 1200 30 105.17 177.81 7.39 2108.82 19 6 1400 35 101.89 181.80 6.82 2167.93 20 8 1200 30 103.93 240.27 4.46 3263.27
Table 7. Analysis of variance (ANOVA) for Hardness Sum Degree Source of of F-value P-value Squares Freedom model 2608.43 9 5.79 0.006 AL 115.56 1 2.31 0.160 RS 27.56 1 0.55 0.475 TS 826.56 1 16.51 0.002 AL*RS 0.12 1 0.00 0.961 AL*TS 6.13 1 0.12 0.734 RS*TS 1.13 1 0.02 0.884 AL2 776.37 1 15.51 0.003 2 RS 741.83 1 14.82 0.003 TS2 811.69 1 16.22 0.002 Lack of fit 129.68 5 0.35 0.863 Pure error 500.52 5 Cor. Total 3108.95 19 R-squared 83.90% Adj- R Squared 69.41% Pre R-Squared 49.54% Volume 68, No. 3, (2018)
2018 SjF STU Bratislava
IS (MPa) 6.30 7.86 10.55 6.66 4.11 10.55 8.80 1.97 10.55 7.86 6.34 5.68 10.55 8.84 9.43 10.55 5.72 3.53 4.11 10.55
Significant Insignificant Insignificant Significant Insignificant Insignificant Insignificant Significant Significant Significant Insignificant 201
The analysis of variance (ANOVA) was performed to determine the significance of FSW parameters. Table 7, 8, 9, 10 and 11 shows the summary of the results of the ANOVA for the FSW experiments with the Al-4.2Mg-0.6Mn-0.4Sc-0.1Zr alloy for H, UTS, %E, BS and IS. Table 8. Analysis of variance (ANOVA) for Tensile strength Sum Degree Source of of F-value P-value Squares Freedom model 13013.2 9 23.41 0.0001 AL 484.0 1 7.84 0.019 RS 25.0 1 0.40 0.539 TS 3660.2 1 59.27 0.000 AL*RS 40.5 1 0.66 0.437 AL*TS 8.0 1 0.13 0.726 RS*TS 50.0 1 0.81 0.389 2 AL 4160.5 1 67.37 0.000 RS2 3246.8 1 52.57 0.000 TS2 5008.3 1 81.10 0.000 Lack of fit 282.2 5 0.84 0.573 Pure error 335.3 5 Cor. Total 13630.8 19 R-squared 95.47% Adj- R Squared 91.39% Pre R-Squared 80.13% Table 9. Analysis of variance (ANOVA) for % Elongation Sum Degree Source of of F-value P-value Squares Freedom model 59.3822 9 7.10 0.003 AL 6.0639 1 6.53 0.029 RS 0.0039 1 0.00 0.950 TS 48.4764 1 52.17 0.000 AL*RS 0.0078 1 0.01 0.929 AL*TS 1.1628 1 1.25 0.289 RS*TS 0.0078 1 0.01 0.929 AL2 0.2486 1 0.27 0.616 2 RS 3.0700 1 3.30 0.099 TS2 1.2664 1 1.36 0.270 Lack of fit 5.6439 5 1.55 0.322 Pure error 3.6483 5 Cor. Total 68.6744 19 R-squared 86.47% Adj- R Squared 74.29% Pre R-Squared 24.29% -
202
2018 SjF STU Bratislava
Significant Significant Insignificant Significant Insignificant Insignificant Insignificant Significant Significant Significant Insignificant -
Significant Significant Insignificant Significant Insignificant Insignificant Insignificant Insignificant Insignificant Insignificant Insignificant -
Volume 68, No. 3, (2018)
Table 10. Analysis of variance (ANOVA) for Bending strength Sum Degree Source of of F-value P-value Squares Freedom model 4071863 9 10.87 0.000 AL 131044 1 3.15 0.106 RS 625 1 0.02 0.905 TS 1115136 1 26.80 0.000 AL*RS 313 1 0.01 0.933 AL*TS 25313 1 0.61 0.453 RS*TS 85 1 0.00 0.965 AL2 739860 1 35.78 0.000 2 RS 645885 1 25.98 0.000 TS2 1413604 1 33.97 0.000 Lack of fit 206936 5 0.99 0.505 Pure error 209191 5 Cor Total 4487990 19 R-squared 90.73% Adj- R Squared 82.38% Pre R-Squared 56.58% -
Significant Insignificant Insignificant Significant Insignificant Insignificant Insignificant Significant Significant Significant Insignificant -
Table 11. Analysis of variance (ANOVA) for Impact strength Sum Degree Source of of F-value P-value Squares Freedom model 142.479 9 16.74 0.000 Significant AL 9.766 1 10.33 0.009 Significant RS 0.391 1 0.41 0.535 Insignificant TS 47.266 1 49.99 0.000 Significant AL*RS 0.195 1 0.21 0.659 Insignificant AL*TS 0.195 1 0.21 0.659 Insignificant RS*TS 0.000 1 0.00 1.000 Insignificant AL2 23.906 1 49.45 0.000 Significant RS2 19.210 1 33.91 0.000 Significant 2 TS 41.550 1 43.95 0.000 Significant Lack of fit 4.442 5 0.89 0.551 Insignificant Pure error 5.013 5 Cor Total 151.934 19 R-squared 93.78% Adj- R Squared 88.18% Pre R-Squared 72.19% The predicted model validation was tested by means of the P-value with 95% confidence level, implies that the model and independent variables are significant. In the investigation, it was observed that the F-value and P-value for the five responses (H, UTS, %E, BS and IS) were equal to 5.79, 23.41, 7.10, 10.87, 16.74, 0.006, 0.0001, 0.003, 0.000 and 0.000, respectively. The value of R2 for the predicted model equal to 83.90%, 95.47%, 86.47%, 90.73 % and 93.78% for the mechanical properties (H, UTS, %E, BS and IS) confirm that the predicted model and experimental data were in good agreement.
Volume 68, No. 3, (2018)
2018 SjF STU Bratislava
203
The normal probability plots for the H, UTS, %E, BS and IS are shown in Fig. 5(a-e). Fig. 5(a-e) and the results for R2 value indicate good agreement between the calculated and observed results within the range of experiment. (a)
(b)
204
2018 SjF STU Bratislava
Volume 68, No. 3, (2018)
(c)
(d)
Volume 68, No. 3, (2018)
2018 SjF STU Bratislava
205
(e)
Figure 5. Normal probability plots (a) Hardness (b) Ultimate Tensile strength (c) % Elongation (d) Bending Strength (e) Impact Strength (a)
Contour Plots of H RS*AL
1 600 1 400
35
1 200
30
1 000
25
800
4
6
8
TS*AL
40
10
12
1 400
1 600
20
4
6
8
H < 40 40 – 60 60 – 80 80 – 1 00 > 1 00
10
12
Hold Values AL 12 RS 1 600 TS 40
TS*RS
40 35 30 25 20 800
206
1 000
1 200
2018 SjF STU Bratislava
Volume 68, No. 3, (2018)
(b)
Contour Plots of UTS RS*AL
1 600 1 400
35
1 200
30
1 000
25
800
4
6
8
TS*AL
40
20
10
12
1 400
1 600
4
6
8
UTS < 1 00 1 00 – 1 25 1 25 – 1 50 1 50 – 1 75 1 75 – 200 200 – 225 > 225
10
Hold Values AL 8 RS 1 200 TS 30
12
TS*RS
40 35 30 25 20 800
1 000
1 200
(c)
Contour Plots of %E RS*AL
1 600 1 400
35
1 200
30
1 000
25
800
20
4
6
8
TS*AL
40
10
12
1 400
1 600
0 2 4 6 8
4
6
TS*RS
40
8
10
12
%E < 0 – 2 – 4 – 6 – 8 – 10 > 10
Hold Values AL 8 RS 1 200 TS 30
35 30 25 20 800
Volume 68, No. 3, (2018)
1 000
1 200
2018 SjF STU Bratislava
207
Contour Plots of BS
(d) RS*AL
1 600 1 400
35
1 200
30
1 000
25
800
4
6
8
TS*AL
40
10
12
1 400
1 600
20
500 1 000 1 500 2000 2500
4
6
8
10
12
TS*RS
40
BS < – – – – – >
500 1 000 1 500 2000 2500 3000 3000
Hold Values AL 8 RS 1 200 TS 30
35 30 25 20 800
1 000
1 200
(e)
Contour Plots of IS RS*AL
1 600 1 400
35
1 200
30
1 000
25
800
4
6
8
TS*AL
40
10
12
1 400
1 600
20
-5.0 -2.5 0.0 2.5 5.0 7.5
4
6
8
TS*RS
40
10
12
IS < – – – – – – >
-5.0 -2.5 0.0 2.5 5.0 7.5 1 0.0 1 0.0
Hold Values AL 8 RS 1 200 TS 30
35 30 25 20 800
1 000
1 200
Fig. 6. Contour plots (a) Hardness (b) Ultimate Tensile strength (c) % Elongation (d) Bending Strength (e) Impact Strength Fig. 7 shows the surface response plots obtained from the regression model were drawn from RSM. These three dimensional response surfaces indicate the optimal response points at apex. It can be observed that (Fig. 7(a-e)) the maximum tensile strength, impact strength and bending strength values were obtained at an applied load of 8kN, rotational speed of 1200 rpm, welding speed of 25 mm/min. 208
2018 SjF STU Bratislava
Volume 68, No. 3, (2018)
Surface Plots of H
(a)
Hold Values AL 8 RS 1 200 TS 30 125
120
H
100
H
100
80
1600
75
40
60
1200 RS
50
30 T S
4
8
AL
12
4
800
8
AL
12
20
125
H
100 75
40
50
30 T S
800
1200
RS
1600
20
Surface Plots of UTS
(b)
Hold Values AL 8 RS 1 200 TS 30 250
250
UT S 200
UT S 1600
150
1200 RS
4
8
AL
12
800
200 150
40
100 4
30 T S 8
AL
12
20
250
UT S
200 150
40
100 800
30 T S 1200
RS
Volume 68, No. 3, (2018)
1600
20
2018 SjF STU Bratislava
209
(c)
Surface Plots of %E Hold Values AL 8 RS 1 200 TS 30 8
10
%E 6
%E 5
4
1 0 160 12000 RS
4
8
AL
12
40 0 4
800
30 T S 8
AL
12
20
12
%E
9 6
40
3 800
30 T S 1200
RS
1600
20
Surface Plots of BS
(d)
Hold Values AL 8 RS 1 200 TS 30 3000
3000
BS 2500
BS 2000
2000
1600
1500
1200 RS
4
8
AL
12
800
1000 0
40 4
30 T S 8
AL
12
20
3000
BS
2000
40
1000 800
30 T S 1200
RS
210
1600
20
2018 SjF STU Bratislava
Volume 68, No. 3, (2018)
(e)
Surface Plots of IS Hold Values AL 8 RS 1 200 TS 30 12
IS
10
8
IS 5
4
1600
0
1200 RS
4
8
AL
12
800
0
40
-5 4
30 T S 8
AL
12
20
12 8
IS 4
40
0
30 T S
800
1200
RS
1600
20
Fig. 7. Surface plots (a) Hardness (b) Ultimate Tensile strength (c) % Elongation (d) Bending Strength (e) Impact Strength 3.3
Effect of process parameters
The effect of each process parameter on the H, UTS, %E, BS and IS can be analyzed with the main effects plots and interaction plots presented in the Fig. 8 (a-e) and Fig. 9 (a-e) respectively. From the mean effects plotted in Fig. 8(a) observed that the hardness decreased with increase in applied load from 4kN to 12kN, because the temperature increases with increases in load, thereby material gets high deformation due to friction generated between tool shoulder and the work piece. The hardness decreased with increase in tool rotational speed, because with increase tool rotational speed generates high heat, sequentially material gets soften which decline in hardness. The hardness decreased with increased tool traverse speed, due to low precipitate distribution and/or rather than grain size in the weld. From the mean effects plotted in Fig. 8(b) it was observed that the lower UTS value was obtained when applied loads were 4 kN and 12 kN. The UTS first increased up to 8 kN and further increase in applied load decreased the UTS, due to frictional heat generation between tool shoulder and surface of the plate and decrease in cross-section of the plate with increase in applied load leads to decrease in UTS[27]. When tool rotational speeds were 800 rpm and 1600 rpm, low value of UTS is noticed. The UTS first increased upto 1200 rpm due to refinement of grains and further increase in rotational speed decreased the UTS, due to formation of excessive material on the surface of the stirred zone results in voids. Due to insufficient stirring action at lower speeds leads to decrease in UTS. The lesser UTS was obtained when tool traverse speed were 20 mm/min and 40 mm/min. The UTS first increased upto 25 mm/min and further increase in traverse speed decreased the UTS, due to poor strengthen of material. Similar trend was observed for the bend strength (Fig.8 (d)) and impact strength (Fig.8 (e))[28]. From Fig.8(c) observed that the elongation decreased upto an applied load of 8kN (may be due to grain size reduction) and then increased upto an applied load of 12kN (may be due to Volume 68, No. 3, (2018)
2018 SjF STU Bratislava
211
reduction in cross-section). The increase in tool rotational speed increases the plasticity of the material with denser precipitates formation leads to decrease in elongation. The increase in tool traverse speed increased the elongation upto 30mm/min due to sufficient material flow and then decreased due to insufficient material flow which causes voids. (a)
Main Effects Plot for H Fitted Means TS
RS
AL 1 1 2.5
Mean of H
1 1 0.0
1 07.5
1 05.0
1 02.5
1 00.0
1 2 800
8
4
(b)
1 200
1 60020
30
40
Main Effects Plot for UTS Fitted Means AL
RS
TS
240 230 Mean of UTS
220 21 0 200 1 90 1 80 1 70 1 60 1 50 4
8
1 2 800
1 200
1 60020
30
40
All displayed terms are in the model.
212
2018 SjF STU Bratislava
Volume 68, No. 3, (2018)
(c)
Main Effects Plot for %E Fitted Means AL
8
RS
TS
Mean of %E
7
6
5
4
3 4
8
1 2 800
(d)
1 200
1 60020
30
40
Main Effects Plot for BS Fitted Means AL
3500
RS
TS
Mean of BS
3000
2500
2000
4
8
1 2 800
1 200
1 60020
30
40
All displayed terms are in the model.
Volume 68, No. 3, (2018)
2018 SjF STU Bratislava
213
(e)
Main Effects Plot for IS Fitted Means AL
RS
TS
11 10
Mean of IS
9 8 7 6 5 4 3 2 4
8
1 2 800
1 200
1 60020
30
40
All displayed terms are in the model.
Fig. 8 Mean Effect plot for (a) Hardness (b) Ultimate Tensile strength (c) % Elongation (d) Bending Strength (e) Impact Strength The interaction plots for the responses is shown in Fig. 9(a-e), it can be seen that the effect of interaction do not occur when the lines on the interaction plots are parallel and sturdy interactions occur when the lines go across. Fig. 9 reveals strong interaction effect between the process parameters on UTS is much greater than the interaction effect of process parameters on IS and BS. (a)
214
2018 SjF STU Bratislava
Volume 68, No. 3, (2018)
(b)
(c)
Volume 68, No. 3, (2018)
2018 SjF STU Bratislava
215
(d)
(e)
Fig. 9 Interaction plots for (a) Hardness (b) Ultimate Tensile strength (c) % Elongation (d) Bending Strength (e) Impact Strength 3.4
Optimizing Parameters
The objective functions selected for optimize the H, UTS, %E, BS and IS are given by Eqs.3-7 respectively. Constraints for optimization condition was adopted by choosing the desired values for each factor and response, and details are presented in Table 8. The constrained optimization problem is solved using desirability approach which is embedded in 216
2018 SjF STU Bratislava
Volume 68, No. 3, (2018)
the minitab17 statistical software. The optimised values for each condition are summarised in Table 9. The optimization plots for the condition used are presented in Fig. 10. Table 8 Constraints for optimization criteria Process parameter Unit Lower limit Upper limit AL kN 4 12 RS rpm 800 1600 TS mm/min 20 40 Table 9 Predicted optimized values AL RS TS Maximum 8.36 1220.20 26.86 (H) Maximum 8.36 1204.04 27.27 (UTS) Maximum 4 800 20 (%E) Maximum 8.52 1220.20 26.66 (IS) Maximum 8.28 1204.04 27.27 (BS) Maximum (H,UTS,%E, 9.66 1113.13 26.26 IS,and BS)
H
UTS
%E
IS
BS
120.38
-
-
-
-
-
244.80
-
-
-
-
-
-
11.22
-
-
3340.34
11.39
-
-
-
108.74
237.03
5.29
10.50 3173.75
(a)
Volume 68, No. 3, (2018)
2018 SjF STU Bratislava
217
(b)
(c)
218
2018 SjF STU Bratislava
Volume 68, No. 3, (2018)
(d)
(e)
Volume 68, No. 3, (2018)
2018 SjF STU Bratislava
219
(f) Fig. 10 Optimization plots (a) Maximize Hardness (b) Maximize Ultimate Tensile strength(b) Maximize % Elongation (d Maximize Bending strength) (e) Maximize Impact strength (f) Maximize all responses- Hardness, Ultimate Tensile strength, %Elongation,Impact strength and Bending strength 3.5
Confirmation test
The mathematical models were validated with the confirmation test carried out with the optimal FSW welding conditions. Predicted values and the values obtained by the experimental confirmation test were close enough. The validation results were summarised in Table 10. Table 10 Validation of optimised values based on confirmation tests AL RS TS H (kN) (rpm) (mm/min) (VHN) Maximum Predicted 9.66 1113.13 26.26 108.74 (H, UTS,%E, Maximum Experimental 9.66 1113.13 26.26 118.98 (H, UTS,%E) Error (%) 9.4
Maximum (IS and BS) Maximum (IS and BS) Error (%) 220
Predicted
9.66
1113.13
26.26
Experimental
9.66
1113.13
26.26
2018 SjF STU Bratislava
UTS (MPa) 237.03
%E 5.29
238.54
4.9
0.63
7.3
IS BS (KJ/m2) (MPa) 10.50 3173.75 11.25
3325.00
7.1
4.7
Volume 68, No. 3, (2018)
(a)
(c)
(b)
(d)
(f)
(e)
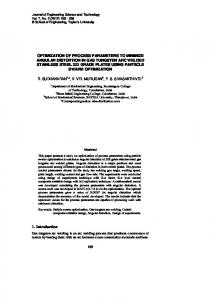
(g)
Fig. 11 Sem images (a) Al-4.2Mg-0.6Mn-0.4Sc-0.1Zr (b) Friction stir welded Al-4.2Mg-0.6Mn-0.4Sc-0.1Zr (top surface) (c) Friction stir welded Al-4.2Mg-0.6Mn-0.4Sc-0.1Zr (cross section) (d) Tensile frature before FSW (e) Tensile frature after FSW (f) Impact frature before FSW (g) Impact frature after FSW Large dimples in size was observed in tensile fracture of the alloy shown in Fig. 11 (d) indicates ductile fracture, when compared to the welded specimen due to considerable stirring action observed in FSW joint shown in Fig.11 (e)[29]. Fig. 11 (f) and (g) reveals the features of ductile fracture in the impact specimens before and after friction stir welding. CONCLUSION The following conclusions were drawn from the present research work 1. In this research work, Al-Mg-Mn alloy and Al-Mg-Mn-Sc-Zr alloys were successfully fabricated by stir casting technique 2. The effect of scandium and zirconium in the presence of Al-Mg-Mn was investigated in the bead on plate Friction stir welds.
Volume 68, No. 3, (2018)
2018 SjF STU Bratislava
221
3. The influences of three process parameters (applied load, tool rotational speed, and tool traverse speed) were studied by using the RSM method based on the central composite design approach. 4. The numerical and graphical optimization methods were successfully applied with the aid of Minitab17 statistical software. 5. The R2 values for the predicted model were equal to 83.90%, 95.47%, 86.47%, 90.73% and 93.78% for the responses (Hardness, Ultimate Tensile strength, %Elongation, Bending strength and Impact strength), revealed a good agreement between the independent variables and the response data. 6. Examined R-Square, adjusted R-Square and predicted R-Square for model adequacy check. 7. The proposed model by using RSM was in good agreement which was validated with a confirmation test. 8. The fine grains in the stirred zone on the surface of the optimised FSwelded Al4.2Mg-0.6Mn-0.4Sc-0.1Zr alloy was observed compared to Al-4.2Mg-0.6Mn-0.4Sc0.1Zr alloy. 9. Tensile and impact facture of the FSW joint observed to be ductile in nature.
ACKNOWLEDGEMENTS The authors would like to thank to the DST purse programme, advanced analytical laboratory Andhra University for providing the test facilities. REFERENCES [1]
C. J. Dawes. An introduction to friction stir welding and its development [J]. Weld Material Fabrication 1995 (63), 2 – 16.
[2]
W. M. Thomas, E. D. Nicholas, J. C. Needham, M. G. Murch, P. Templesmith, C. J. Dawes. ‘Improvements to Friction Welding’, GB Patent Application No. 9125978.8., 1991.
[3]
R. S. Mishra, ZY. Ma. Friction stir welding and processing. Material Science Engineering R50 2005, 1 – 78.
[4]
K. E. Knipstrom, B. Pekkari. Friction stir welding process goes commercial [J]. Welding Journal 1997 (76), No. 9, 55 – 57.
[5]
Y. S. Sato, M. Urata, H. Kokawa. Parameters controlling microstructure and hardness during friction-stir welding of precipitation-hardenable aluminum alloy 6063. Metallurgical Material Transactions A 2002 (33), 625 – 635.
[6]
A. K. Hassan, A. F. Norman, P. B. Prangnell. The effect of the welding conditions on the nugget zone in friction stir welds in an AA7010 alloy. Sixth International Trends in Welding Research Conference Proceeding 2002, 287 – 292.
[7]
T. Hirata, T. Oguri, H. Hagino, T. Tanaka, S.W. Chung, Y. Takigawa, K. Higashi. Influence of Friction Stir Welding Parameters on Grain Size and Formability in 5083 Aluminum Alloy. Materials Science and Engineering A 2006 (456), 344 – 349.
222
2018 SjF STU Bratislava
Volume 68, No. 3, (2018)
[8]
HE Zhen-bo, PENG Yong-yi, YIN Zhi-min, LEI Xue-feng. Comparison of FSW and TIG welded joints in Al-Mg-Mn-Sc-Zr alloy plates. Trans. Nonferrous Met. Soc. China 2011 (21), 1685 – 1691.
[9]
K. Elangovan, V. Balasubramanian. Influences of pin profile and rotational speed of the tool on the formation of friction stir processing zone in AA2219 aluminium alloy. Materials Science and Engineering A 2007 (459), 7 – 18.
[10] V. Balasubramanian. Relationship between base metal properties and friction stir welding process parameters. Materials Science and Engineering A 2008 (480), 397 – 403. [11] P. Murali Krishna, N. Ramanaiah, K. Prasada Roa. Optimization of process parameters for friction Stir welding of dissimilar Aluminum alloys (AA2024 -T6 and AA6351-T6) by using Taguchi method. International Journal of Industrial Engineering Computations 2013 (4), No. 1, 71 – 80. [12] K. Elangovan, V. Balasubramanian, S. Babu. Developing an Empirical Relationship to Predict Tensile Strength of Friction Stir Welded AA2219 Aluminum Alloy. Journal of Materials Engineering and Performance 2008 (17), No. 6, 820 – 830. [13] A. K. Lakshminarayanan, V. Balasubramanian. Comparison of RSM with ANN in predicting tensile strength of friction stir welded AA7039 aluminium alloy joints. Trans. Non Ferrous Met. Soc. China 2009 (19), 9 – 18. [14] S. Vijayan, R. Raju, K. Subbaiah, S. R. K. Rao. Friction Stir Welding of Al-Mg alloyOptimization of process parameters using Taguchi Technique. Exp. Tech. 2010 (34), No. 5, 37 – 44. [15] P. Periyasamy, B. Mohan, V. Balasubramanian, S. Raj Kumar, S. Venugopal. Multiobjective optimization of friction stir welding parameters using desirability approach to join Al/SiCp metal matrix composites. Trans. Nonferrous Met. Soc. China 2013 (23), 942 – 955. [16] F. Cioffi, J. I. Hidalgo, R. Fernandez, T. Pirling, B. Fernandez, D. Gesto, I. Puente Orench, P. Rey, G. Gonzalez-Doncel. Analysis of the unstressed lattice spacing, do, for the determination of the residual stress in a friction stir welded plate of an agehardneable aluminium alloy - Use of equilibrium condition and a genetic algorithm. Acta Materialia 2014 (74), 189 – 199. [17] M. Saeidi, B. Manafi, M. K. Besharati Givi, G. Faraji. Mathematical modelling and optimization of friction stir welding process parameters in AA5083 and AA7075 aluminim alloy joints. Proc/MechE, Part B; Journal of Engineering Manufacture 2016 (230), No 7, 1284 – 1294. [18] A. Baraka, G. Panoutsos, S. Cater. A real time quality monitoring framework for steel friction stir welding using computational intelligence. Journal of Manufacturing Processes 2015 (20), Part 1, 137 – 148. [19] R. Myers. Response Surface Methodology, Edwards Brothers, Ann Arbor, MI, 1976. [20] S. Ikeshita, A. Strodahs, Z. Saghi, K. Yamada, P. Burdet, S. Hata, K. - I. Ikeda, P.A. Midgley, K. Kaneko. Hardness and microstructural variation of Al-Mg-Mn-Sc-Zr alloy. Micron 2016 (82), 1 – 8. [21] D. Yu-lu, Q. Jian, X. Dan, C. Xue-min, X. Guo-fu. Effect of Sc and Er additions on superplastic ductilities in Al-Mg-Mn-Zr alloy. J. Cent. South Univ. 2016 (23), No. 6, 1283 – 1292. Volume 68, No. 3, (2018)
2018 SjF STU Bratislava
223
[22] Z. Yin, Q. Pan, Y. Zhang, F. Jiang. Effect of minor Sc and Zr on the microstructure and mechanical properties of Al-Mg based alloys. Materials Science and Engineering: A 2000 (280), No. 1, 151 – 155. [23] M. A. Elahi, S. G. Shabestari Effect of various melt and heat treatment conditions on impact toughness of A356 aluminum alloy [J]. Transactions of Nonferrous Metals Society of China 2016 (26), No. 4, 956 – 965. [24] Z. Liu, L. Li, J. Y., S. Li, Z. Wang, G. Wang. Influence of heat treatment conditions on bending characteristics of 6063 aluminum alloy sheets, Trans. Nonferrous Met. Soc. China 2017 (27), 1498 – 1506. [25] Z. Yin, Q. Pan, Y. Zhang, F. Jiang. Effect of minor Sc and Zr on the microstructure and mechanical properties of Al–Mg based alloys. Mater. Sci.Eng. A 2000 (280), 151 – 155. [26] T. Aiura, N. Sugawara, Y. Miura. The effect of scandium on the as-homogenized microstructure of 5083 alloy for extrusion. Materials Science and Engineering: A 2000 (280), No. 1, 139 – 145 [27] R. Jančo, L. Écsi, P. Élesztős. FSW Numerical Simulation of Aluminium Plates by SYSWELD – Part I. Journal of Mechanical Engineering – Strojnícky časopis 2016 (66), No. 1, 47 – 52. [28] R. Jančo, L. Écsi, P. Élesztős. FSW Numerical Simulation of Aluminium Plates by SYSWELD – Part II. Journal of Mechanical Engineering – Strojnícky časopis 2016 (66), No. 2, 29 – 36. [29] D. Santha Rao, N. Ramanaiah. Process Parametrization for Producing AA6061/TIB2 Composites by Friction Stir Processing. Journal of Mechanical Engineering – Strojnícky časopis 2017 (67), No. 1, 101 – 118. [30] P. Élesztős, R. Jančo, V. Voštiar. Optimization of Welding Process Using A Genetic Algorithm, Journal of Mechanical Engineering – Strojnícky časopis 2018 (68), No 2, 17 – 24.
224
2018 SjF STU Bratislava
Volume 68, No. 3, (2018)